 Dave’s notes:
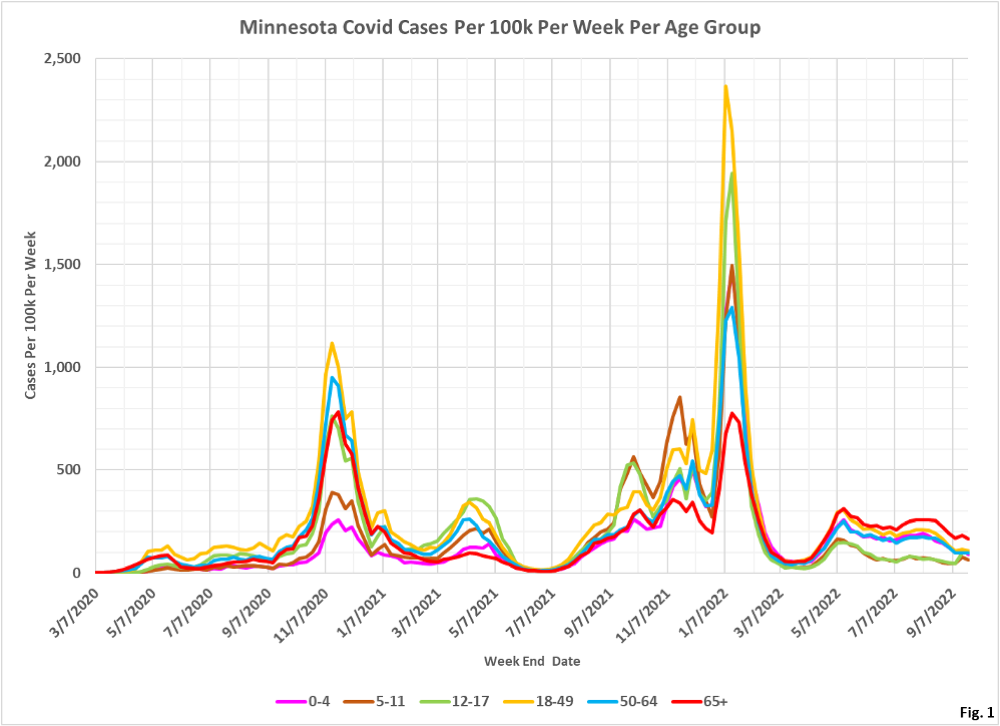
- These age structure charts display the rates per 100k of Covid cases, ICU hospital admissions, non-ICU hospital admissions, and deaths in Minnesota. These charts quantify the risk to an individual in each age group, in contrast to our other age structure charts sets which shows the overall numbers of cases, admissions, and deaths in total for each age group for each week. These charts are an update of the population rate charts we last posted here on 9/17/2022: https://healthy-skeptic.com/2022/09/17/age-structure-charts-population-rates-september-15/.
- The data for the charts on cases comes from the data file “cage.csv”, Case Rate by Age Group, published by the Minnesota Department of Health (MDH) here: https://www.health.state.mn.us/diseases/coronavirus/stats/case.html. The link to the data file is located in the notes under the graphic “Case Rate by Age Group”. Similarly, the data for hospital admissions is taken from the data file “hage.csv”, Hospitalization Rate by Age Group available here: https://www.health.state.mn.us/diseases/coronavirus/stats/hosp.html . The data in this data file is plotted without modification except that we are taking the difference between total hospital admissions and ICU admissions in order to display non-ICU admissions. Finally, the data for deaths is taken from the data file “dage.csv”, Mortality Rate by Age Group, available here” https://www.health.state.mn.us/diseases/coronavirus/stats/death.html.
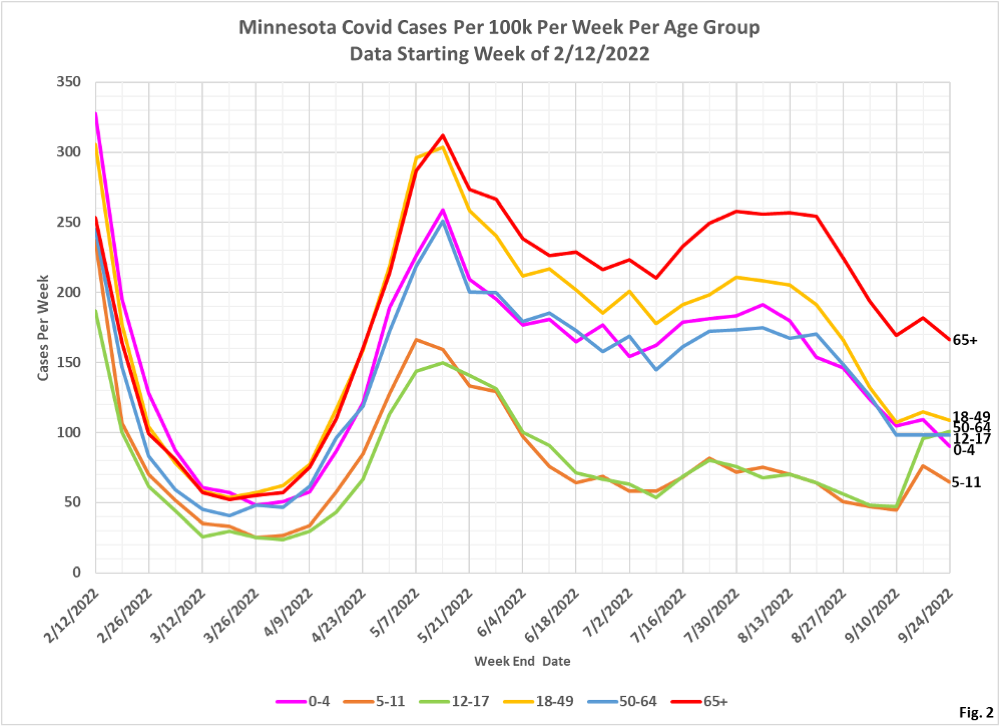
- Fig. 1 and 2: Covid Cases Per 100k Per Week. The decrease in case rates we had seen in the month of August has now stopped, and for the past two weeks the rates are fairly constant, although the 12-17 age group took a step up two weeks ago .
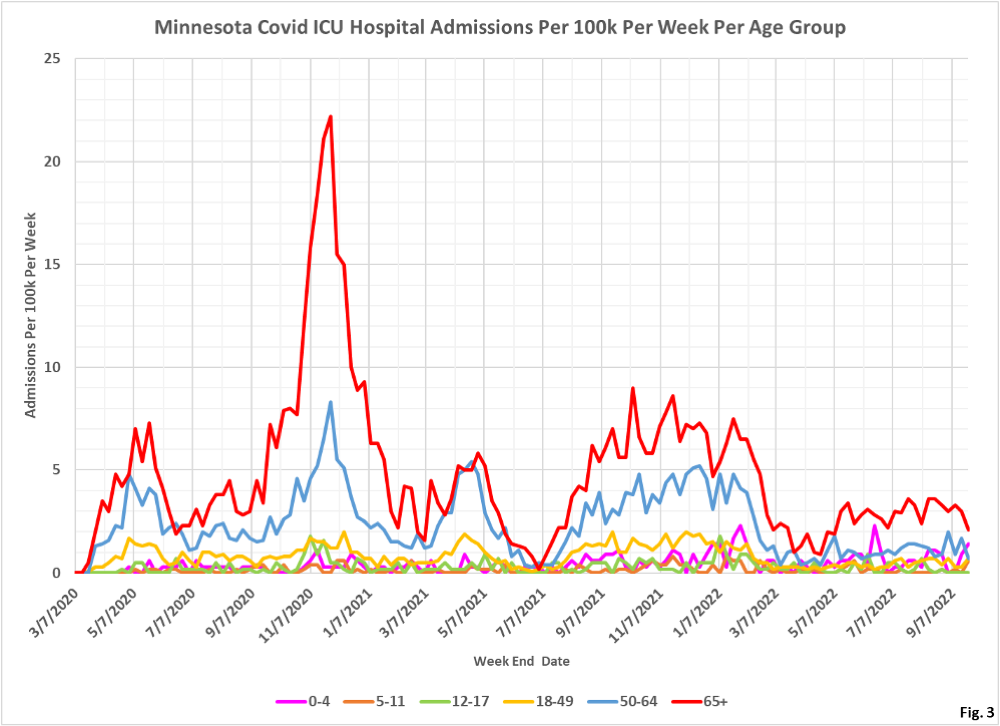
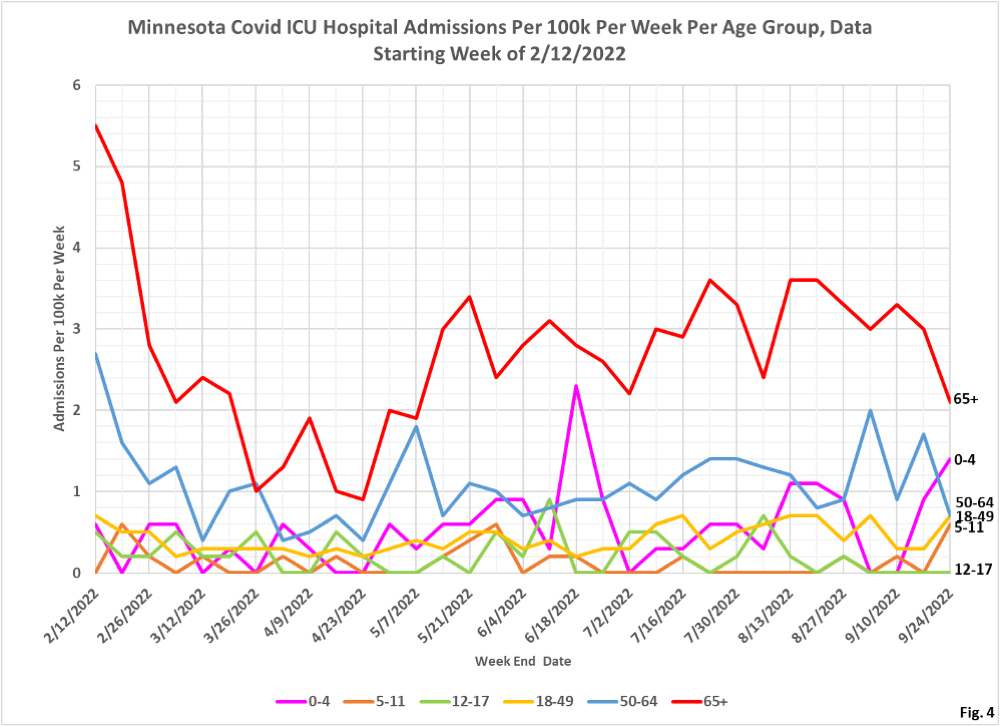
- Fig. 3 and 4: ICU Covid Admissions Per Week. ICU admissions remain somewhat range-bound. It is likely that some of the decrease in admissions in the 65+ age group will end up being revised higher next week, as we have seen in the past.
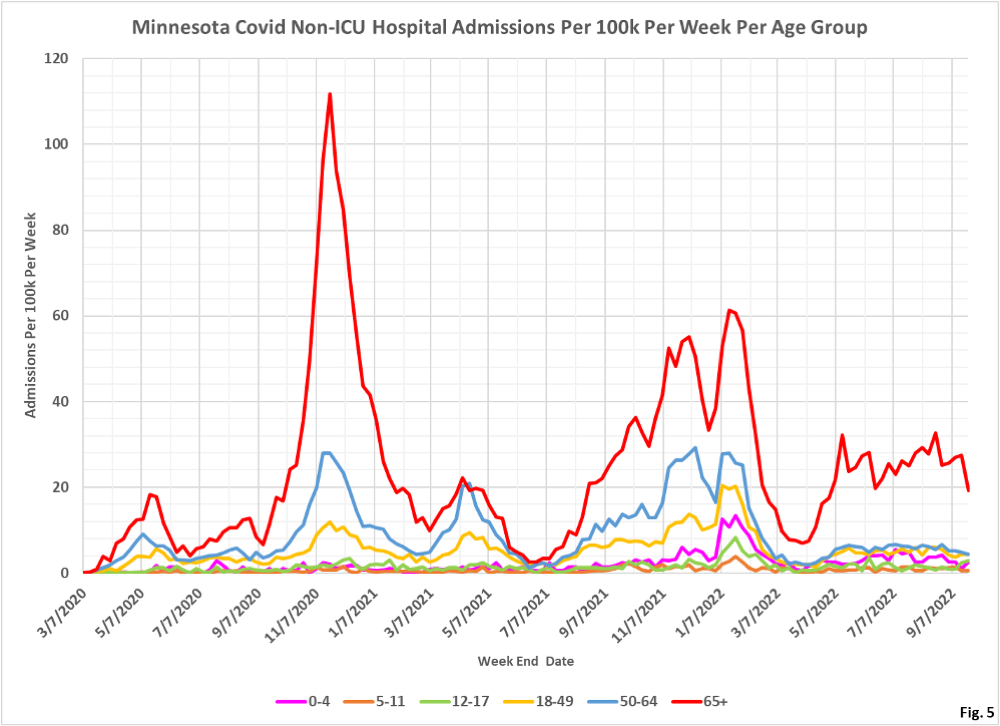
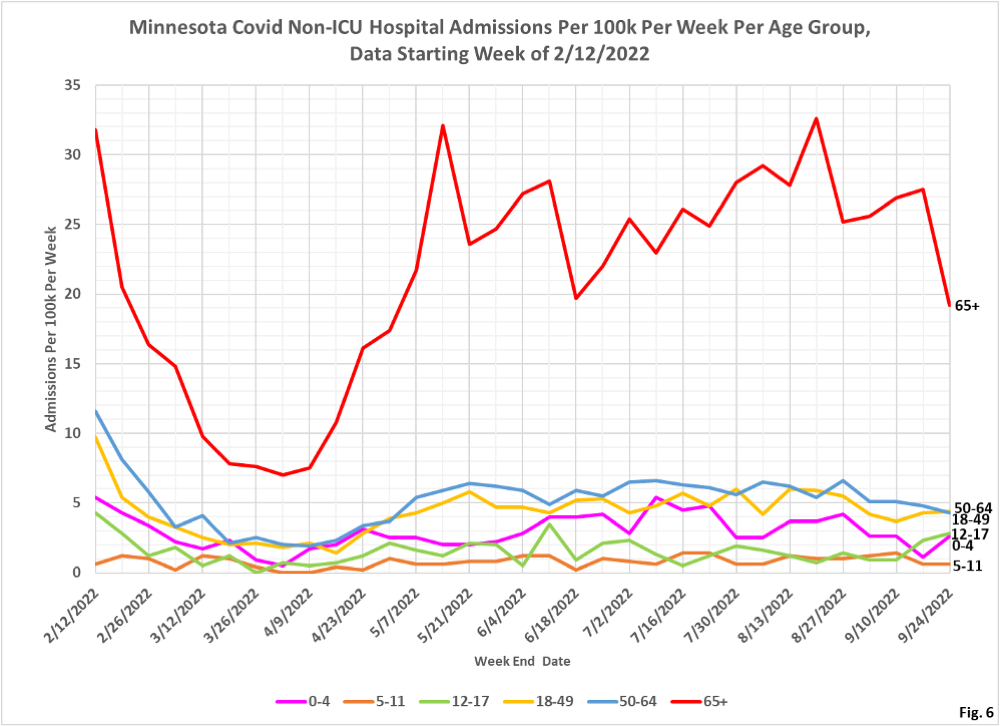
- Fig. 5 and 6: Non-ICU Covid Admissions Per Week. Similar to ICU admissions, Non-ICU admissions remain range-bound, with the 65+ age group by far the most likely to be hospitalized. The most recent data point is subject to being revised higher, so we should not get too excited about the drop in the rate of admissions for the 65+ age group.
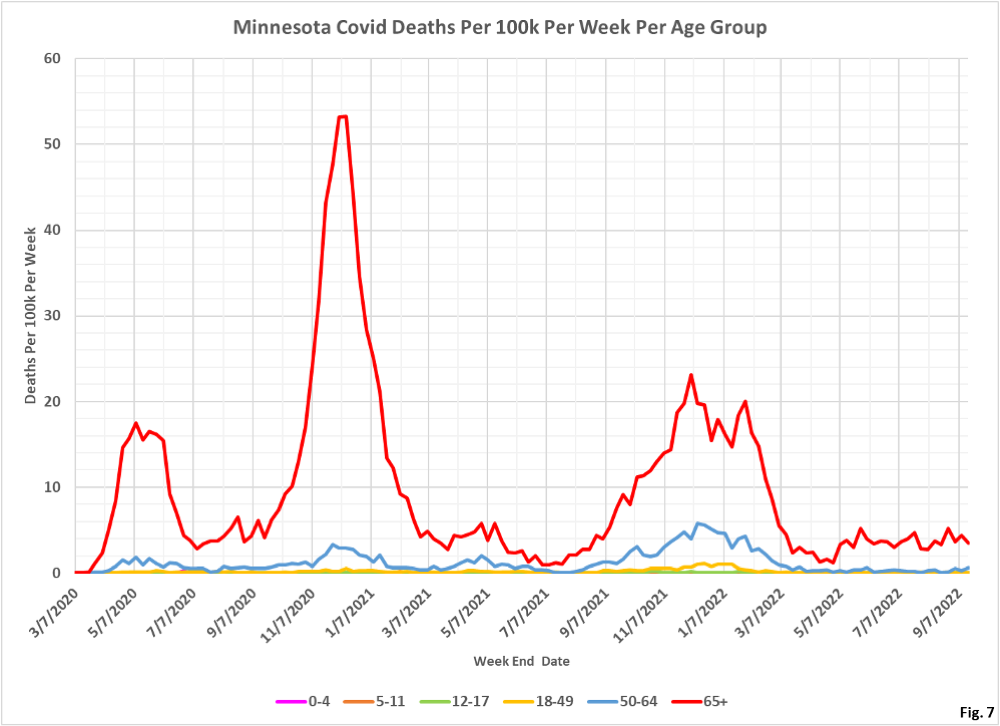
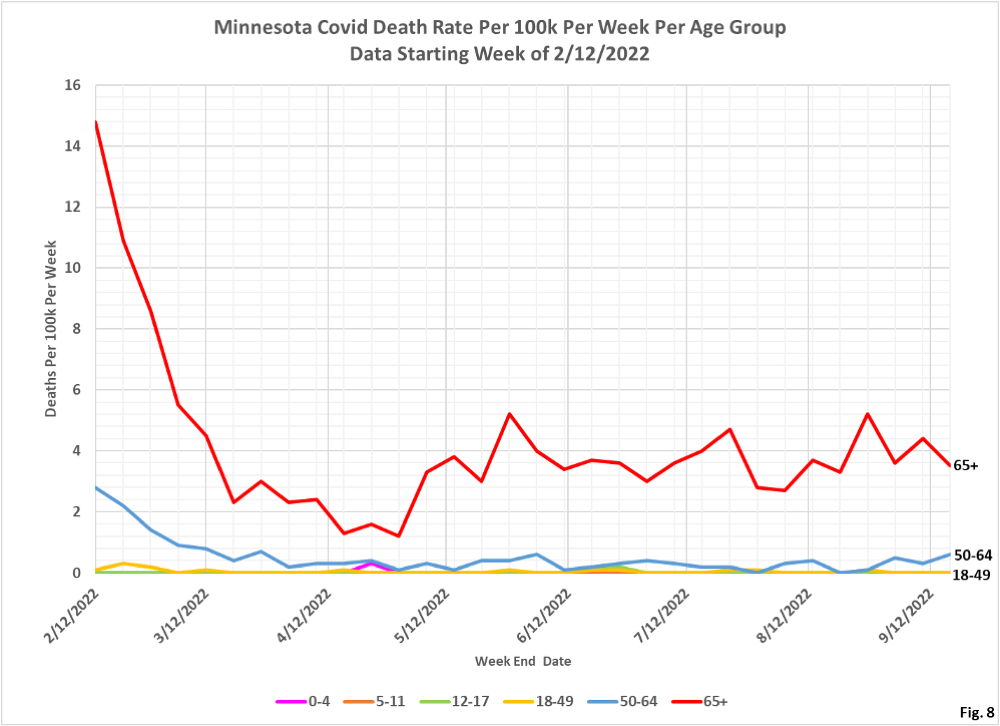
- Fig. 7 and 8: Covid Deaths Per Week. Due to reporting lags we are omitting the most recent week of data. Deaths in all age groups remain consistent with the range in the past several months, with the 65+ age group most as risk.
