 Dave’s notes:
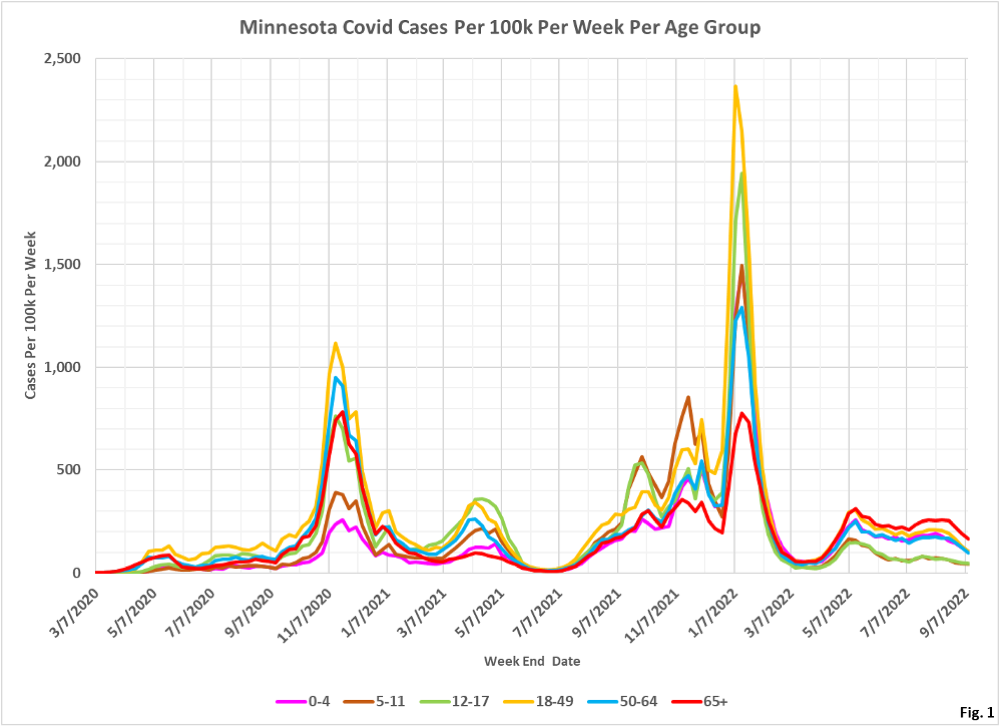
- These age structure charts display the rates per 100k of Covid cases, ICU hospital admissions, non-ICU hospital admissions, and deaths in Minnesota. These charts quantify the risk to an individual in each age group, in contrast to our other age structure charts sets which shows the overall numbers of cases, admissions, and deaths in total for each age group for each week. These charts are an update of the population rate charts we posted here on 9/13/2022: https://healthy-skeptic.com/
2022/09/13/age-structure- charts-september-10- population-rates/. - The data for the charts on cases comes from the data file “cage.csv”, Case Rate by Age Group, published by the Minnesota Department of Health (MDH) here: https://www.health.state.mn.
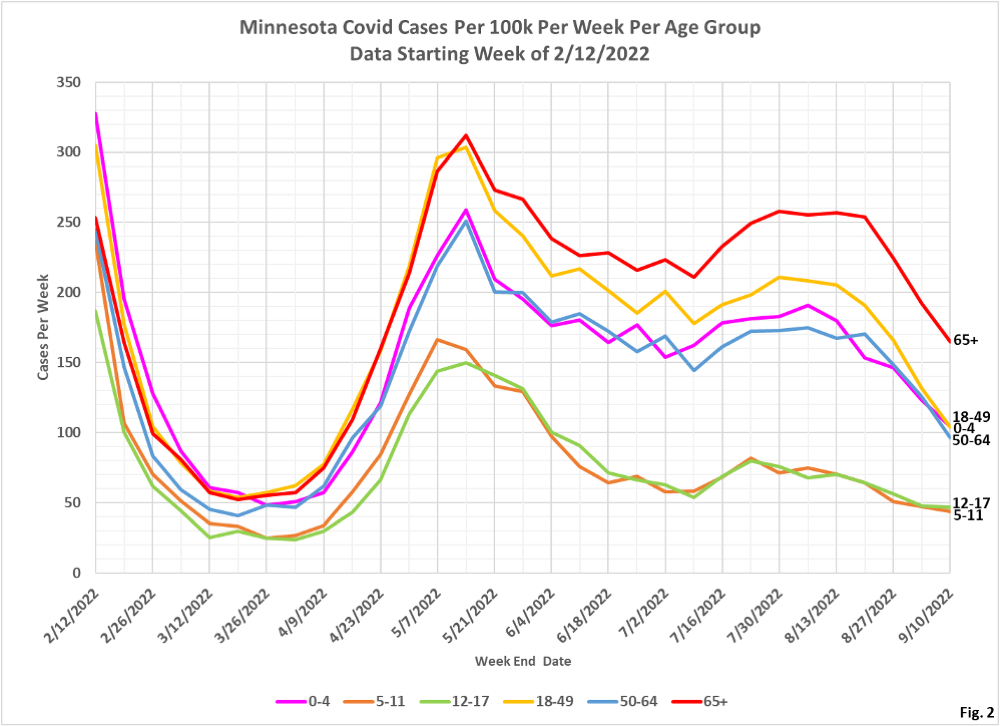
us/diseases/coronavirus/stats/ case.html. The link to the data file is located in the notes under the graphic “Case Rate by Age Group”. Similarly, the data for hospital admissions is taken from the data file “hage.csv”, Hospitalization Rate by Age Group available here: https://www.health.state.mn. us/diseases/coronavirus/stats/ hosp.html . The data in this data file is plotted without modification except that we are taking the difference between total hospital admissions and ICU admissions in order to display non-ICU admissions. Finally, the data for deaths is taken from the data file “dage.csv”, Mortality Rate by Age Group, available here” https://www.health.state.mn. us/diseases/coronavirus/stats/ death.html. - Fig. 1 and 2: Covid Cases Per 100k Per Week. For the week ending 9/10/2022, all age groups continue to drop. Rates in all age groups are the lowest reported since April 2022.
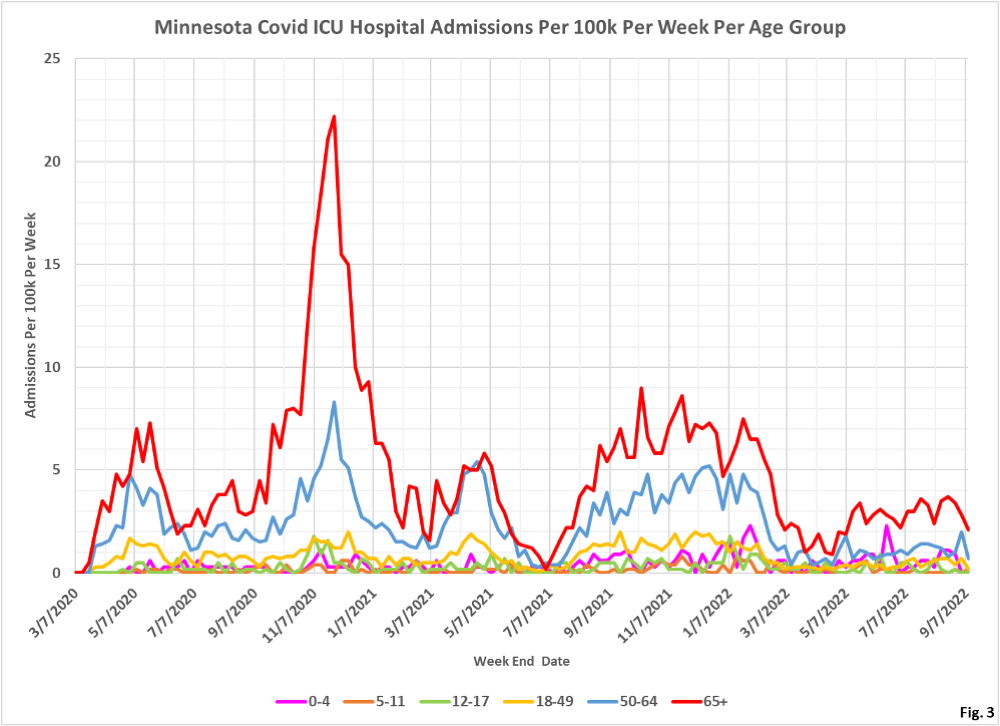
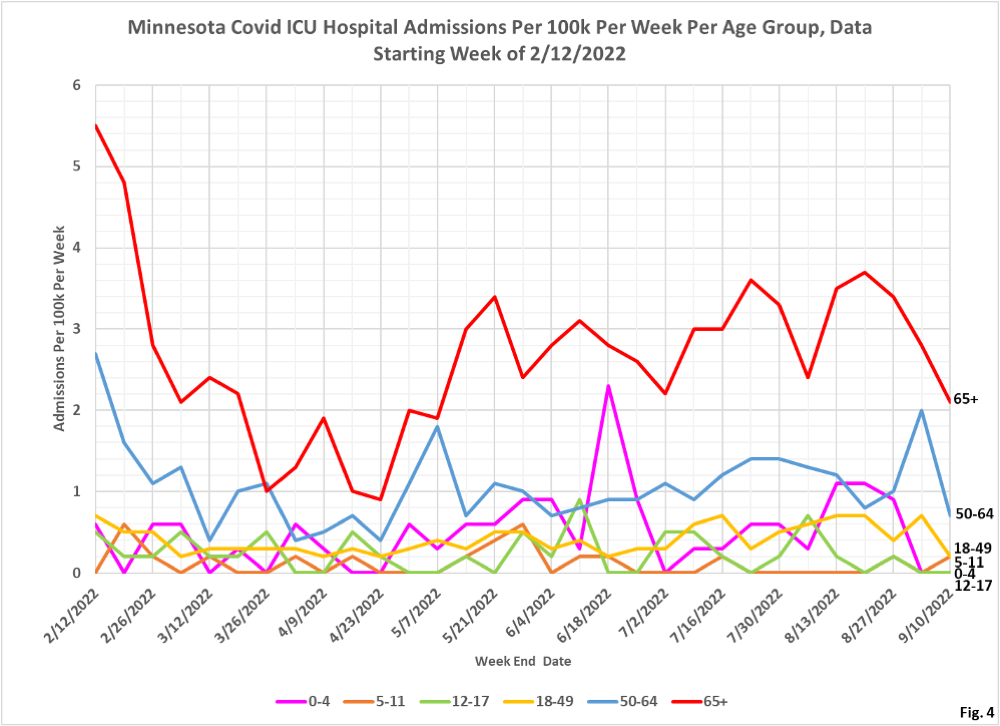
- Fig. 3 and 4: ICU Covid Admissions Per Week. There were significant reductions in the 65+ age group, although this group remains elevated compared to the other age groups.
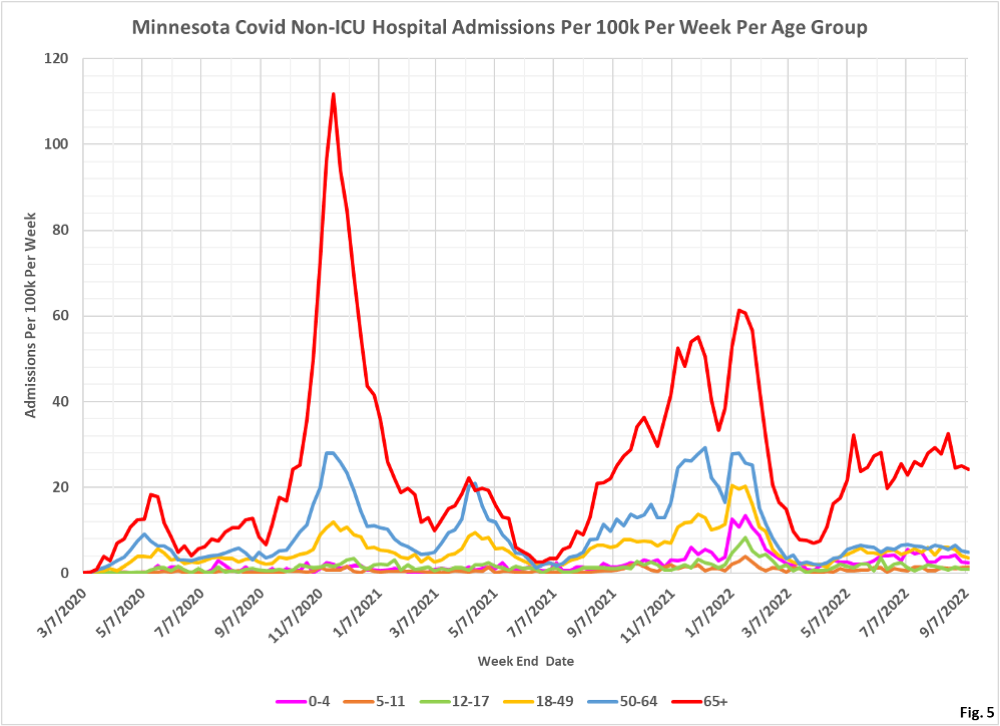
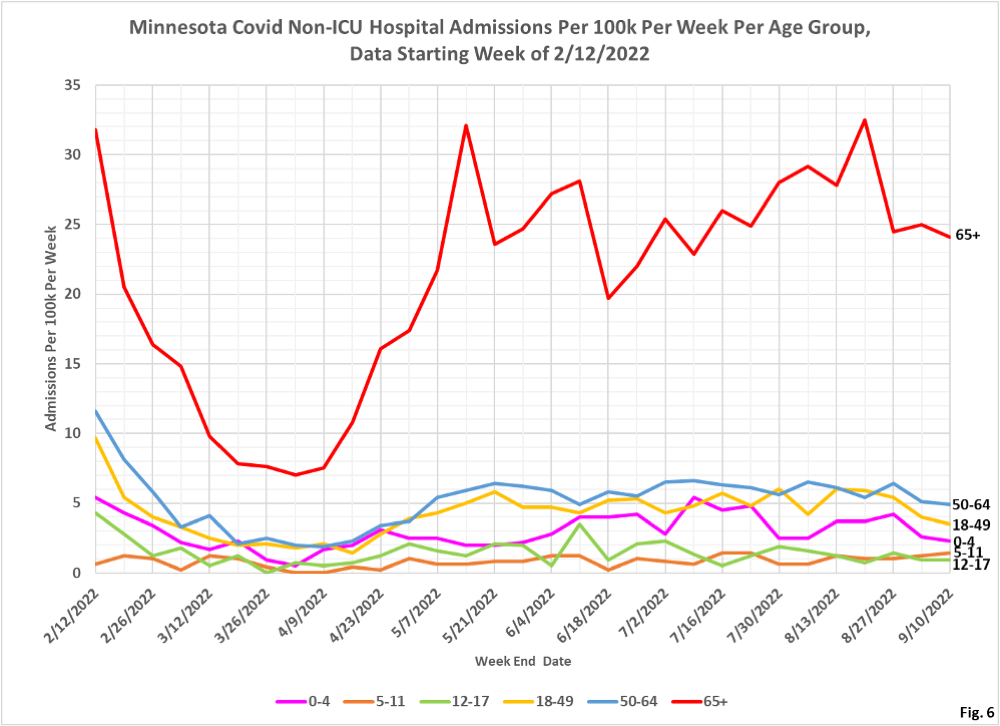
- Fig. 5 and 6: Non-ICU Covid Admissions Per Week. The 65+ age group remains considerably elevated compared to the other groups. The number of Non-ICU admissions for the 65+ age group also appears to not be dropping, despite the drop in the number of reported Covid cases.
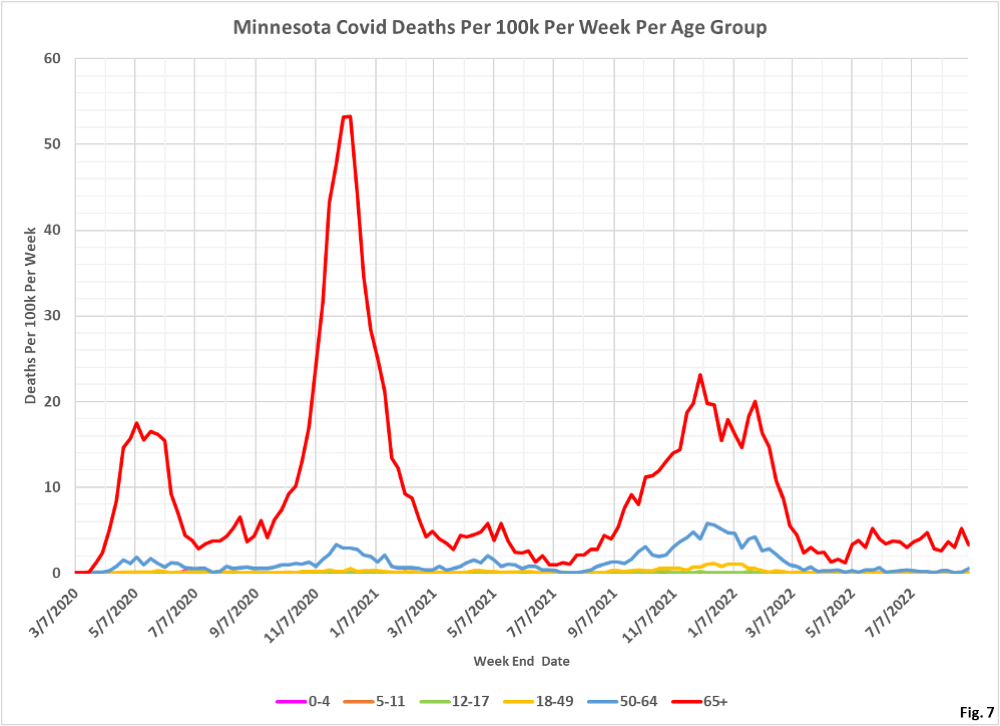
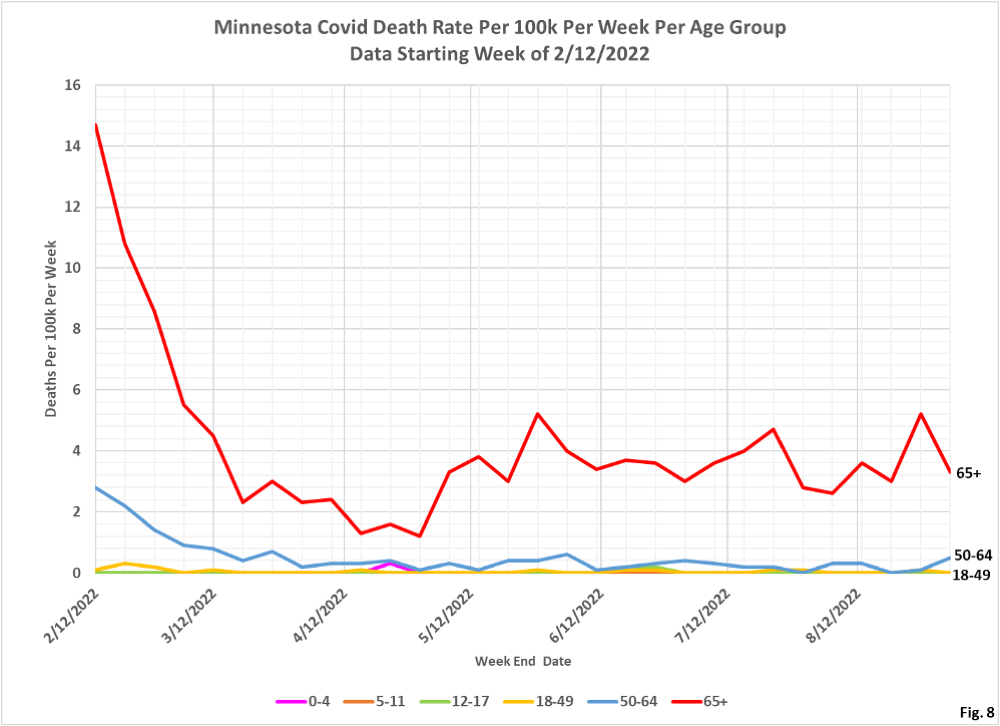
- Fig. 7 and 8: Covid Deaths Per Week. Due to reporting lags we are omitting the most recent week of data. Deaths in all age groups remain consistent with the range in the past several months.
