 Dave’s notes:
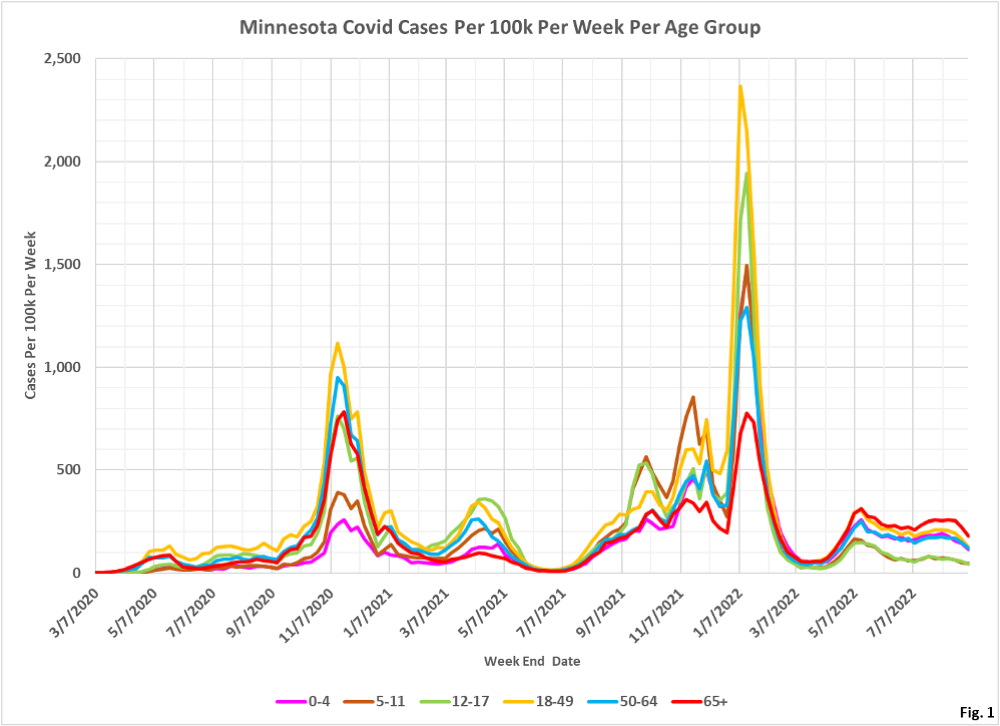
- These age structure charts display the rates per 100k of Covid cases, ICU hospital admissions, non-ICU hospital admissions, and deaths in Minnesota. These charts quantify the risk to an individual in each age group, in contrast to our other age structure charts sets which shows the overall numbers of cases, admissions, and deaths in total for each age group for each week. These charts are an update of the population rate charts we posted here on 9/04/2022: https://healthy-skeptic.com/
2022/09/04/age-structure- charts-september-1-population- rates/. - The data for the charts on cases comes from the data file “cage.csv”, Case Rate by Age Group, published by the Minnesota Department of Health (MDH) here: https://www.health.state.mn.
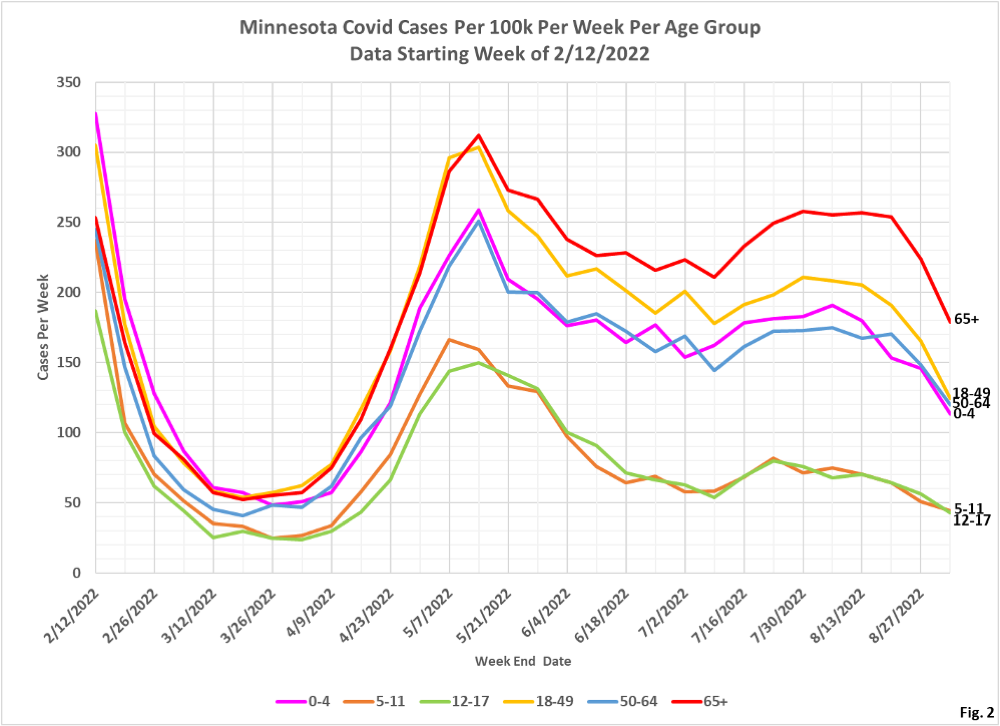
us/diseases/coronavirus/stats/ case.html. The link to the data file is located in the notes under the graphic “Case Rate by Age Group”. Similarly, the data for hospital admissions is taken from the data file “hage.csv”, Hospitalization Rate by Age Group available here: https://www.health.state.mn. us/diseases/coronavirus/stats/ hosp.html . The data in this data file is plotted without modification except that we are taking the difference between total hospital admissions and ICU admissions in order to display non-ICU admissions. Finally, the data for deaths is taken from the data file “dage.csv”, Mortality Rate by Age Group, available here” https://www.health.state.mn. us/diseases/coronavirus/stats/ death.html. - Fig. 1 and 2: Covid Cases Per 100k Per Week. For the week ending 9/03/2022, all age groups are significantly lower, especially the 0-4, 18-49, 50-64, and 65+ age groups. Rates in all age groups are the lowest reported since April 2022.
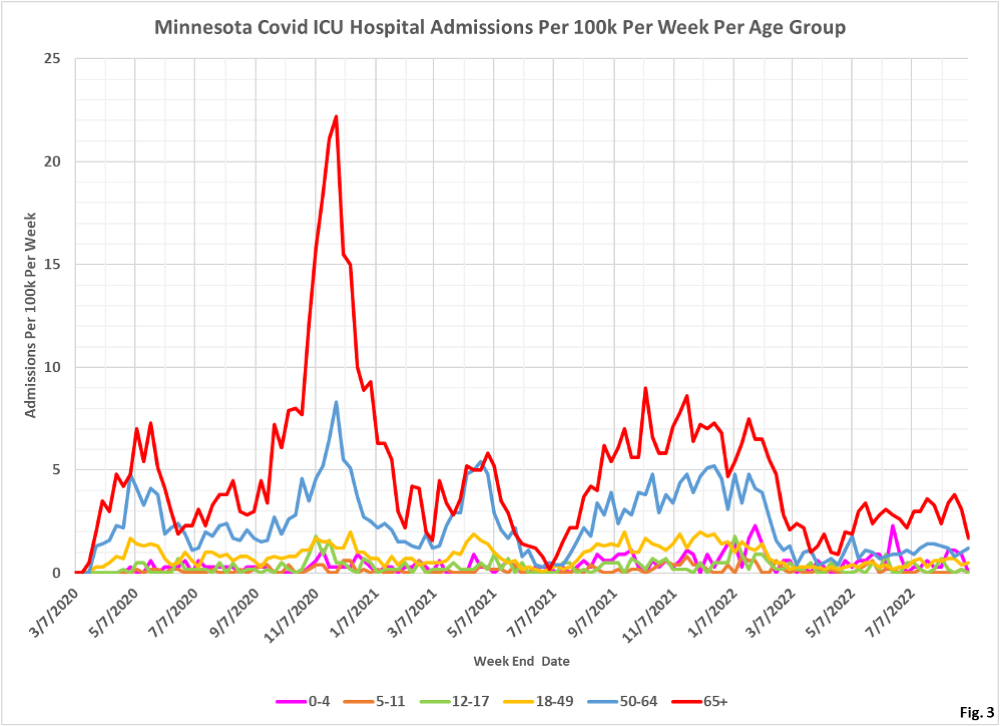
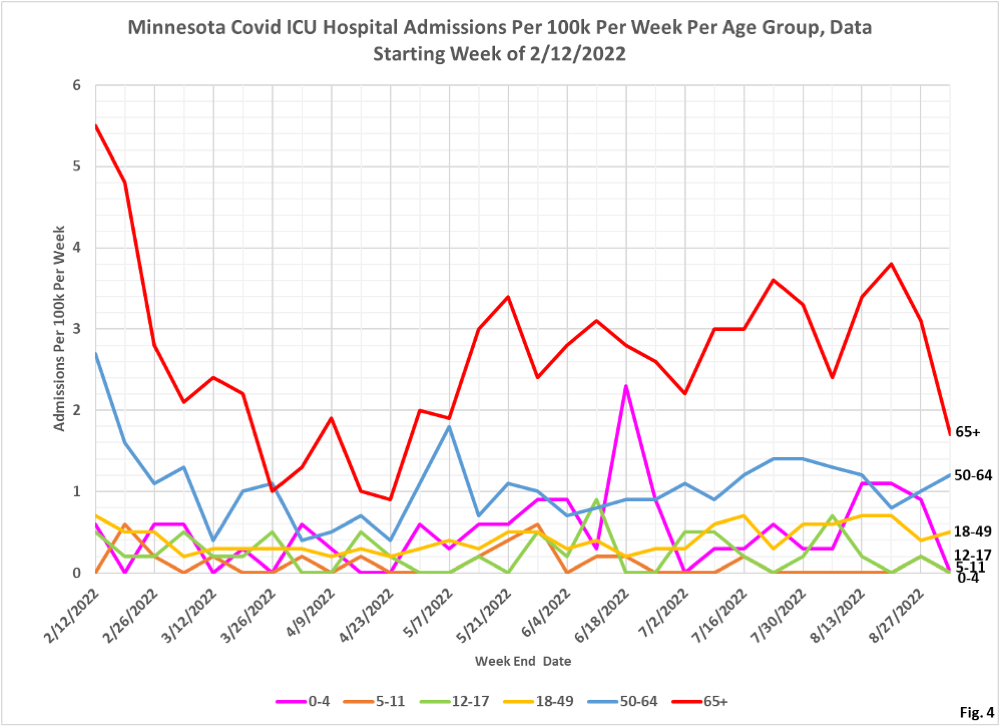
- Fig. 3 and 4: ICU Covid Admissions Per Week. There were significant reductions in the 65+ age group, while the age groups 17 and younger were all zero for the week of 9/03/2022.
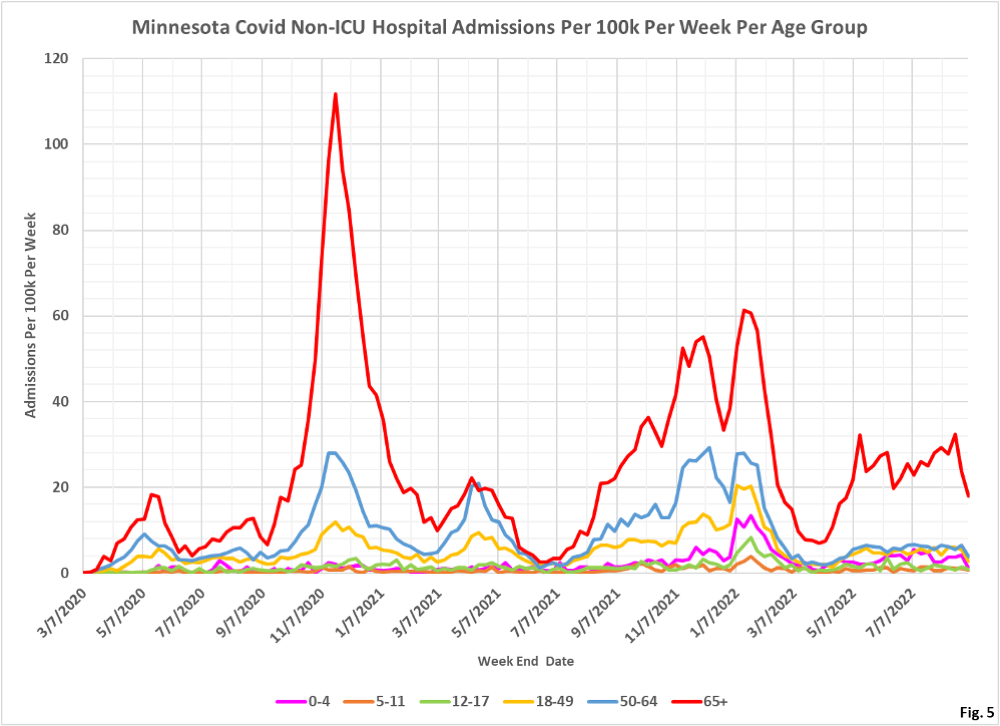
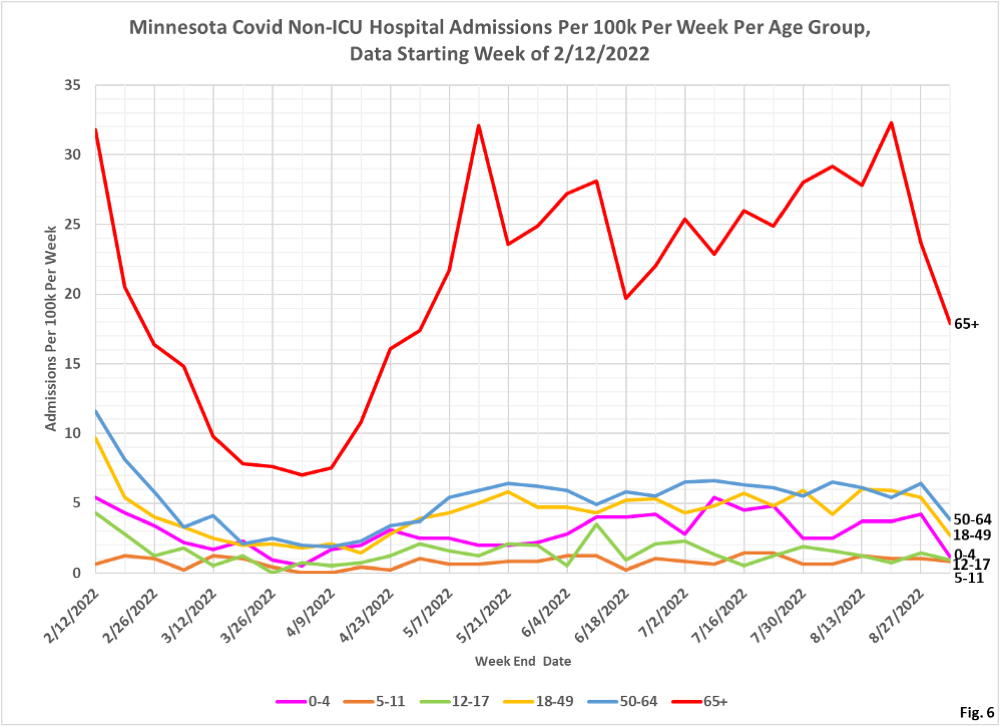
- Fig. 5 and 6: Non-ICU Covid Admissions Per Week. For the week of 9/03/2022 there is finally a discernible declining trend in all age groups, after being relatively constant for almost 5 months. Hopefully this declining trend continues.
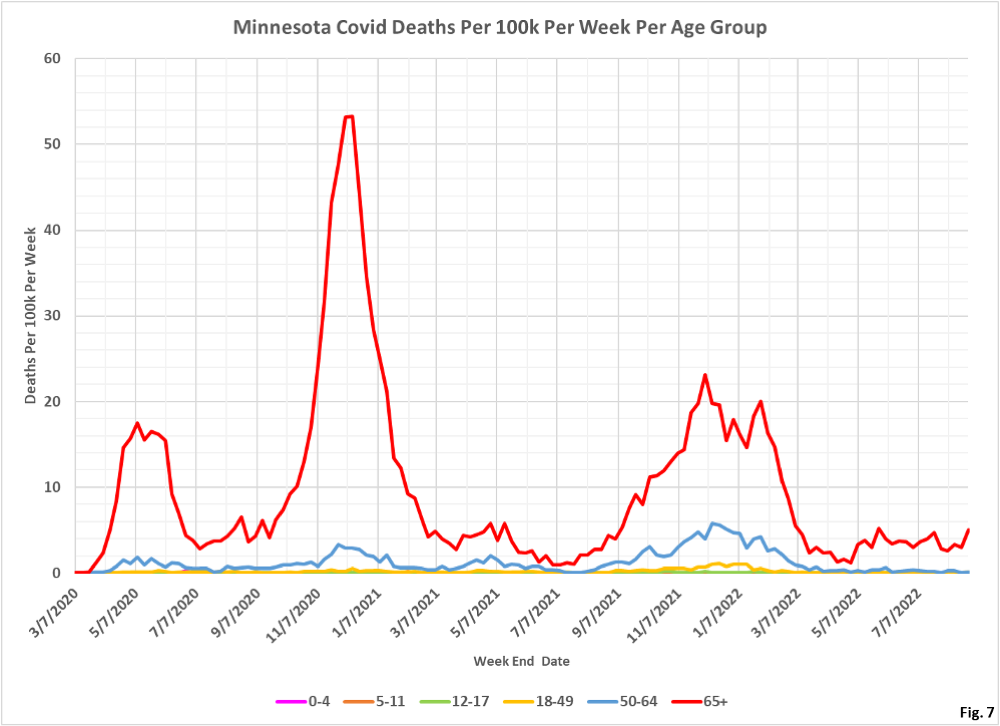
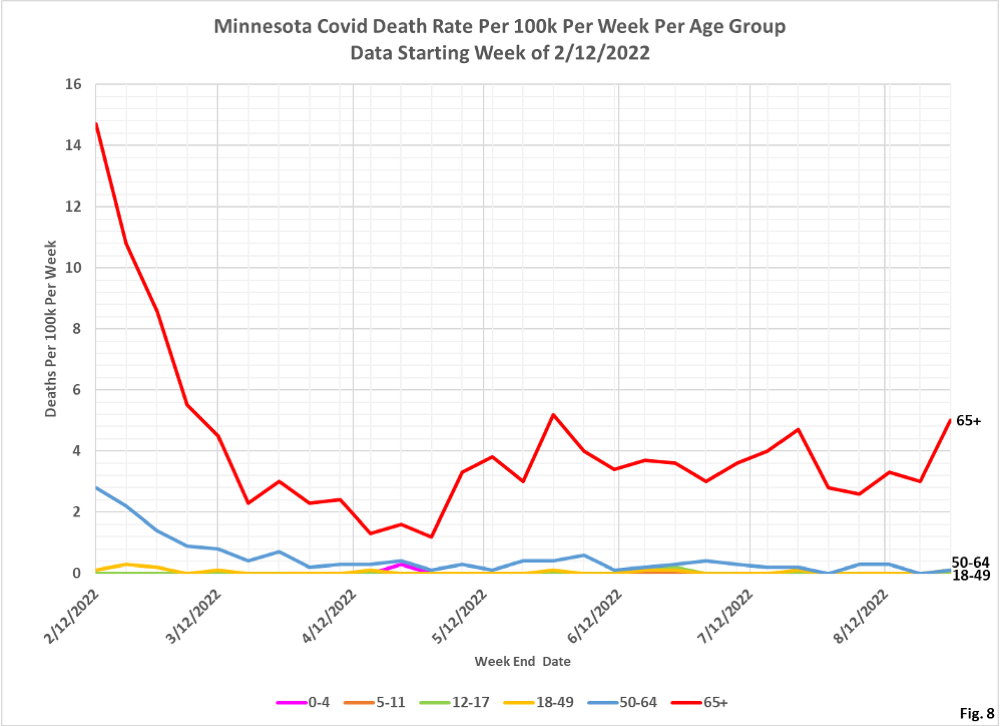
- Fig. 7 and 8: Covid Deaths Per Week. Due to reporting lags we are omitting the most recent week of data. For the week of 8/27/2022, the most recent week we have plotted data, the number of reported deaths in the 65+ age group were higher, despite reduction in cases and hospital admissions in this age group.
