The “Tripledemic” hype never quite caught on, probably because the public is exhausted from the CV-19 hysteria. We did have and may be continuing to have a bit of heavy flu season, although we appear past the peak. Here is Dave’s latest chart on influenza hospitalizations. Interesting to compare rates and impact of different age groups with CV-19. As with CV-19, the impact is disproportionately in the elderly. The peak this year occurred earlier than in other years, which could be due to the displacement of influenza earlier in the epidemic.
 Dave’s notes:
- We recently published charts showing influenza hospitalizations in Minnesota since 2009, here: https://healthy-skeptic.com/
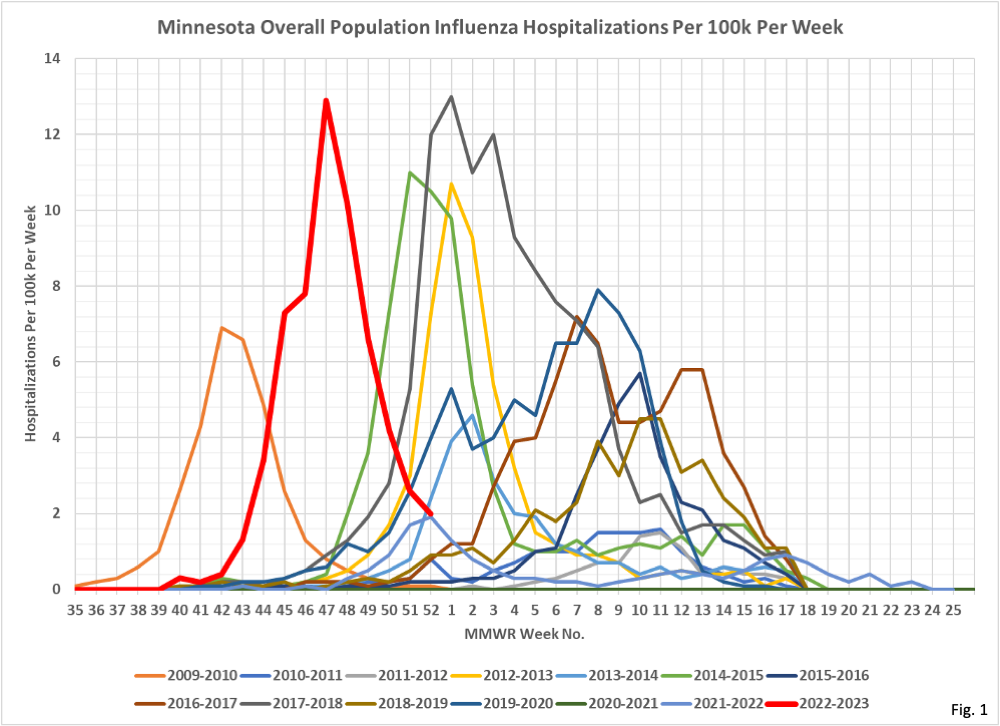
2022/11/25/influenza-season/. In today’s update we add several weeks of data from the 2022-2023 flu season, now extended to the week ending 12/25/2022. Hospitalizations for the 2022-2023 flu season peaked the week of 11/20/2022, receding rapidly since then. - Data for influenza hospitalizations per 100k per week in Minnesota are available from the CDC FluSurv-NET web page (https://www.cdc.gov/flu/
weekly/influenza- hospitalization-surveillance. htm). It is important to note that not all labs, clinics, and hospitals report influenza data to the Minnesota Department of Health (MDH) or to the CDC. Instead, there is a voluntary surveillance system in which a portion of medical facilities submit data and flu samples to the Minnesota Department of Health (MDH) weekly (https://www.health.state.mn. us/diseases/flu/stats/index. html), which are then forwarded to the CDC. The CDC states on the FluSurv-NET web page that the hospitalization data for Minnesota represents 55% of the state population. - Fig. 1, Minnesota Influenza Overall Hospital Admissions Per 100k Per Week, 2009-2010 Through 2022-2023 Season: The current 2022-2023 influenza season is shown in bright red. The hospitalization rate per 100k peaked the week ending 11/20/2022. In context with other years, the 2022-2023 was among the most severe, but we only have data back to 2009 for comparison. The 2017-2018 flu season peaked at almost the same hospitalization rate, and the 2014-2015 and 2012-2013 seasons were only slightly less severe.
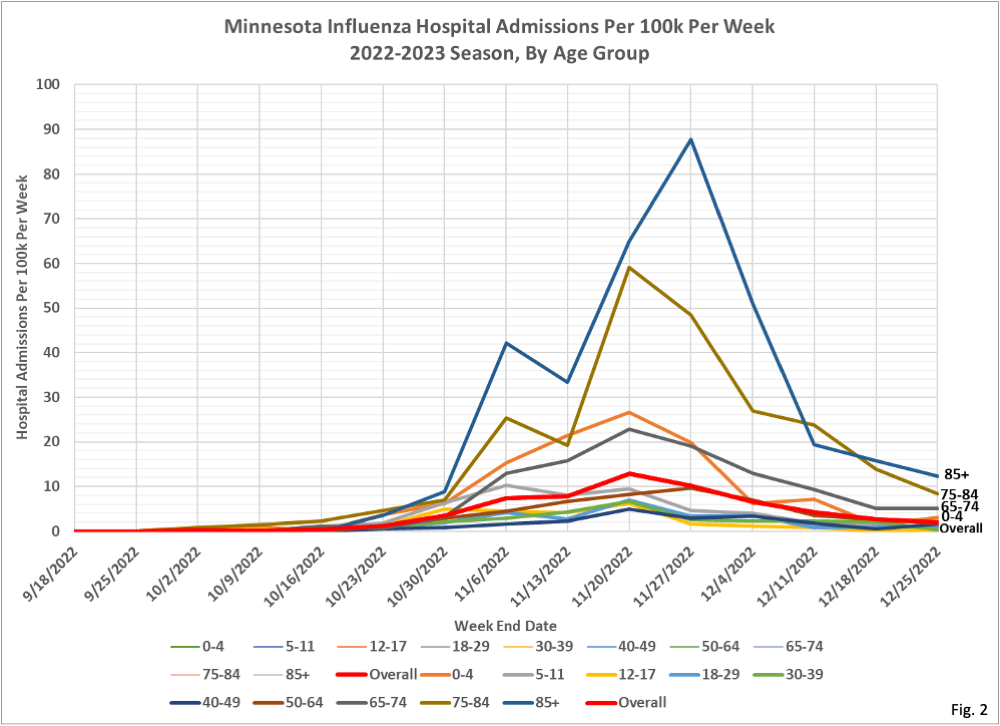
- Fig. 2, Minnesota Influenza Hospital Admissions, by Age Group, 2022-2023 Season: The number of hospitalizations have generally receded in all age groups. The 85+ and 75-84 age groups have had the highest rate of hospitalizations throughout the flu season, and remain the highest as the flu hospitalizations decrease.
