Dave Dixon has put together some charts to help assess the comparative seriousness of the current flu season, which does seem to be off to a hot and early start. Probably some rebound effect, but could in part be due to more testing as a result of the testing mania during the epidemic.
 Dave’s notes:
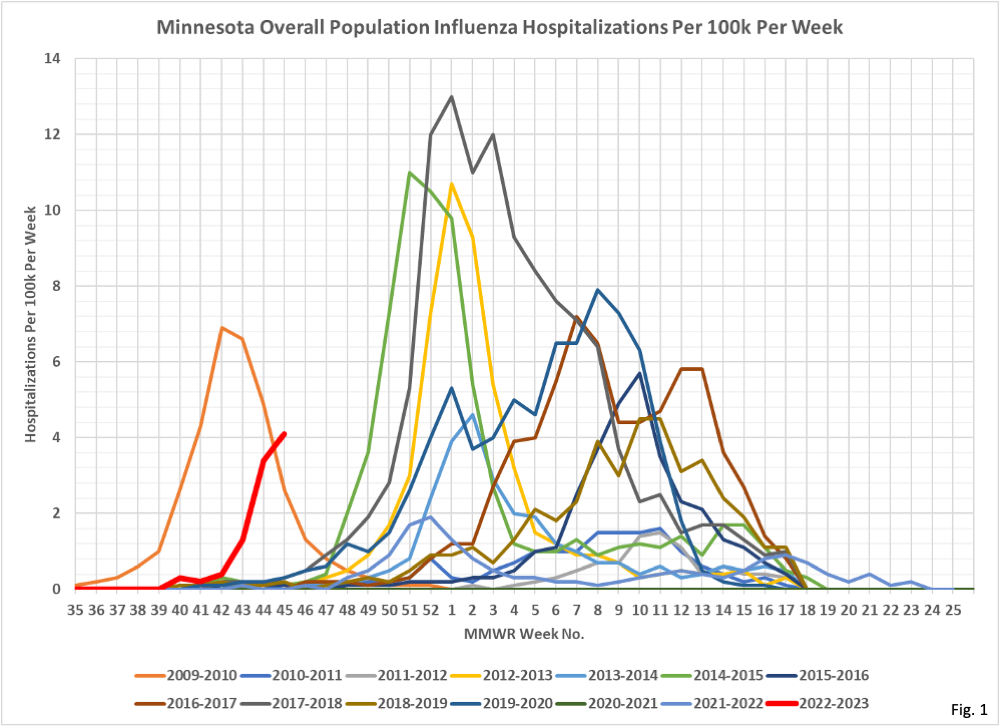
- With the seasonal influenza season officially underway in Minnesota we thought it would be a good idea to track the severity this year, and compare this year’s flu season to past years. Most unusual was the complete lack of reported influenza admissions for Minnesota in 2020-2021, which was commented on in press reports at the time. Note also that the vertical scale is different on all the charts.
- The CDC has a Flu Activity & Surveillance web site (link) that tracks several metrics for each state or region of the US. In today’s post we are looking at hospitalizations per 100k per week in Minnesota, available from the CDC FluSurv-NET web page (link). It is important to note that not all labs, clinics, and hospitals report influenza data to the Minnesota Department of Health (MDH) or to the CDC. Instead, there is a voluntary surveillance system in which a portion of medical facilities submit data and flu samples to MDH weekly (link). The CDC states on the FluSurv-NET web page that the hospitalization data for Minnesota represents 55% of the state population.
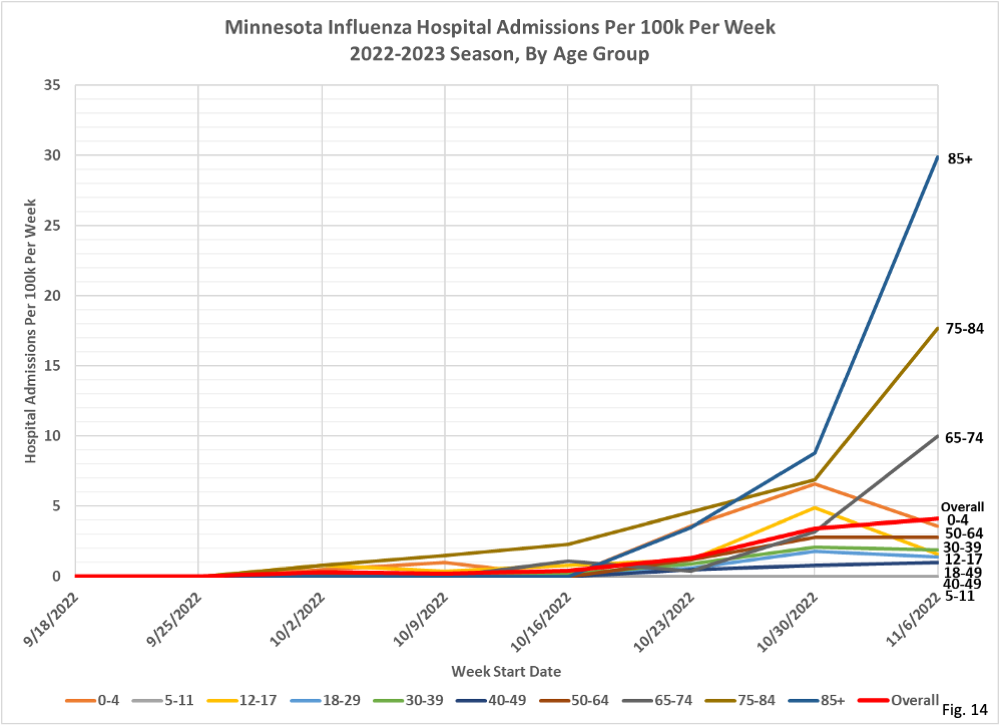
- Fig. 1, Minnesota Influenza Hospital Admissions Per 100k Per Week, each year starting with 2009-2010 season: Using the same FluSurv-NET web page we have downloaded the hospital admission data for all of the years available, starting with 2009-2010. The horizontal axis is labelled with the MMWR Week No., which is the CDC’s system for defining weeks in their Morbidity and Mortality Weekly Report. The MMWR Week No. 1 starts on the first or second Sunday in January, as defined by the CDC (link). The chart starts in Week 35, which is in the end of August. The current flu season is plotted in bright red, and we can see that the 2022-2023 flu season is indeed early, with only the 2009-2010 flu season starting earlier. The initial rise in hospitalization rates so far this year does not appear very different than many other flu seasons, but we will have to wait for more data to see how the magnitude of admissions compares to past years.
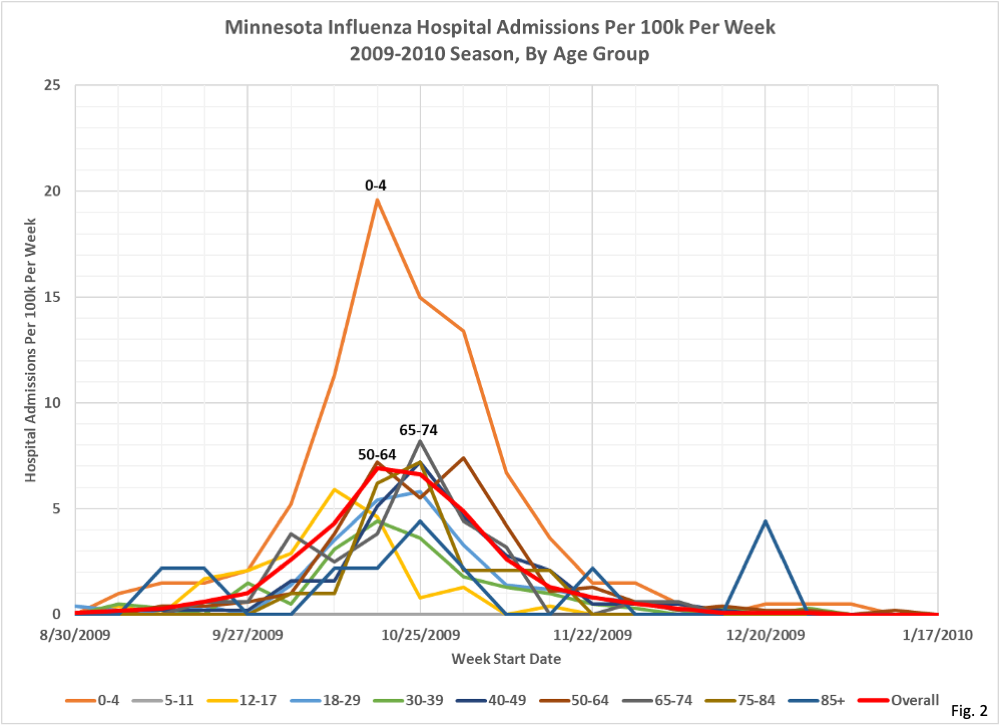
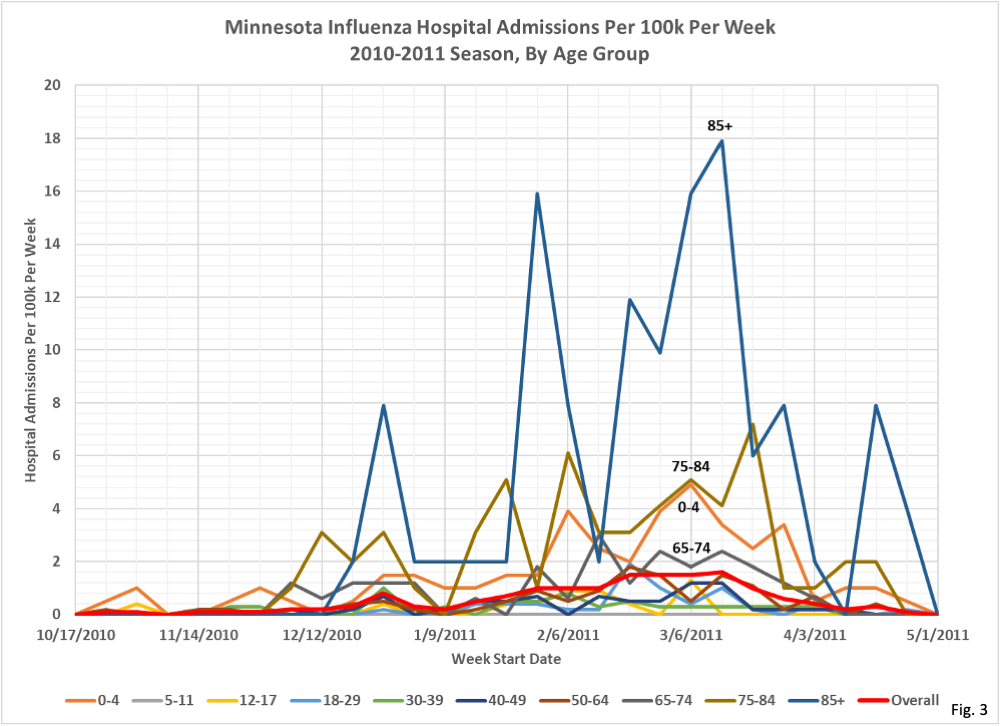
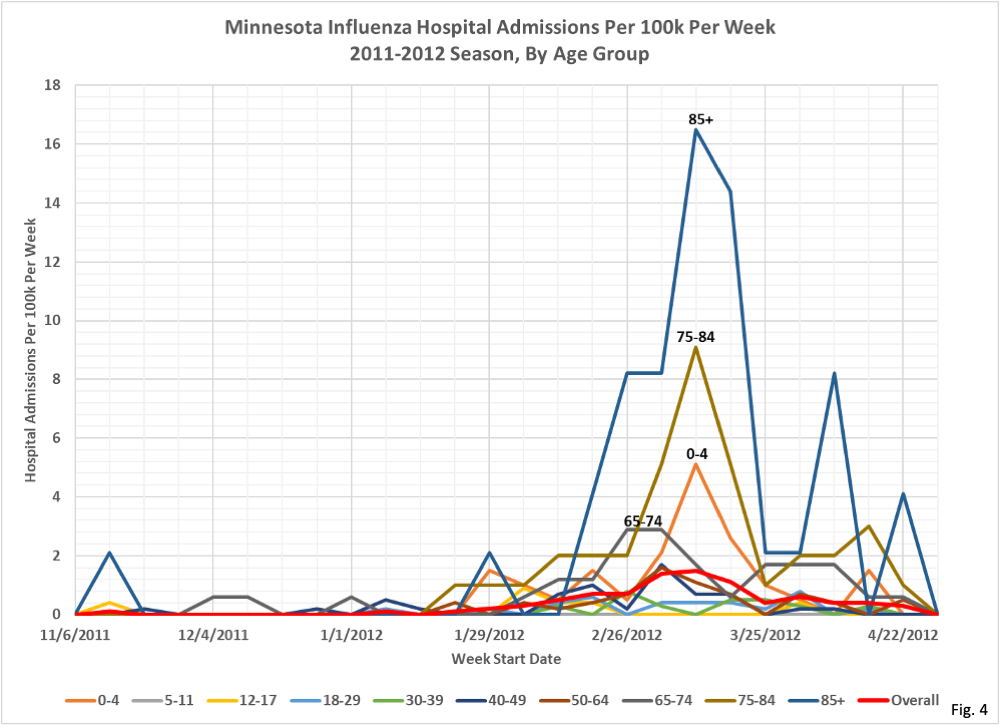
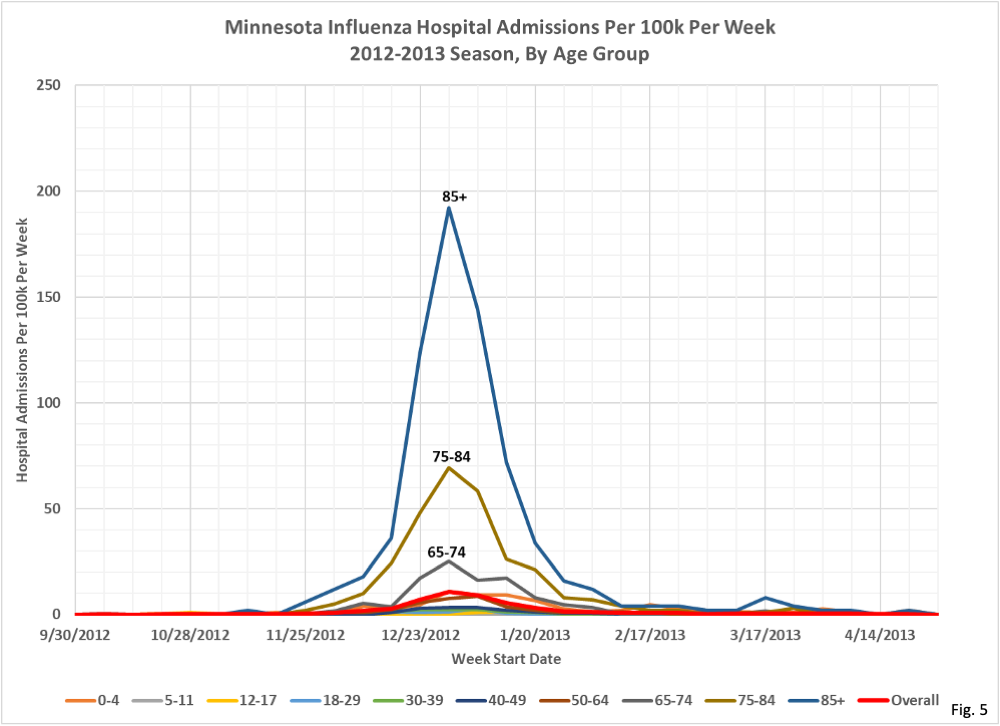
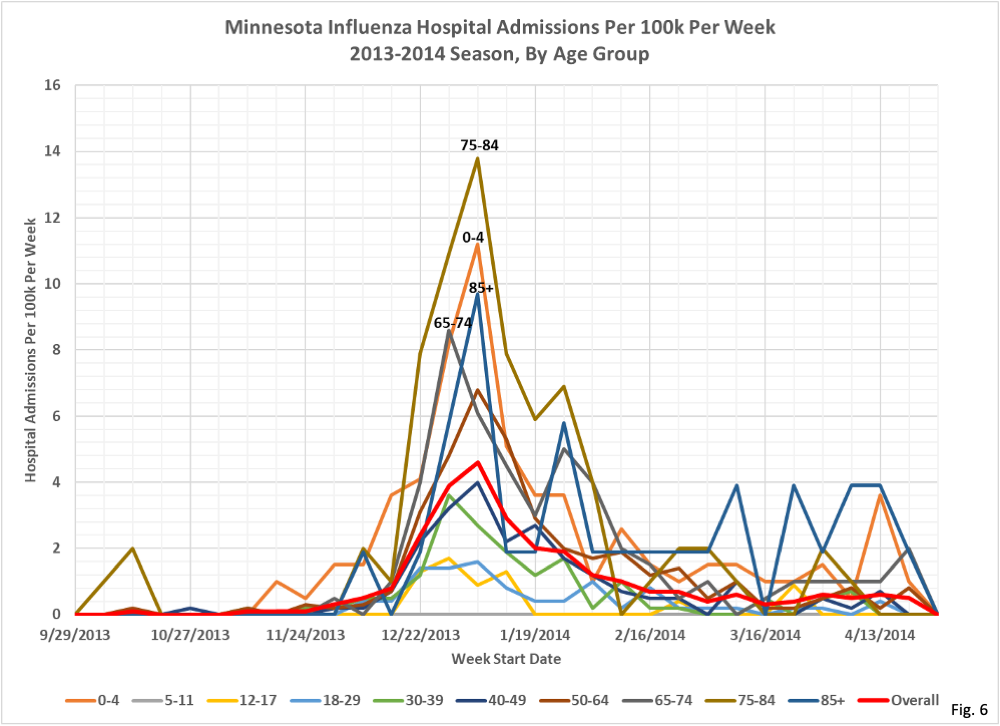
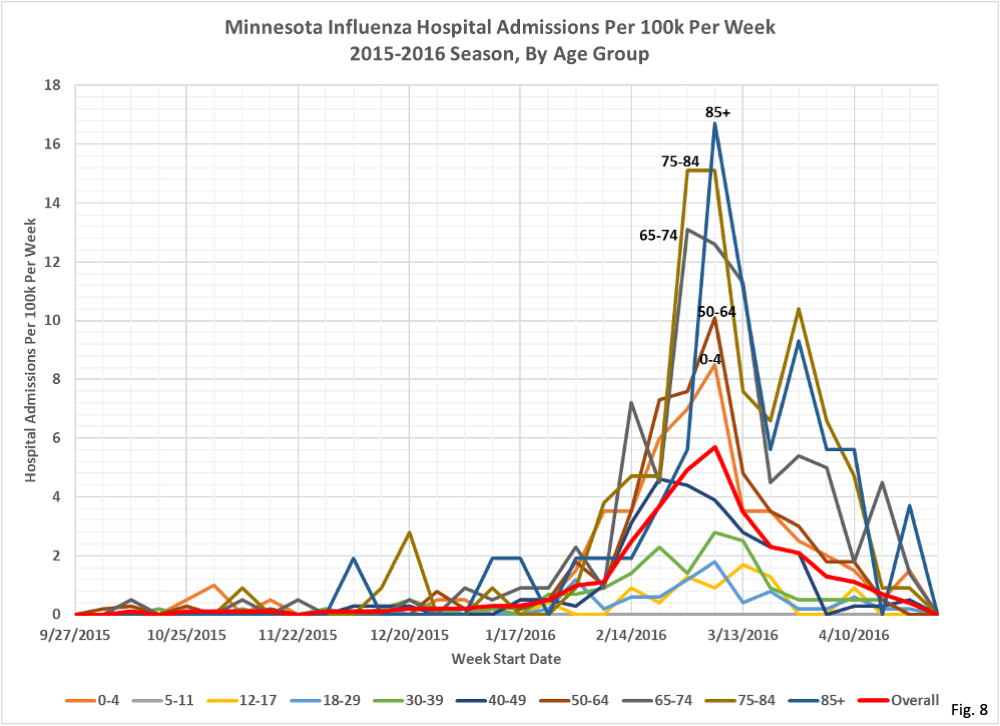
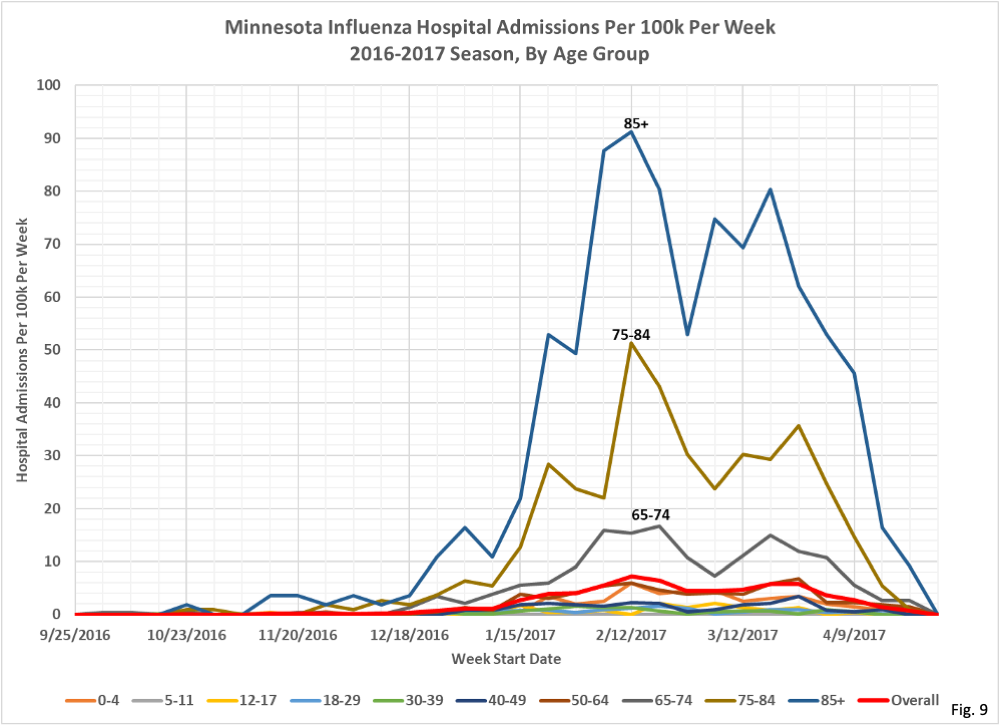
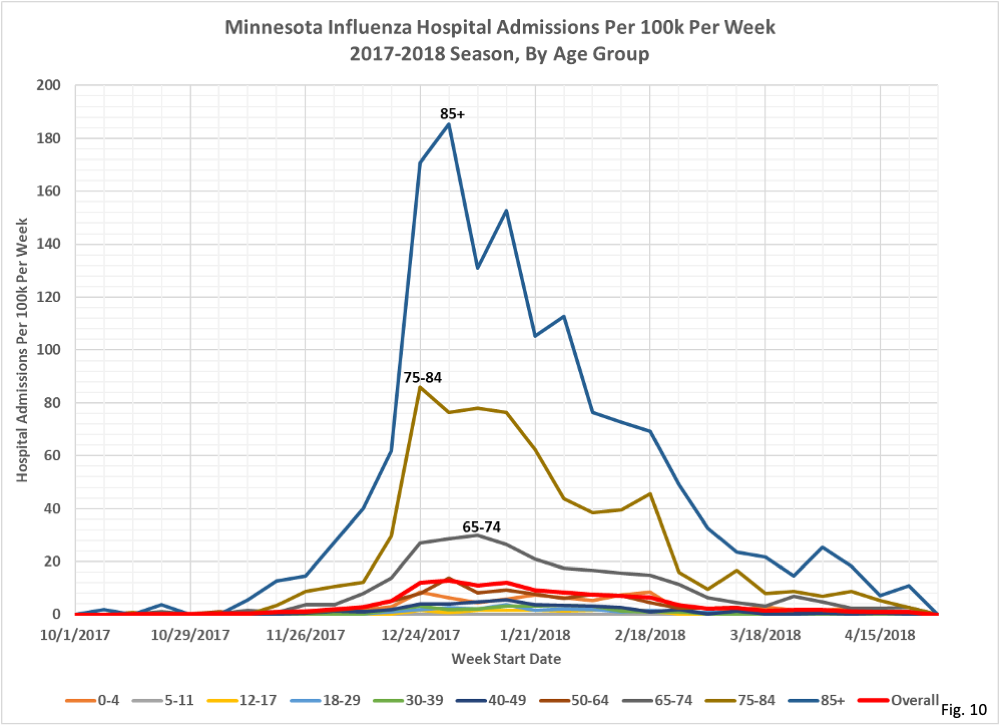
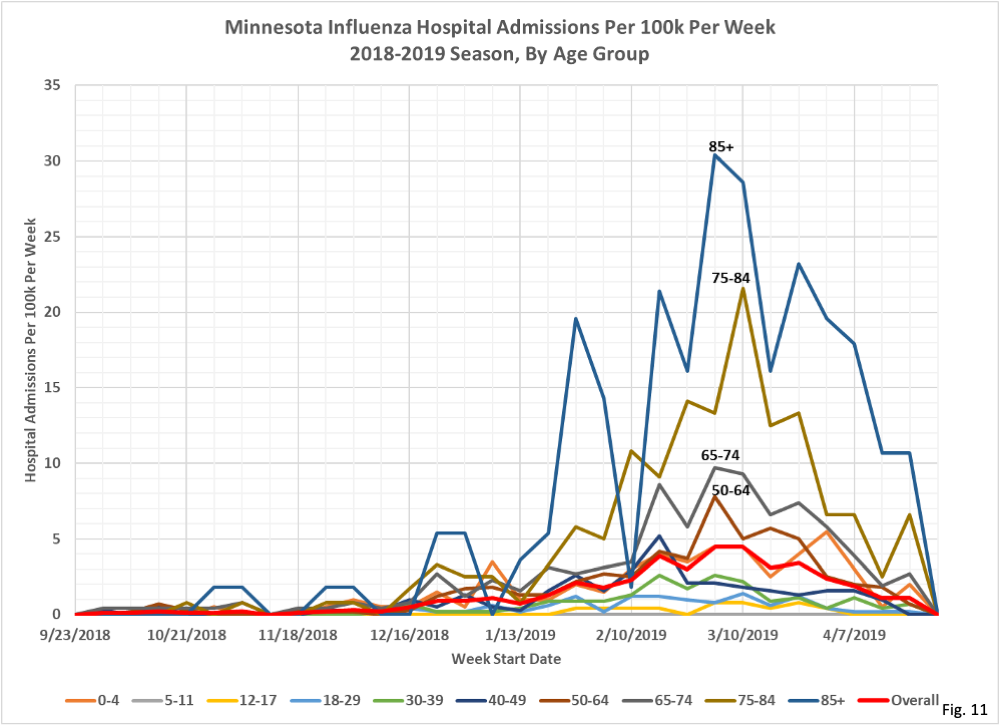
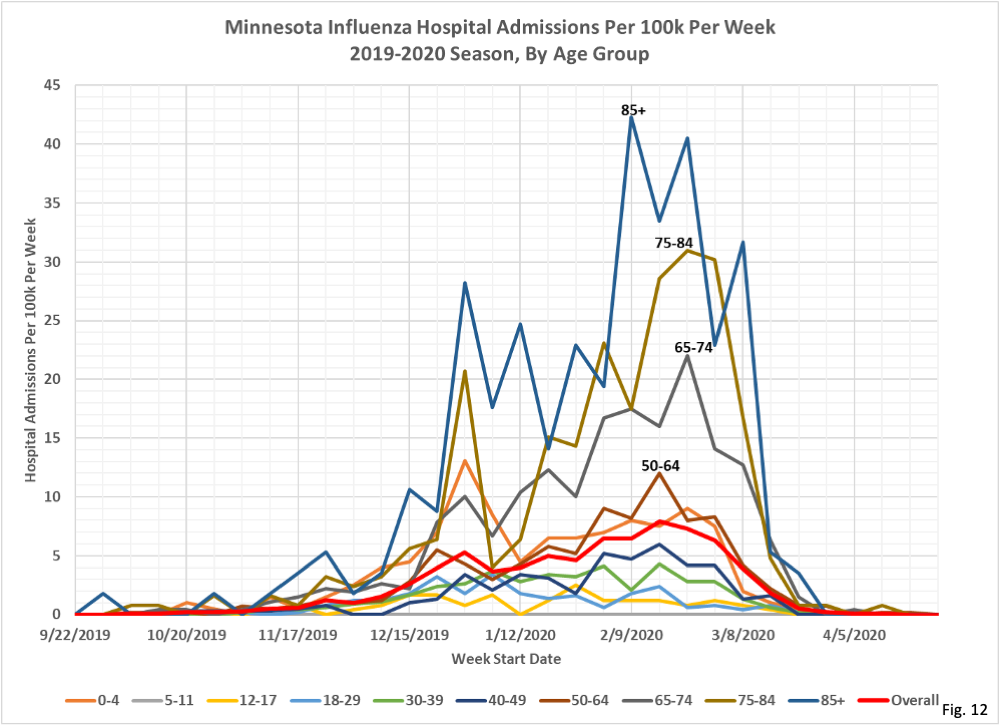
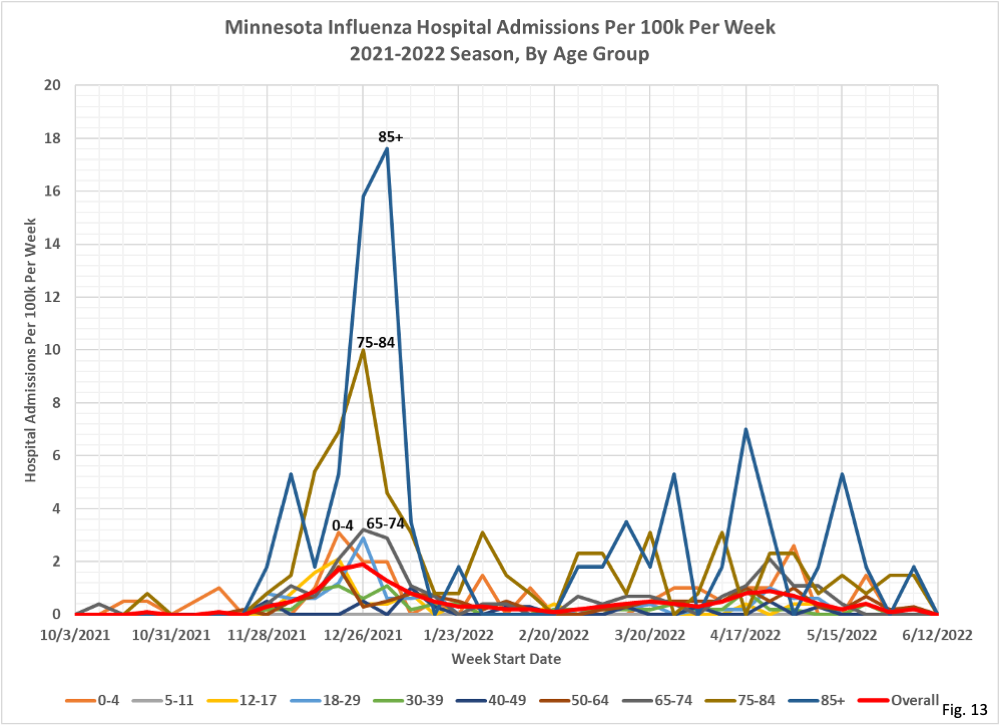
- Fig. 2 through Fig. 14, Minnesota Influenza Hospital Admissions Each Season, by Age Group: Starting with the 2009-2010 flu season we are plotting each season’s hospital admissions per 100k per week for each age group. The data is downloaded from the CDC FluSurv web site and plotted without modification. We can see that most years have a very strong age dependence for the rate of admissions, with the 85+ age group generally highest, followed by the 75-84 and 65-74 age groups. 2009-2010 stands out with the 0-4 age group having the highest rate of admissions, as well as having the earliest start to the flu season. In several other years the 0-4 age group also ranks high, such as 2010-2011 (third highest), 2011-2012 (third highest), 2013-2014 (second highest), and 2015-2016 (fifth highest).
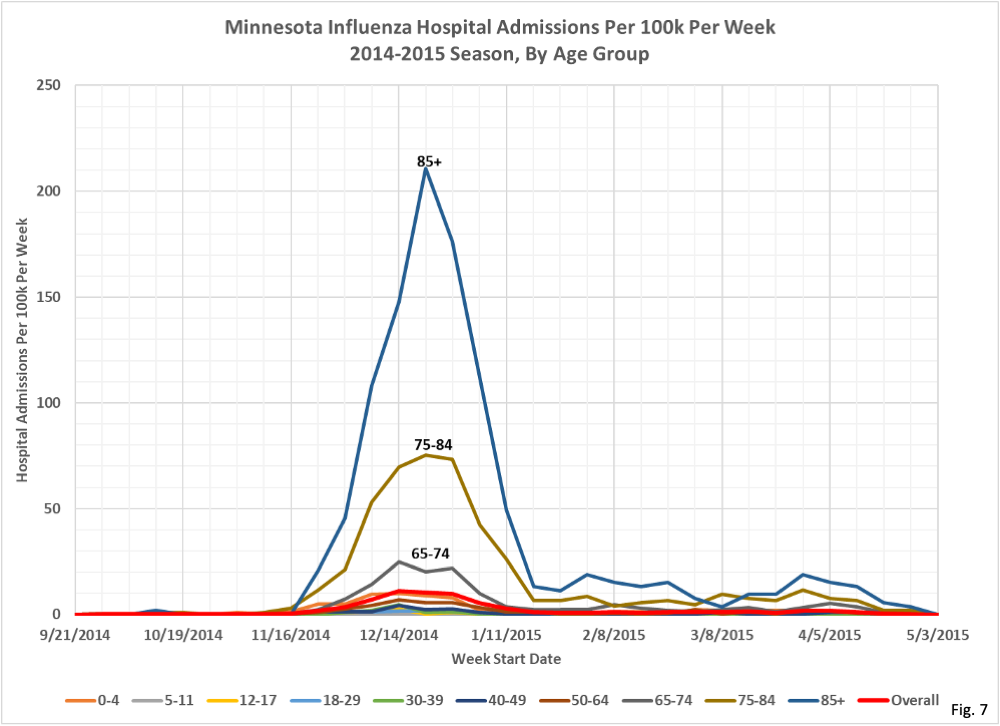
- The years with the highest overall population average admissions were 2017-2018 at 13.0 admissions per 100k at the peak, 2014-2015 at 11 admissions per 100k, and 2012-2013 at 10.7 admissions per 100k. The Covid era years peaked at 7.9 admissions per 100k in 2019-2020 and 1.9 admissions per 100k in 2021-2022. Note especially that we have not plotted influenza admissions for the 2020-2021 flu season. The CDC does not report any flu hospitalizations at all for 2020-2021.
- The most severe years for the 85+ age group were 2014-2015 (211 admissions per 100k), 2012-2013 (192 admissions per 100k), and 2017-2018 (185 admissions per 100k).
