Another full year of the epidemic in charts and I guarantee you we will not do one at this time next year. As usual, hospitalization and death data is suspect due to high over-attribution to CV-19.
 Dave’s notes:
- This post is an update to the yearly comparison charts last published here on 12/19/2022: https://healthy-skeptic.com/
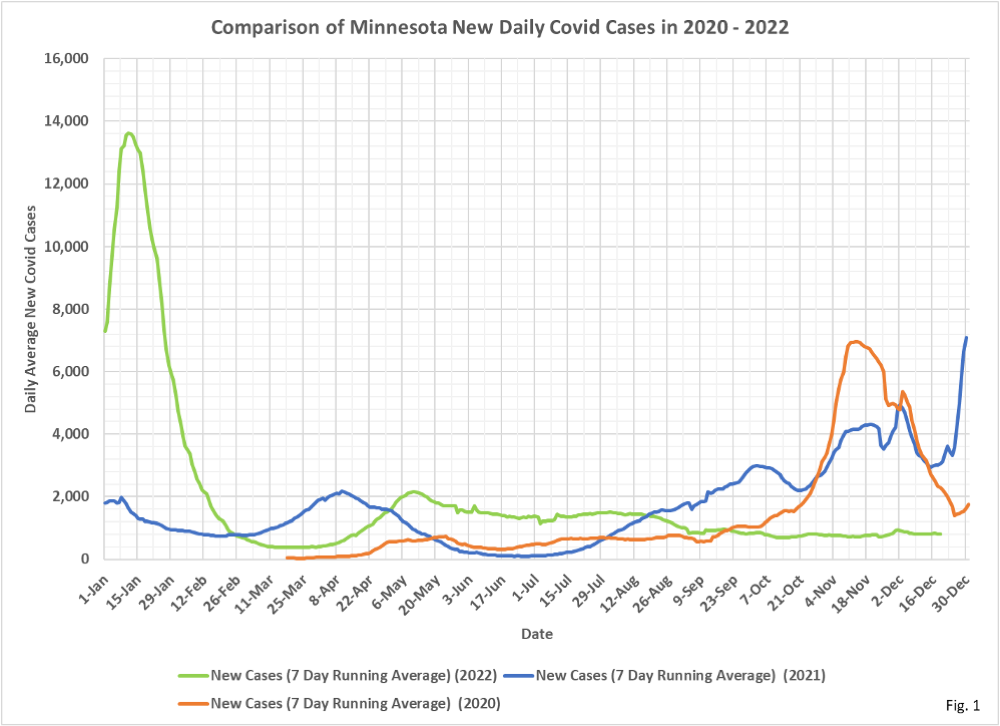
2022/12/19/year-over-year- comparison/. In today’s update we have added data published by the Minnesota Department of Health (MDH) on 12/29/2022. As always, we do not include the last 7 days of case and hospitalization data, or the last 14 days of death data, in order to minimize publishing incomplete data. In general, while cases are declining, hospitalizations and deaths are gradually increasing since May. In more recent months, while Covid cases and deaths still appear to be on a level trend, ICU and Non-ICU hospital admissions and beds in use are gradually increasing. - Fig. 1: New Daily Covid Cases: New daily cases appear to have levelled off since mid-October after having gradually declined since mid-May.
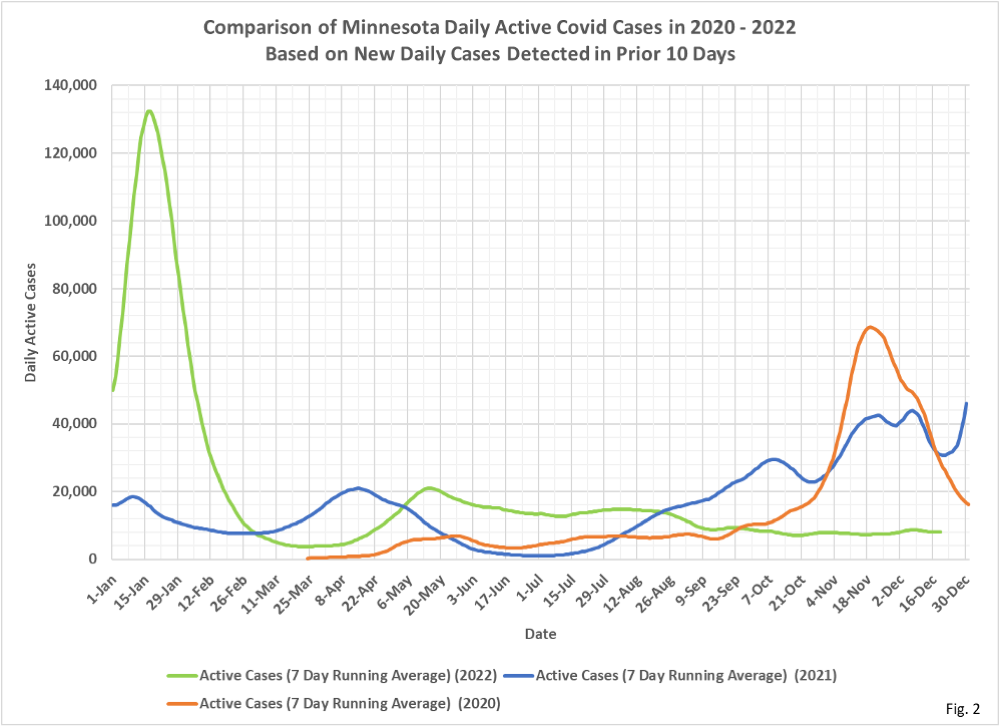
- Fig. 2: Estimated Active Covid Cases: We are simply showing the number of people who test positive in a 10 day period as an estimate for how many people may be actively infected at any one time, since MDH stopped reporting the number of people No Longer Needing Isolation.
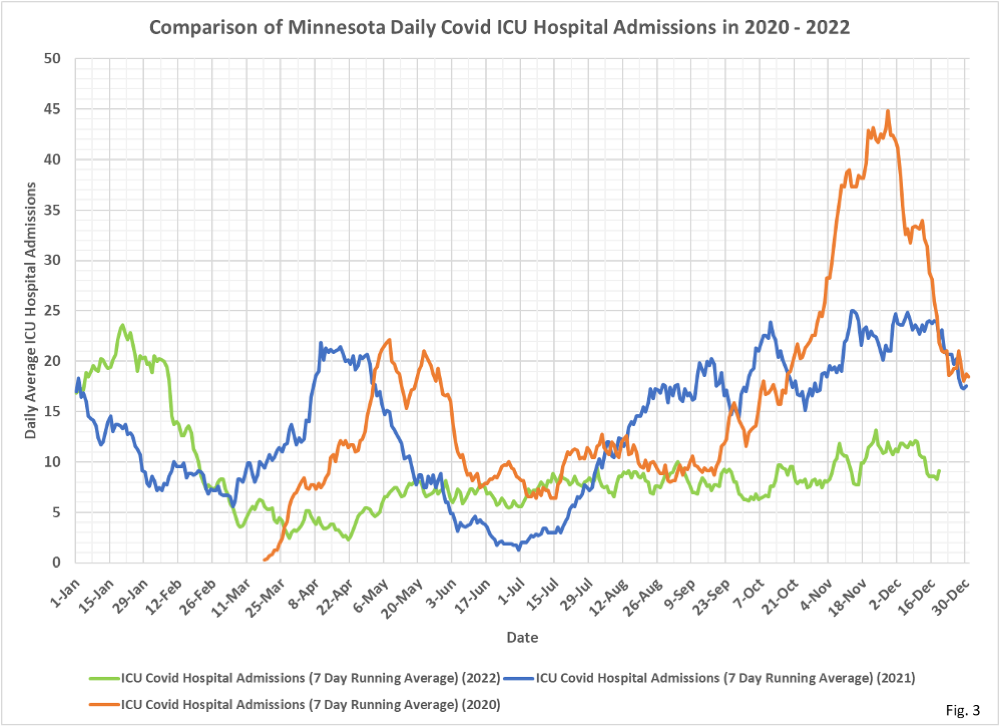
- Fig. 3: Covid ICU Admissions: ICU admissions have dropped in the past week or so. Since the data is very choppy we would not be surprised to see ICU admissions rebound, since cases remain constant.
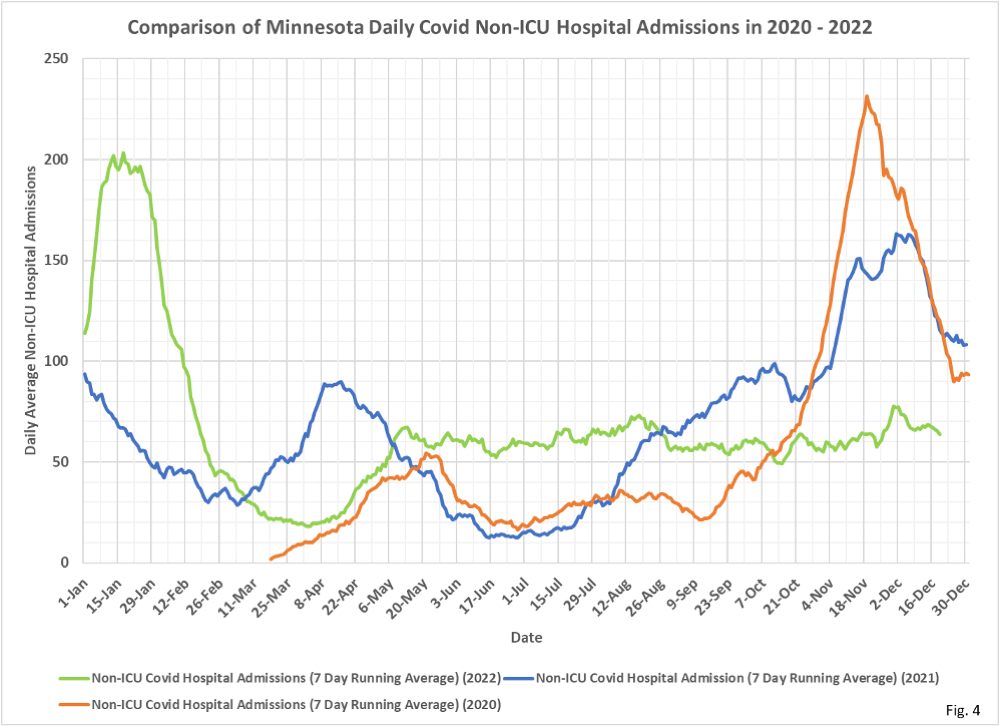
- Fig. 4: Covid Non-ICU Admissions: Non-ICU admissions have dropped since the recent peak on Dec. 1.
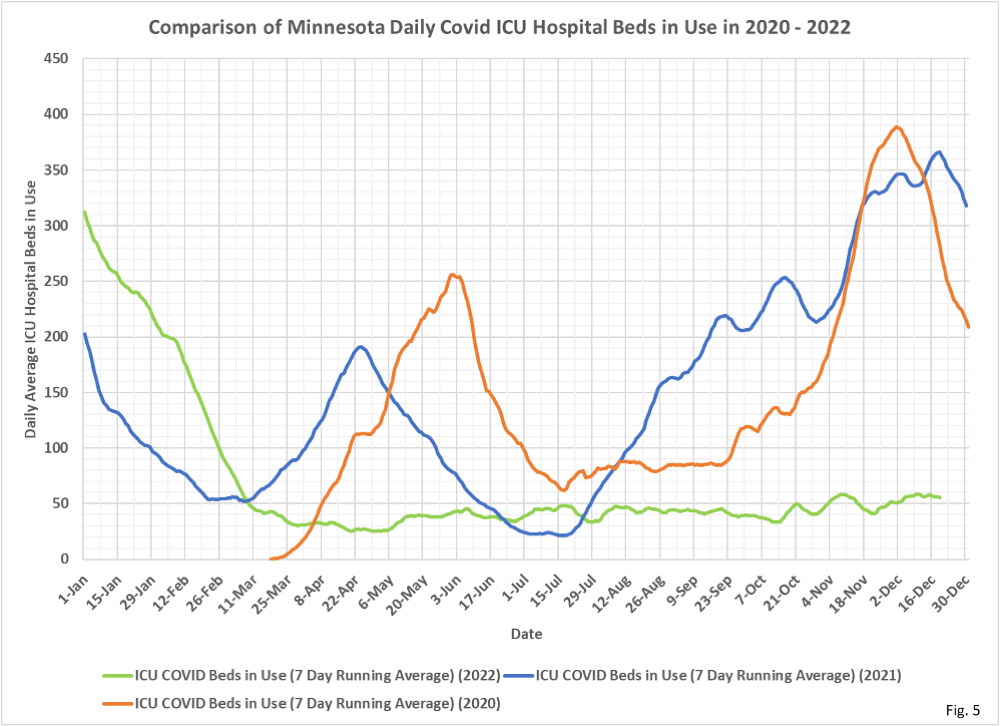
- Fig. 5: Covid ICU Beds in Use: Covid ICU beds in use remain at relatively high levels.
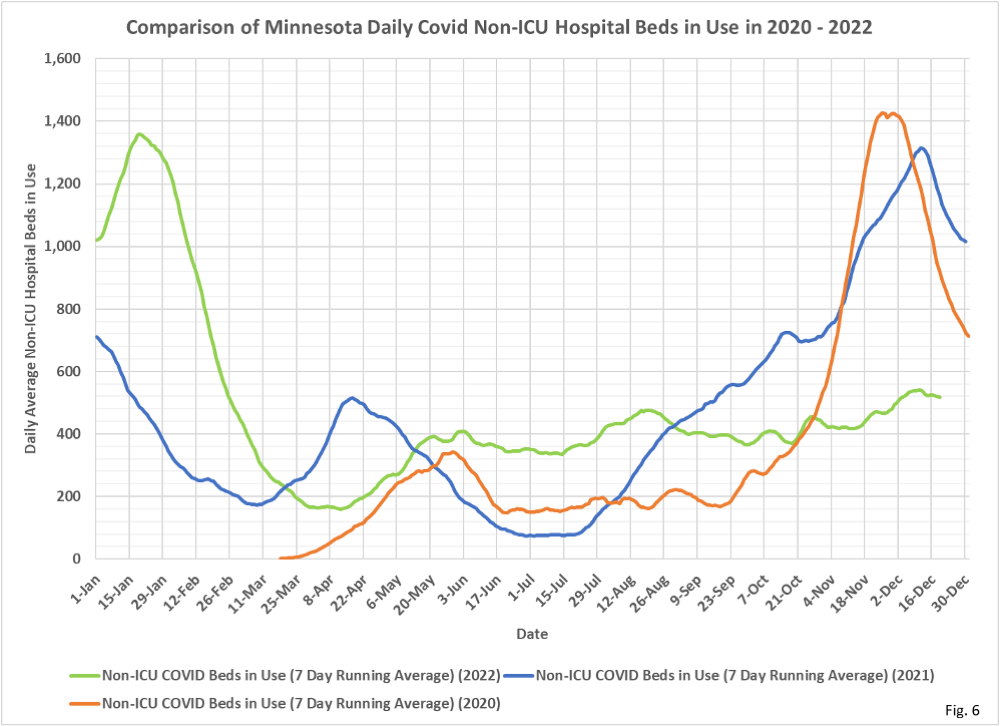
- Fig. 6: Covid Non-ICU Beds in Use: Non-ICU Covid hospital beds in use also remain at relatively high levels.
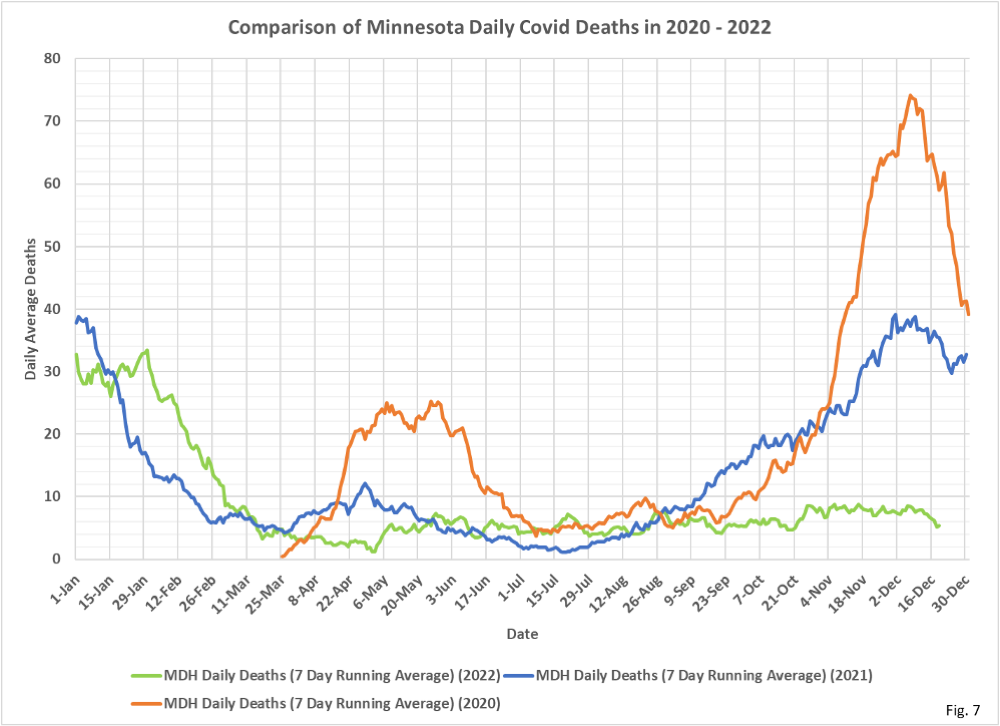
- Fig. 7: Covid Deaths: Deaths attributed to Covid are relatively constant, averaging between 4 and 9 deaths per day since May. It is possible that the decline in the last week of data plotted will be revised higher in future weeks.
- All data is taken from data files available on various pages of the Minnesota Department of Health (MDH) Situation Update for COVID-19 web page https://www.health.state.mn.
us/diseases/coronavirus/stats/ index.html. - All data is shown as 7 day running averages.

Happy New Year but just tell me this: If an actual deadly serious virus ever gets let loose in the world we’re probably all doomed, am I right?
even the Black Plague didn’t wipe humanity out, but yes it is possible there could be far worse viruses, especially if they attacked younger people. CV-19 really was almost exclusively a serious problem for the elderly and the very ill. Imagine ebola being respiratory, that would be a nightmare