We keep publishing this every week because certain media outlets and certain public health officials and certain politicians keep trying to convince people we are in the midst or at the start or under threat of a huge CV-19 wave. Could be but no sign of it in Minnesota. Home testing may screw up case reporting. Incidental hospitalizations certainly make hospitalization claims inaccurate. But looking at everything, including my own experience and what I hear from readers, there is no sign of any big uptick.
 Dave’s notes:
- This post is an update to the yearly comparison charts last published here on 12/11/2022: https://healthy-skeptic.com/
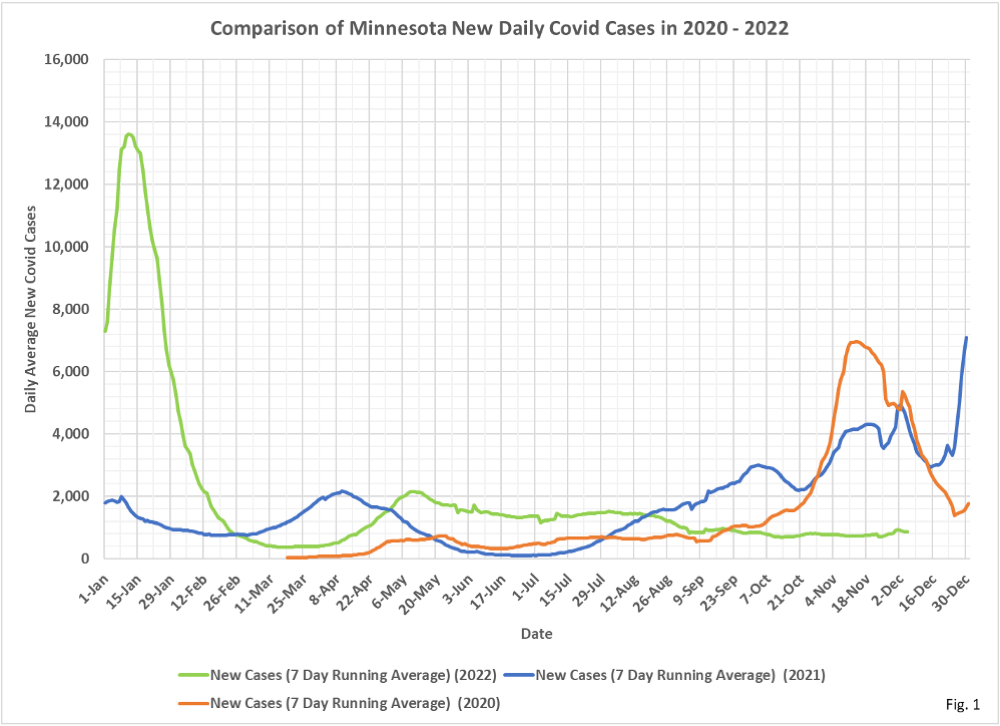
2022/12/11/year-over-year- charts-december-8/. In today’s update we have added data published by the Minnesota Department of Health (MDH) on 12/15/2022. As always, we do not include the last 7 days of case and hospitalization data, or the last 14 days of death data, in order to avoid publishing incomplete data. In general, while cases are declining, hospitalizations are gradually increasing since May. While Covid cases and deaths still appear to be on a level trend, ICU and Non-ICU hospital admissions and beds in use are gradually increasing. - Fig. 1: New Daily Covid Cases: New daily cases appear to have levelled off since mid-October after having gradually declined since mid-May.
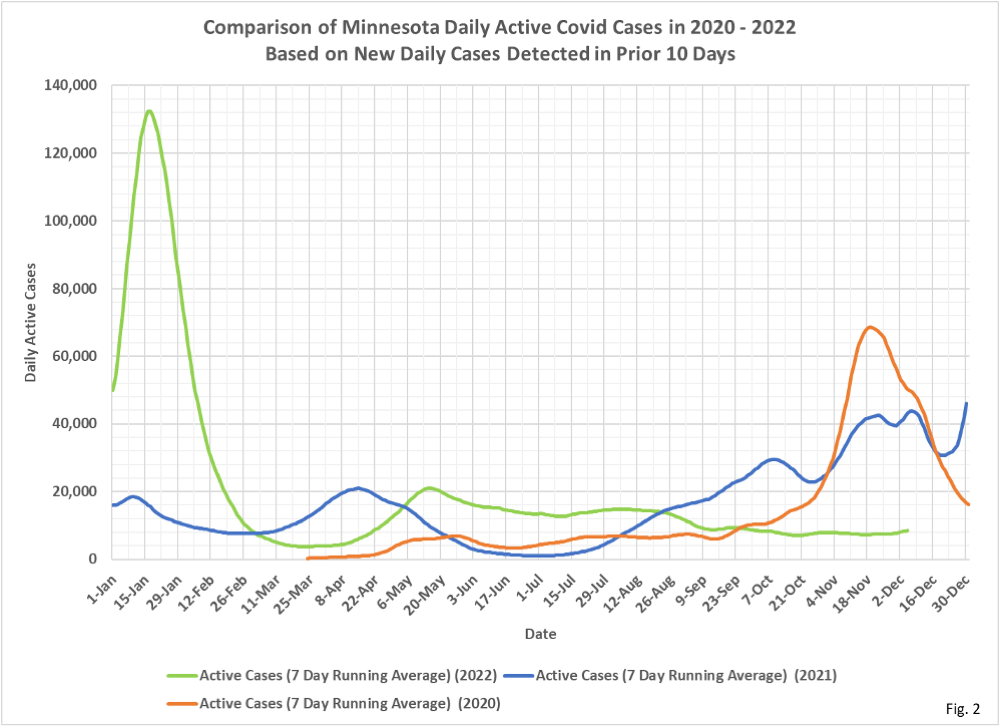
- Fig. 2: Estimated Active Covid Cases: We are simply showing the number of people who test positive in a 10 day period as an estimate for how many people may be actively infected at any one time, since MDH stopped reporting the number of people No Longer Needing Isolation.
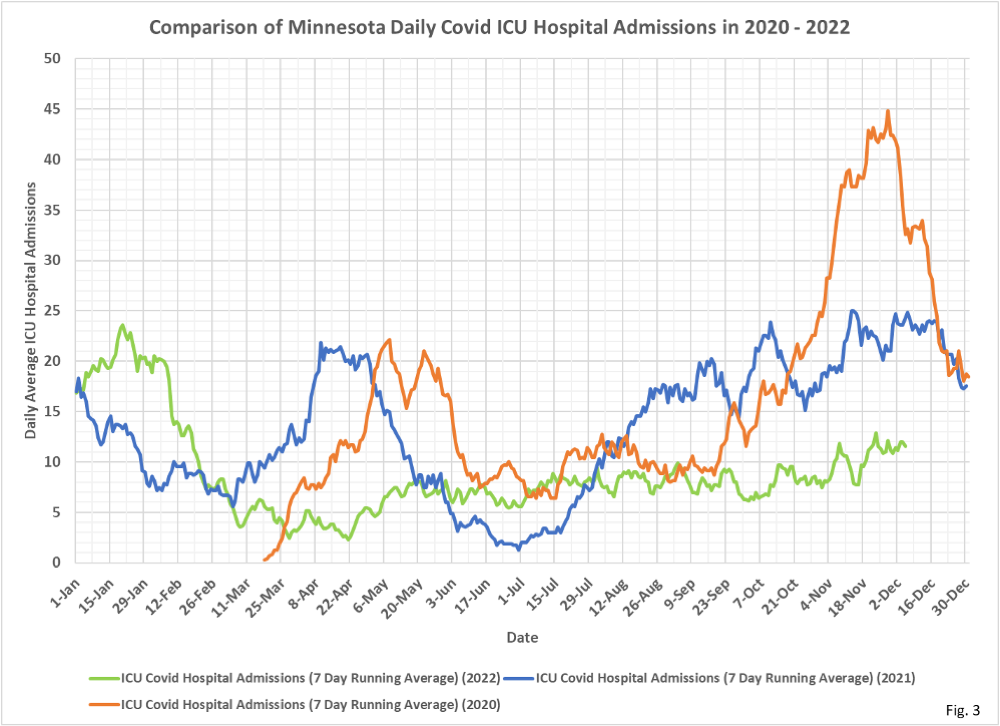
- Fig. 3: Covid ICU Admissions: ICU admissions are continuing to rise gradually, although the 7-day average is very choppy from day to day. Since Covid cases are not rising, either the current strains are more severe or a greater number of people are home testing rather than getting an official test. It seems more likely that the increased use of home tests is causing the trend in cases to appear flat when in reality cases may be increasing.
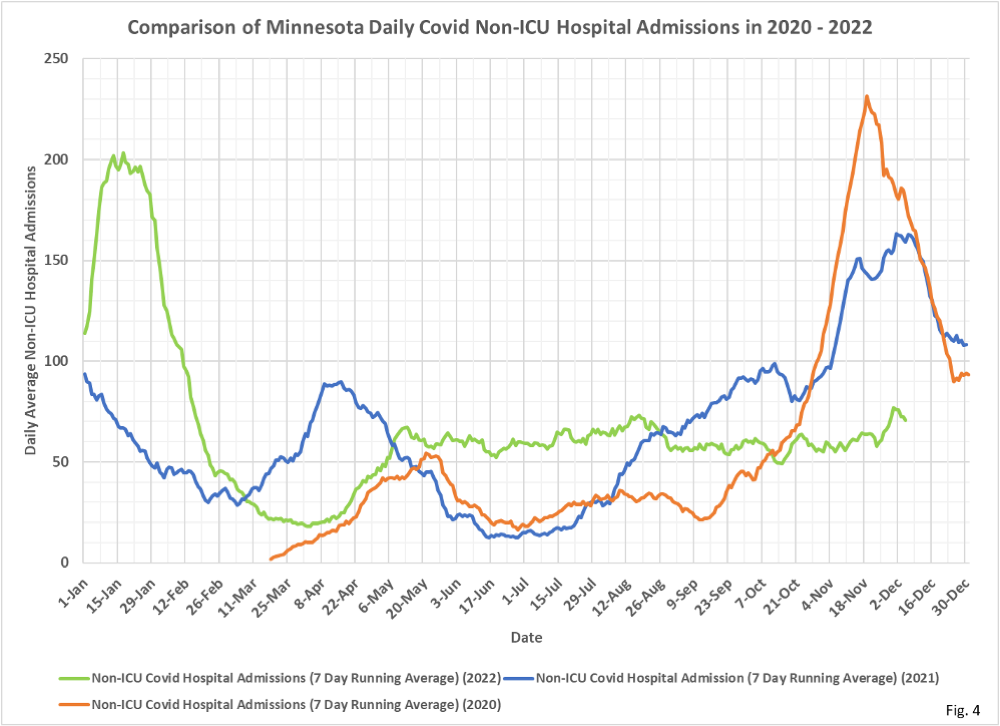
- Fig. 4: Covid Non-ICU Admissions: Average daily Non-ICU admissions reached a new peak of 77 admissions on 12/1/2022. This is the highest daily average non-ICU admissions since 2/14/2022.
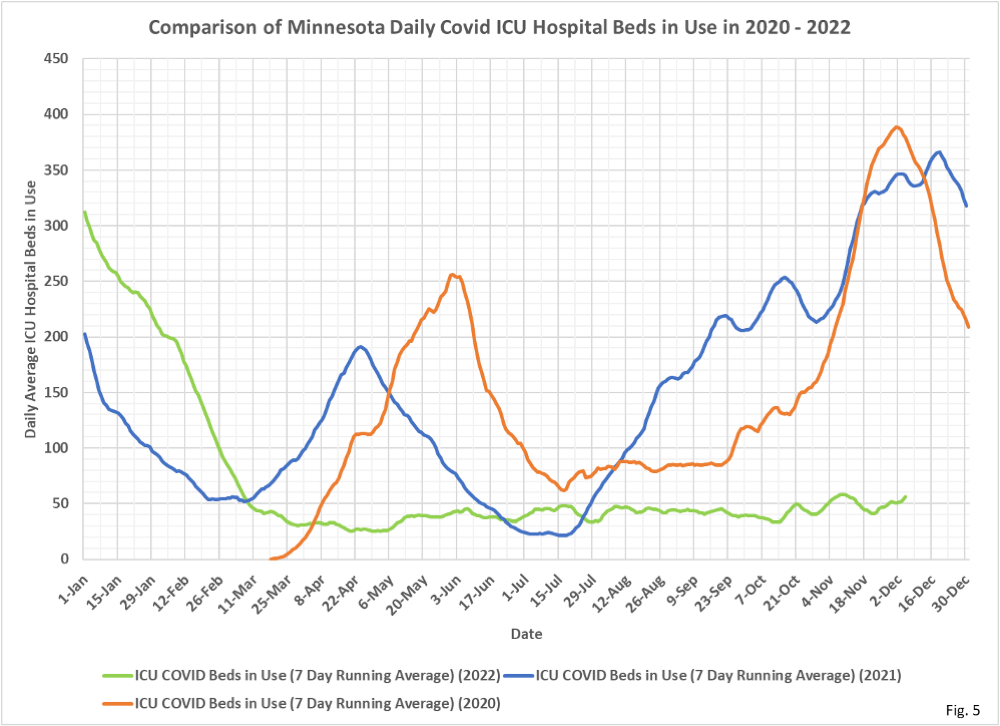
- Fig. 5: Covid ICU Beds in Use: Covid ICU beds in use are also gradually increasing, although perhaps not as much as daily average ICU admissions. If true this implies that average length of stay is somewhat lower in recent weeks.
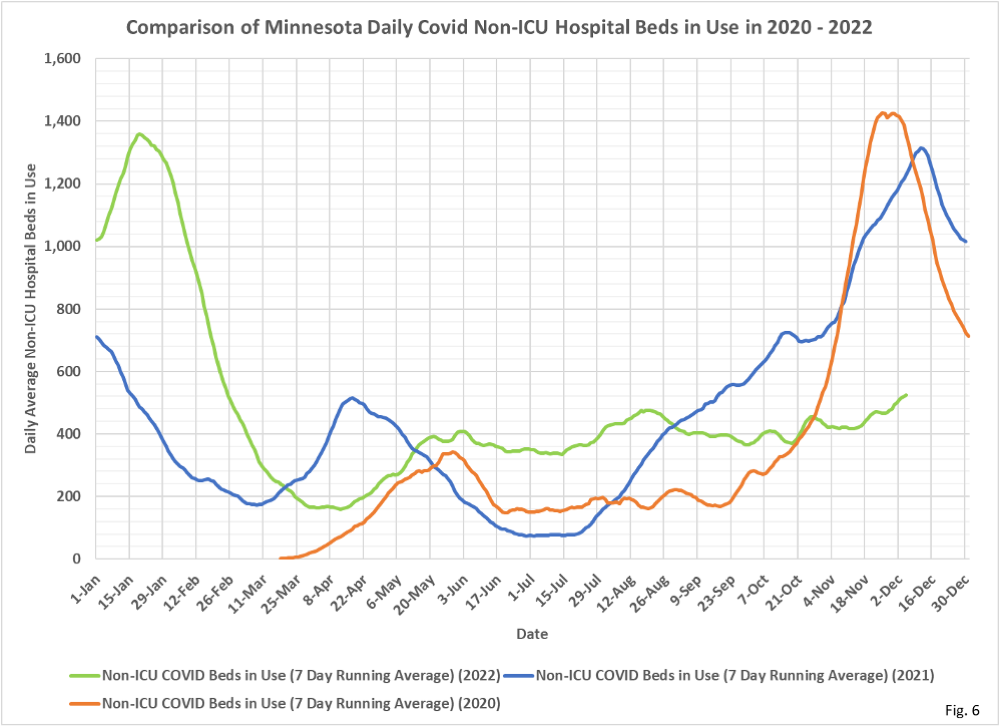
- Fig. 6: Covid Non-ICU Beds in Use: Non-ICU Covid hospital beds have risen sharply in the last 2 weeks. Just like Non-ICU admissions, Covid Non-ICU beds in use are at levels not seek since last February.
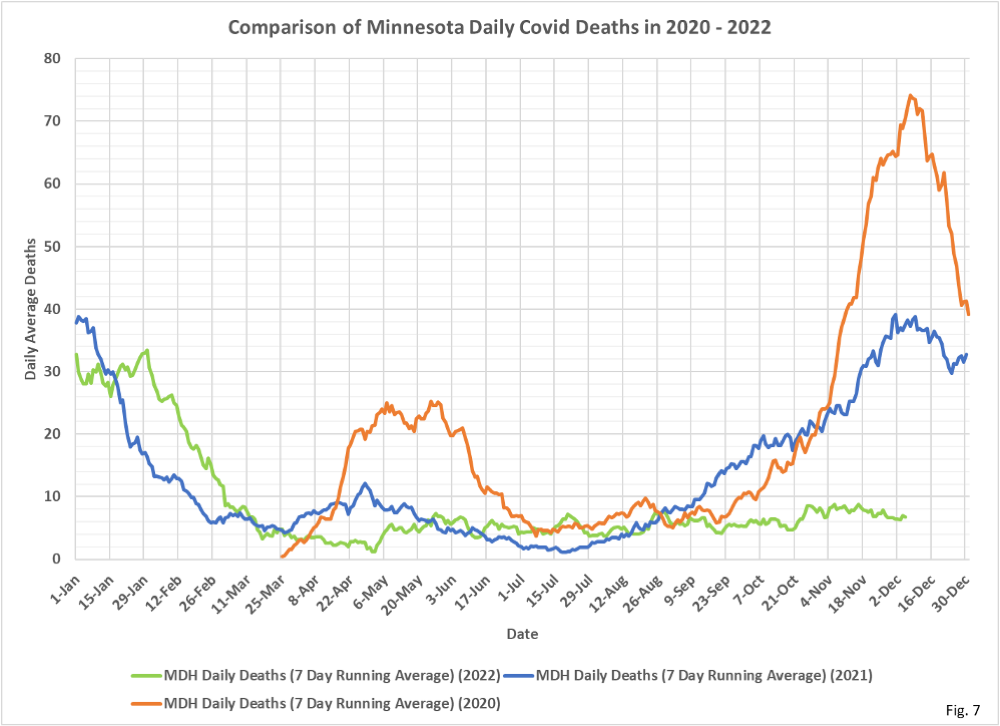
- Fig. 7: Covid Deaths: Deaths attributed to Covid are relatively constant, averaging between 4 and 9 deaths per day since May.
- All data is taken from data files available on various pages of the Minnesota Department of Health (MDH) Situation Update for COVID-19 web page https://www.health.state.mn.
us/diseases/coronavirus/stats/ index.html. - All data is shown as 7 day running averages.

I suspect that the fear mongering is in part driven to scare people out of travelling. When looking at the latest economic data, travel was one of the areas where spending has not slowed. We all know that govt uses fear to elicit certain behaviors. Since they can’t seem to get control of inflation and are fearful of triggering job losses, they will use other means to reduce spending.