We have some media and public health officials claiming we are seeing a big CV-19 surge in the country. It may be happening elsewhere but not in Minnesota. I think the hospital data is due to the fact that testing is required and I would bet that the vast majority of those hospitalizations are not for CV-19 treatment. Go about your lives as normal.
 Dave’s notes:
- This post is an update to the yearly comparison charts last published here on 11/30/2022: https://healthy-skeptic.com/
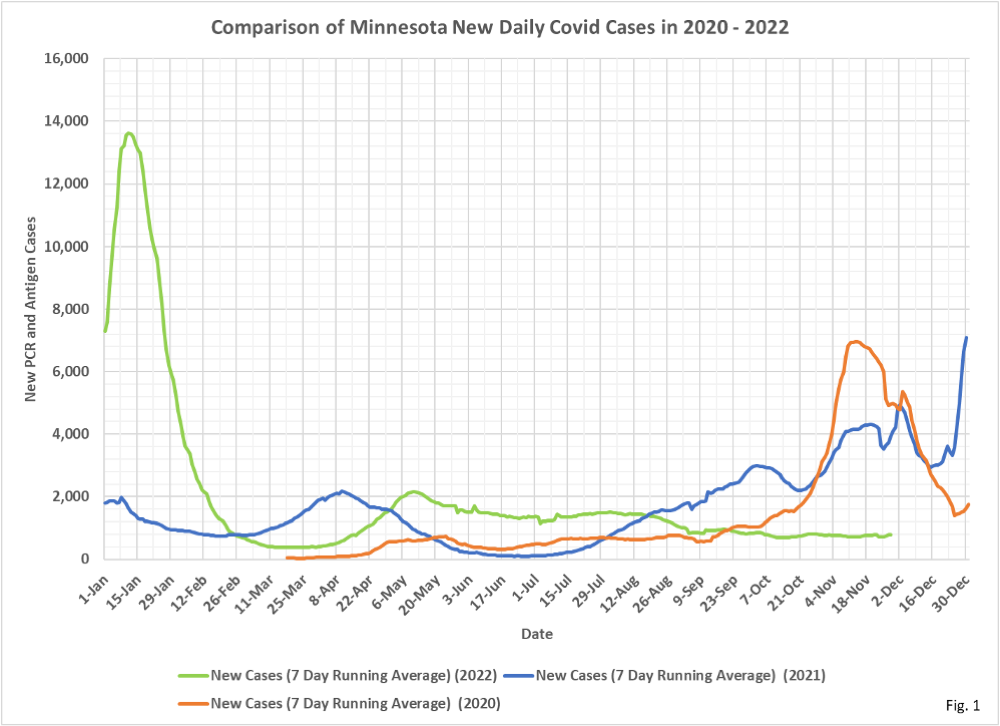
2022/11/30/year-over-year- charts-november-28/. In today’s update we have added data published by the Minnesota Department of Health (MDH) on 12/08/2022. As always, we do not include the last 7 days of case and hospitalization data, or the last 14 days of death data, in order to avoid publishing incomplete data. In general, while cases are declining hospitalizations and deaths are gradually increasing since May. There is no sign of a winter surge of cases, hospitalizations, or deaths, but the gradual increase in hospitalizations appears fairly clear. - Fig. 1: New Daily Covid Cases: New daily cases continue the same gradual declining trend that has been in place since May. No sign of an uptick in cases despite media reports warning of a triple-demic. Of course, home testing may be reducing the cases, compared to the past 2 years when home testing was less prevalent.
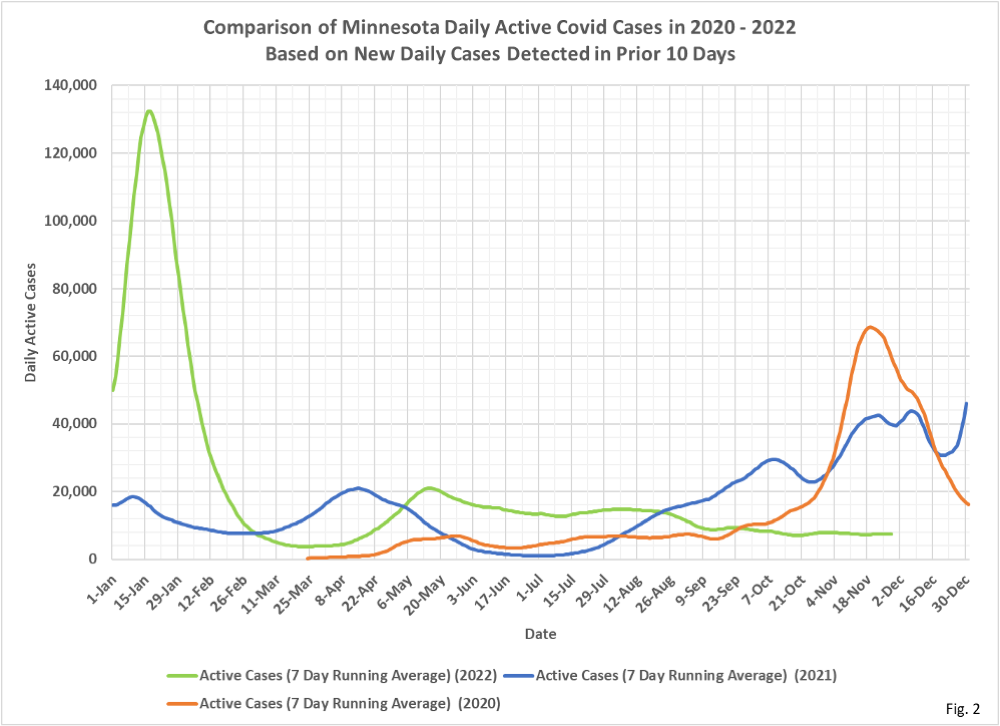
- Fig. 2: Estimated Active Covid Cases: We are simply showing the number of people who test positive in a 10 day period as an estimate for how many people may be actively infected at any one time, since MDH stopped reporting the number of people No Longer Needing Isolation.
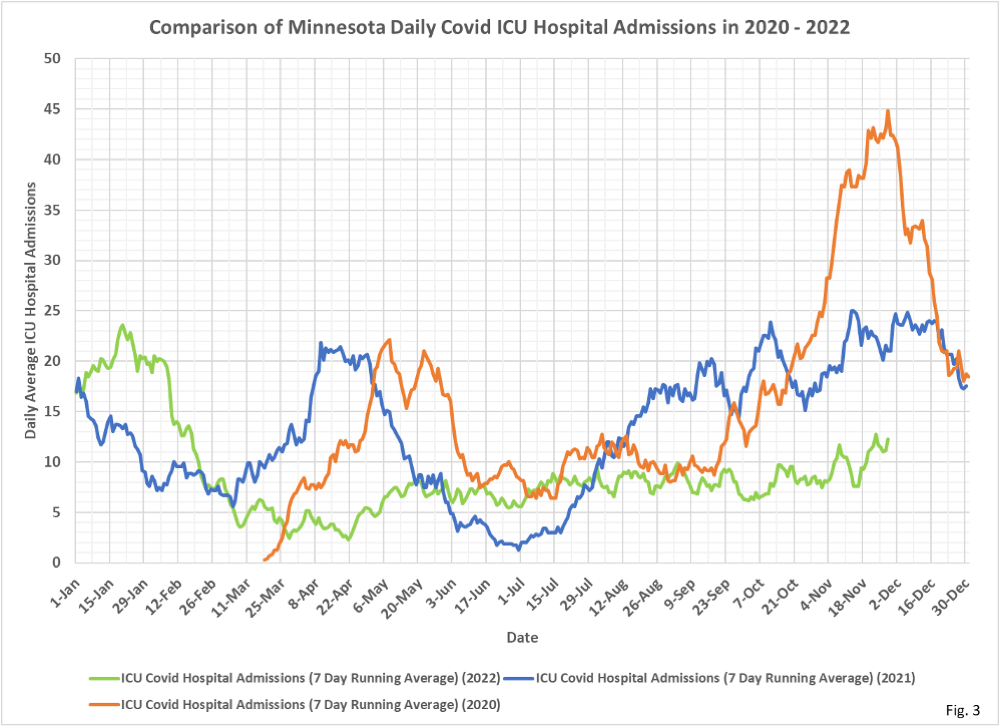
- Fig. 3: Covid ICU Admissions: In contrast to the gradual decline in new Covid cases in Fig. 1, Covid ICU admissions are gradually trending higher. The recent high of 12.9 average daily admissions on 11/24/2022 was the highest since we had 12.9 average daily admissions on 2/17/2022. We do not know exactly how many of these admissions were for non-Covid reasons and only incidentally tested positive, although media reports suggest that as many as 50%-75% of all Covid admissions are incidental.
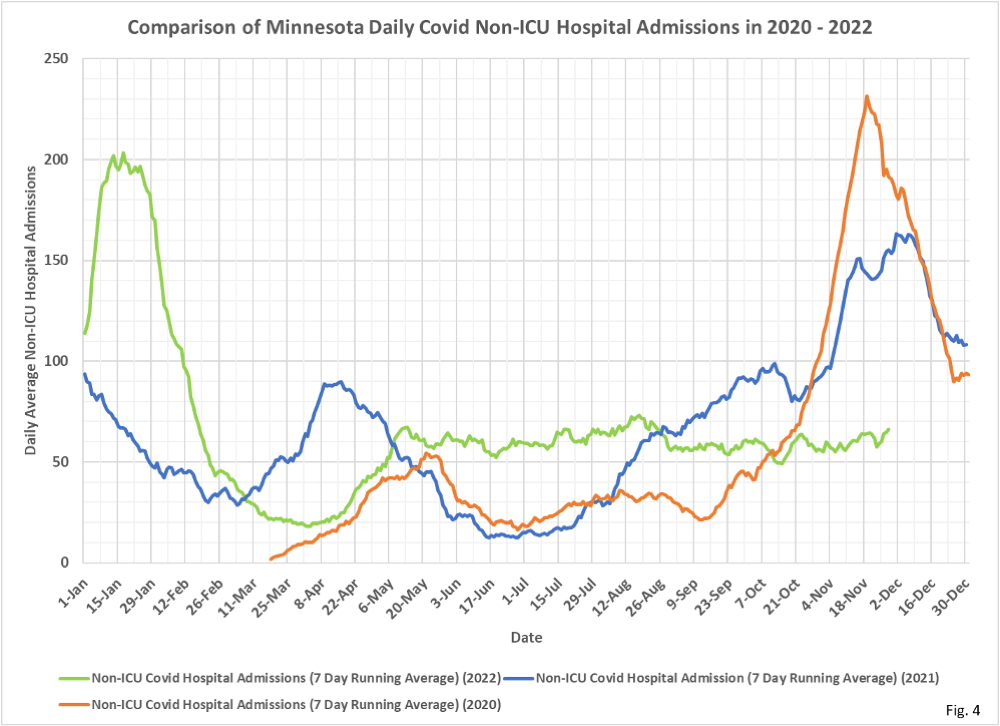
- Fig. 4: Covid Non-ICU Admissions: Average daily Covid Non-ICU admissions remain within the band of 50 to 70 admissions per day that we have seen since May, despite the gradually increasing IUC admissions, and also despite the gradually declining new cases.
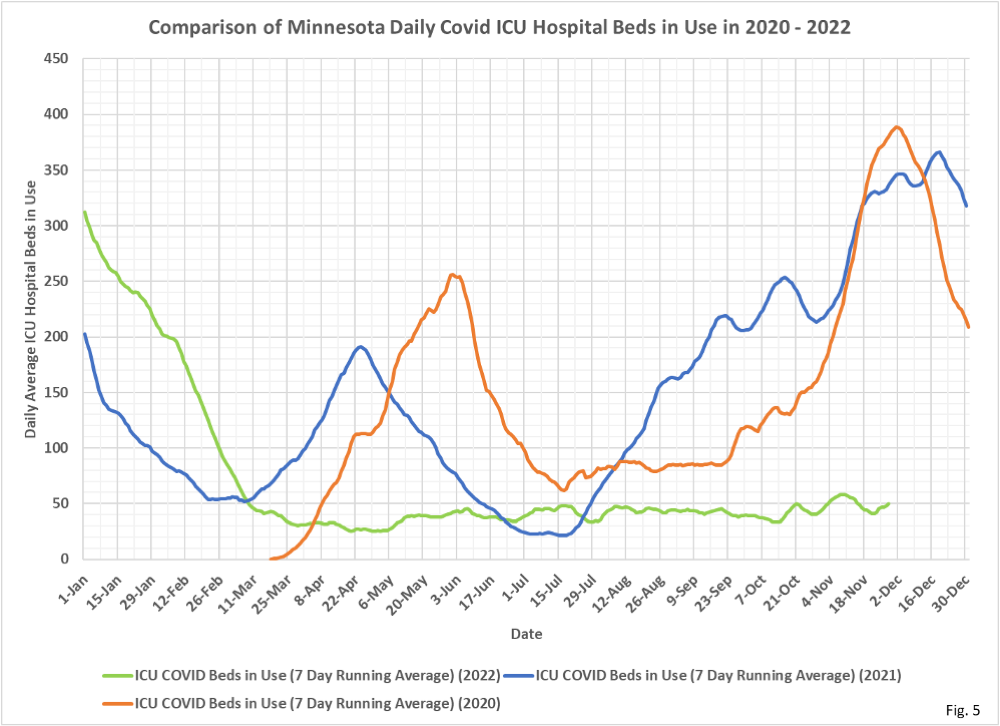
- Fig. 5: Covid ICU Beds in Use: Covid ICU beds in use are also gradually increasing, matching the gradual increase in ICU admissions.
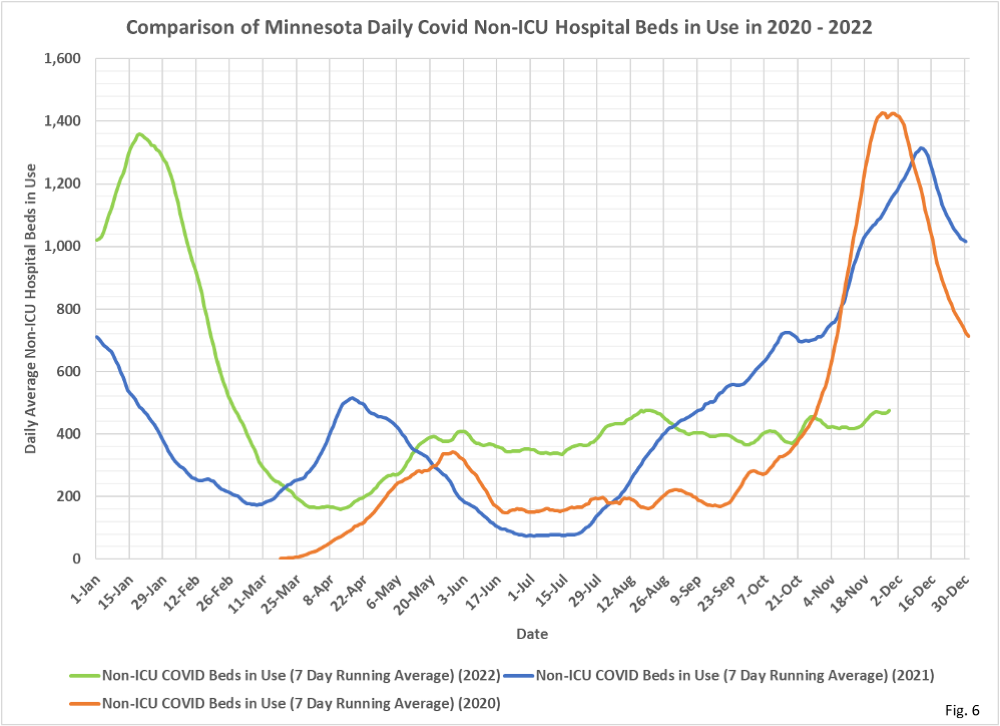
- Fig. 6: Covid Non-ICU Beds in Use: Non-ICU Covid hospital beds in use perhaps are also gradually increasing. Since Non-ICU admissions are generally level this implies that average length of stay may be slightly increasing. Length of stay data is unavailable from MDH.
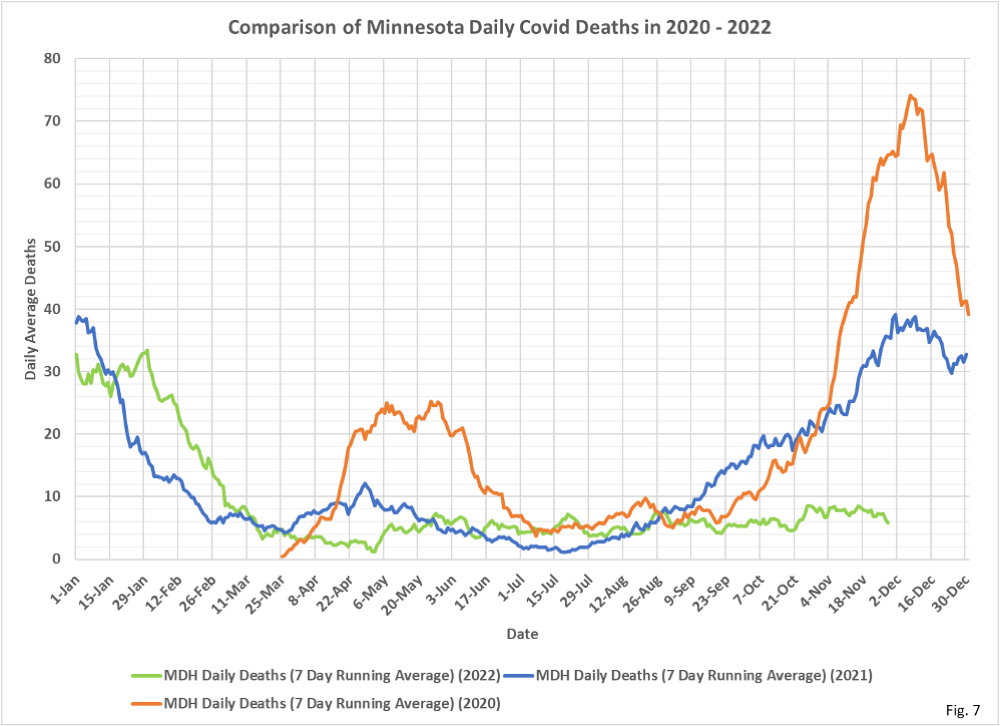
- Fig. 7: Covid Deaths: Deaths attributed to Covid also appear to have a gradual increasing trend since May, matching the general increase in hospital admissions.
- All data is taken from data files available on various pages of the Minnesota Department of Health (MDH) Situation Update for COVID-19 web page https://www.health.state.mn.
us/diseases/coronavirus/stats/ index.html. - All data is shown as 7 day running averages.
