As usual, the best way to identify trends of an event in a population is to adjust for changes in the size of the population, so these charts on deaths in Minnesota that Dave put together are per capita rates. Understand that when we talk about identifying a trend, there may not actually be one, it is possible that deaths, in total or in some age groups hop around from year to year for random reasons. But we are trying to see if there is a trend, because you need a pre-2020 trend to be able to identify deviations from that trend.
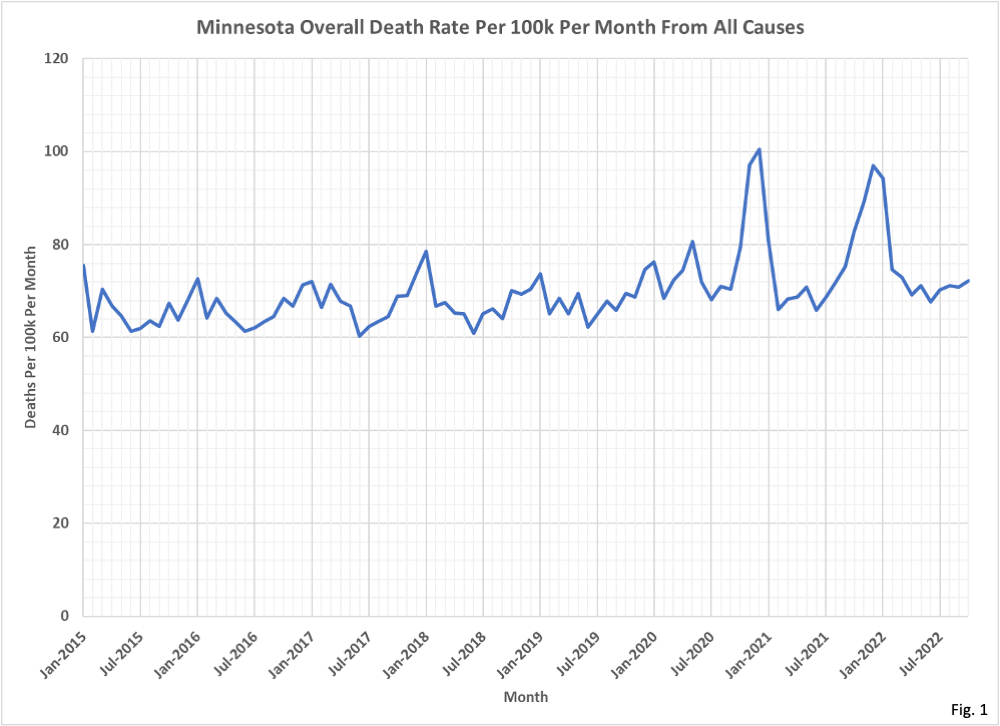
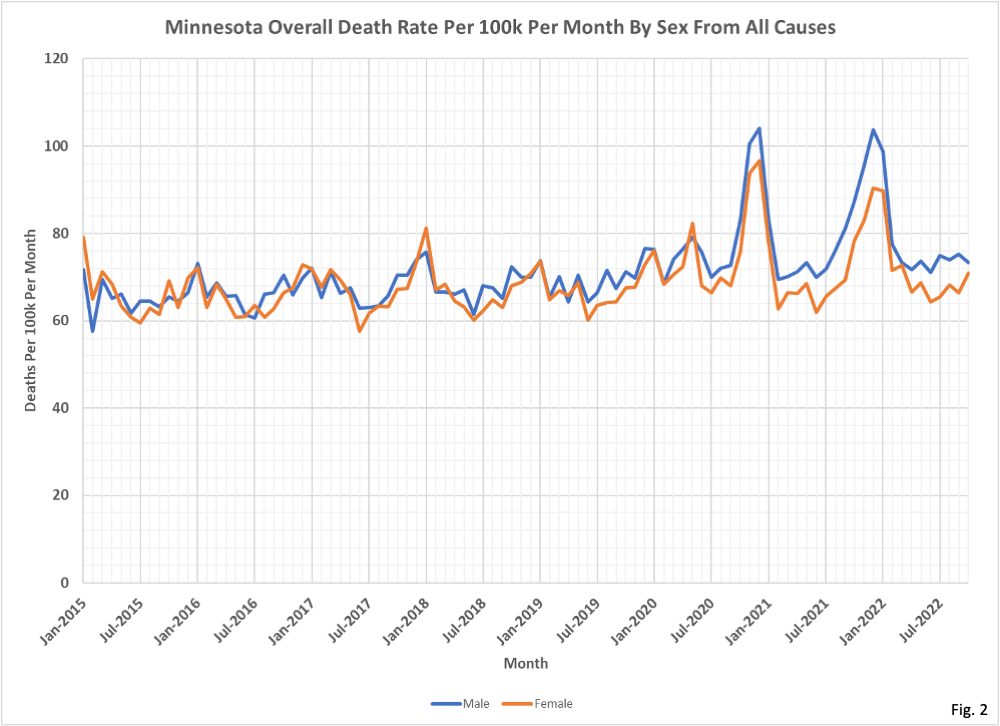
A couple of observations. Total deaths on a per capita basis were pretty flat in the pre-epidemic years. Male and female rates were close together, but on an age-adjusted basis, females have lower death rates because they live longer. Once again I demand equity for women, they should die at the same age and rates as men. During the epidemic, male death rates jumped more than women’s, which could be due to poorer general health.
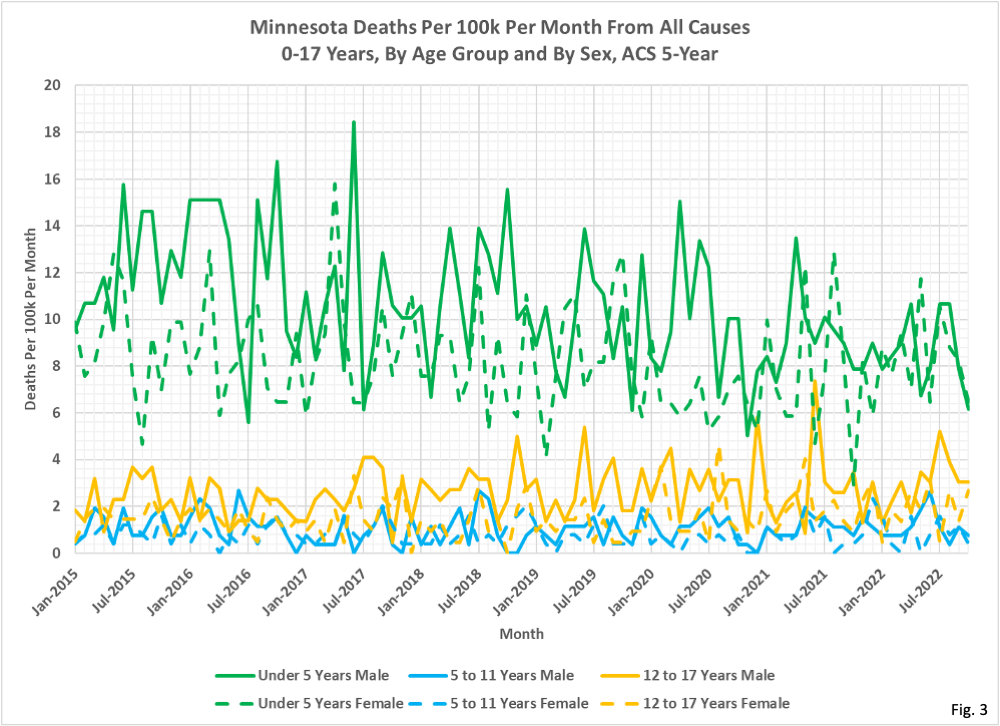
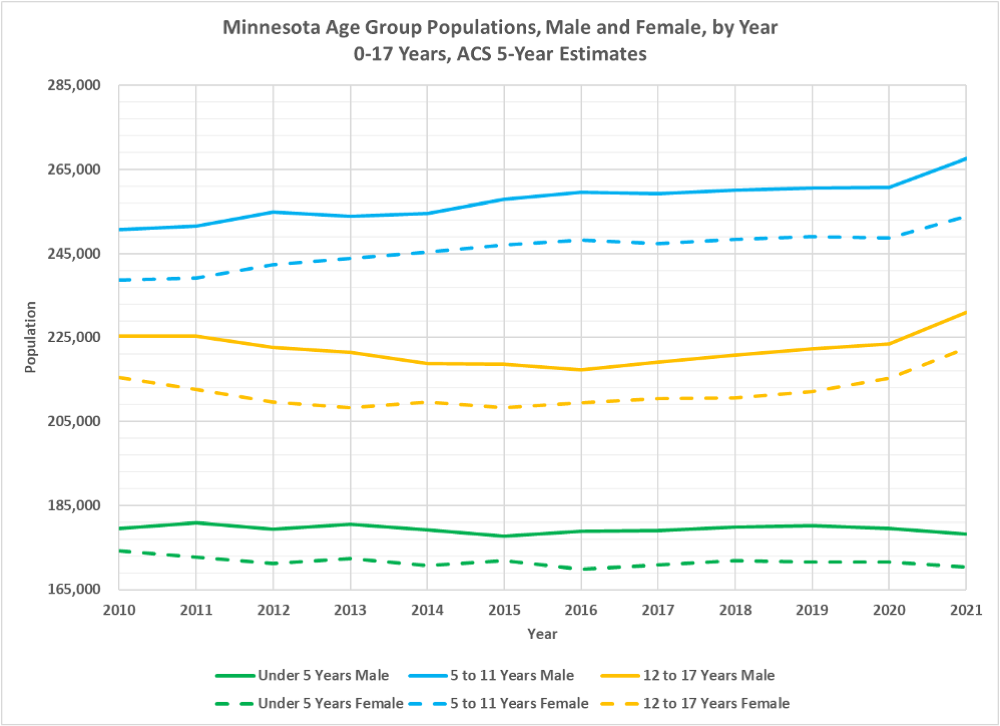
Contrary to fear-mongering by Alex Berenson and other vax-safety nuts, there is no increase in deaths in the youngest age group or really in younger children at all. How inconvenient.
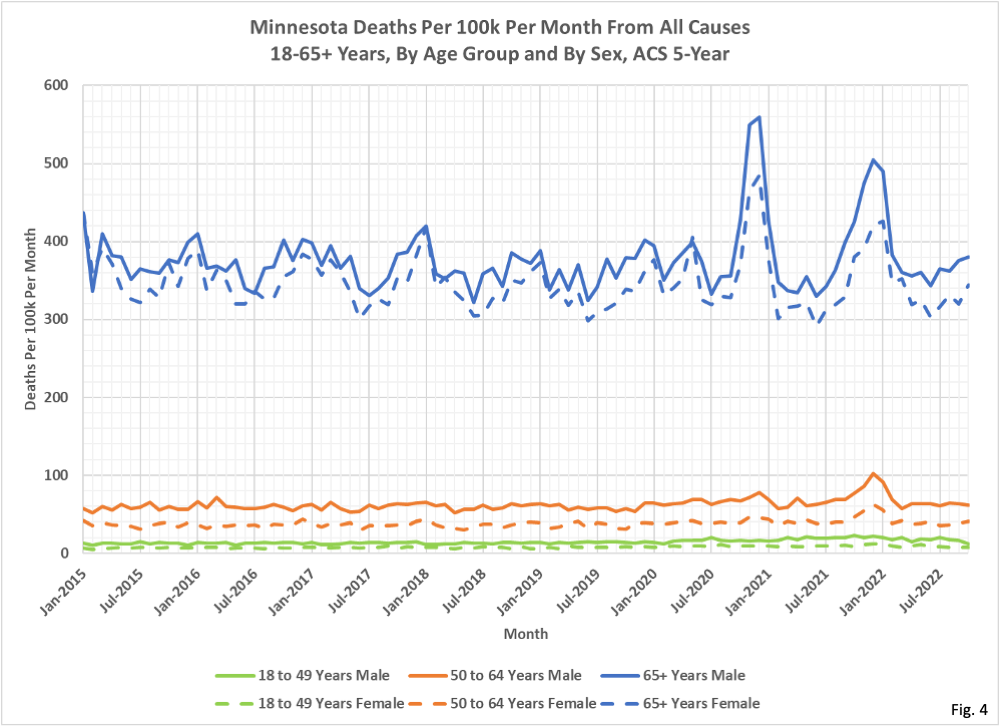
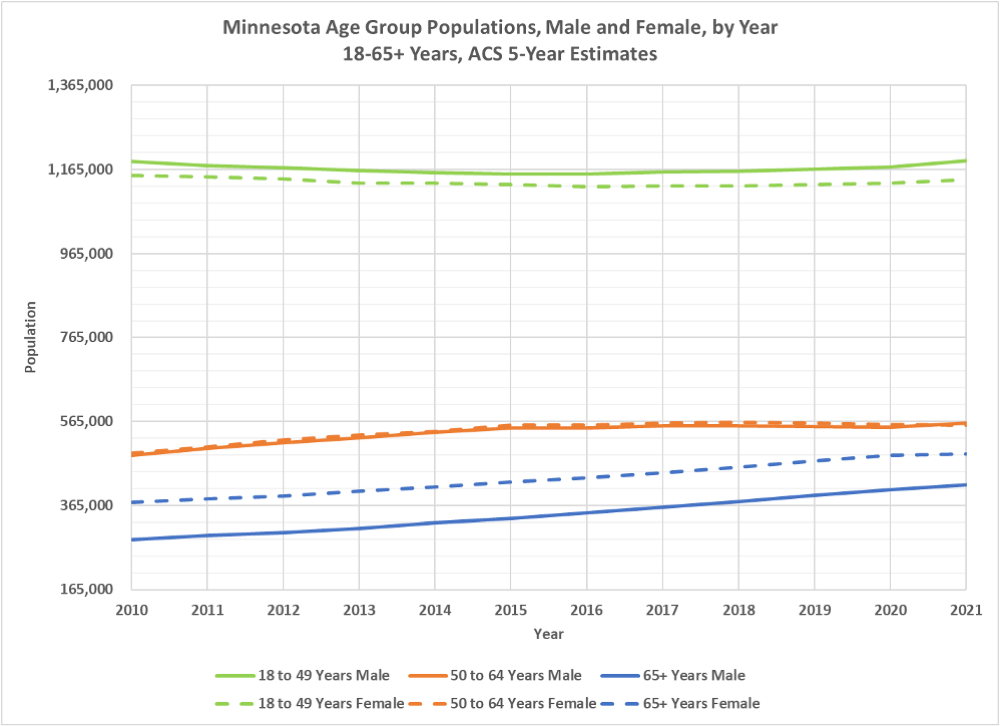
A slight bump in 18 to 49 men during the epidemic, which I will predict our by cause analysis will show to be largely due to overdoses and homicides. A slight bump in both sexes aged 50 to 64. In the oldest group, quite prominent spikes and after the first major spike, a dip below pre-epidemic levels, indicating some pull forward effect. After the second spike, a smaller dip is seen.
Some of the posts will have smaller age group breakdowns, so you can see more granular trends.
 Dave’s notes:
- In today’s post we examine the deaths per 100k from all causes in Minnesota for several different age groups and by sex. This is a follow up to our post Excess Deaths Part 1 (https://healthy-skeptic.com/
2022/12/23/excess-death- analysis-part-1/). In Excess Deaths Part 1 we examined the raw numbers of deaths in Minnesota from all causes. Today we are calculating the relative risk for an individual in these population sub-groups, by calculating the death rates per 100k. In addition, because we are using annual US Census Bureau population estimates for Minnesota, these death rates are corrected for yearly changes in population. We will refer to the Excess Deaths Part 1 post many times in the following notes. - The death certificate data used in today’s post, as in the Excess Deaths Part 1 post, comes from two collaborators who have analyzed Minnesota death certificates. A database of annual death certificate data can be ordered from the Minnesota Office of Vital Records (https://www.health.state.mn.
us/people/vitalrecords/index. html). These death certificate records include a vast amount of personal information, including name, maiden name, age, birth date and location, address, spouse name, place of death, and many other details. Most importantly for our purposes, we are also given the cause of death information from each death certificate, and other contributing factors listed on the death certificates. Deaths certificates from the years 2015 through 2022 have been sorted, categorized, and analyzed by our collaborators, which we are plotting and publishing here. Data for November 2022 is not plotted due to incomplete reporting. - We are using US Census Bureau population estimates for Minnesota to calculate death rates per 100k. We recently published some background information on the 2 different population estimates available from the US Census Bureau (https://healthy-skeptic.com/
2022/12/02/census-estimate- background/). For today’s post we are using the American Community Survey (ACS) 5-Year population estimates found in Table S0101, downloaded from the US Census Bureau here: https://data.census.gov/table? q=age&g=0400000US27&tid= ACSST5Y2021.S0101. The 5-Year population estimates for each year are based on survey data collected over a five year period. These estimates will lag whenever the underlying population is changing rapidly from year to year. Since the ACS 2022 5-Year estimate is not released yet we are assuming that the population in 2022 is the same as 2021. - Fig. 1, Minnesota Overall Death Rate Per 100k Per Month From All Causes: This chart displays the death rate per 100k for all causes each month in Minnesota. The death rate is determined by dividing the monthly deaths by the total population for each year (using the US Census Bureau ACS 5-Year population estimates), and then multiplying by 100,000. The peaks in late 2020 and late 2021 during the surge in Covid cases are most prominent. Compared to the first chart in Excess Deaths Part 1 (https://healthy-skeptic.com/
2022/12/23/excess-death- analysis-part-1/) we can see that the overall trend deaths per 100k in 2015 through 2020 appears flatter than the raw deaths per month. Some of the increase in raw deaths prior to Covid was due to the increase in population in Minnesota. However, the death rate per 100k in Fig.1 is still increasing. This increase can be due to either actual higher risk of death from all causes, or by the gradual aging of the population in Minnesota. Since the risk of death increases with age, the aging of the population will also tend to increase the death rate over time. More analysis will be needed to fully explain the pre-Covid increase in the Minnesota overall death rate. - Fig. 2, Minnesota Overall Death Rate Per 100k From All Causes Per Month By Sex: This chart converts the number of deaths per month for each sex in Fig. 2 of Part 1 into death rates per 100k. Males and females have very similar death rates from 2015 through the middle of 2020. Starting in mid-2020, as the Covid pandemic really got underway, males overall have a much higher death rate. This differential continues despite the waning of the apparent severity of Covid in the later months in 2022. More analysis will be needed to determine if non-Covid factors are responsible for this differential in death rates between the sexes.
- Fig. 3, Minnesota Deaths From All Causes Per 100k Per Month, By Age Group and By Sex, 0-17 Year Old Age Groups: Fig. 3 displays the death rate per 100k each month for the pediatric age groups. The death rates for males generally exceeds the death rate for females for each age group for each month. The death rates for both male and females in the Under 5 age group are trending downward over the entire time period. A full analysis of trends in death rates both before and during the Covid pandemic are topics for future analysis.
- The spikes in death rate in Fig. 1 and Fig. 2 in late 2020 and late 2021, during the surges in Covid cases, are not present in the death rates for the Under 5 and 5 to 11 Years age groups. However, we do see spikes in the death rates for 12-17 Males in late 2020 and late 2021. This seems peculiar since males in this age group were not especially susceptible to bad outcomes from Covid infections. In Fig. 3 of Excess Deaths Part 1 we can see that there indeed are higher numbers of 12-17 Male deaths in late 2020 and late 2021. More analysis will be needed to determine the cause of these spikes in deaths.

Very nice work by both of you. It appears that there’s a clear trend of increased deaths in the winter months each year, which makes sense due to it being cold/flu season. However, it appears that there’s a much larger increase in deaths during the winter months the last two years. It’ll be interesting to see if that trend continues this winter. It could be due to our state’s population getting older (65+ are much more likely to die than younger people) or it could be some other reason (suicide, vax safety, missed medical diagnosis, etc). I have an open mind to the idea that there are safety issues with the COVID vaccine, but agree that there’s not anywhere close to enough data to conclude that at this point.
One item I was talking about with a friend recently. I have no data to back it up, but there seems to be a lot more people getting cancer now than from what I remember previously. Now it could just be that people our age (early 40’s) have older relatives that are more likely to get it, but it does seem to be quite alarming with how many are getting it at once. We went through a list of people we know that have been diagnosed recently and thought about whether each one had gotten COVID for sure, gotten the vaccine, etc. The breakdown as far as the vaccine is concerned was roughly 80% having gotten the vaccine to 20% not gotten the vaccine, which is pretty close to the breakdown of the population generally. But hardly big enough to be anywhere close to a scientific study. But we did wonder whether a COVID infection (which I’d guess 99.9% of the population has gotten at this point) increases the likelihood of developing cancer.