Dave Dixon’s relentless pursuit of an issue always provides enlightening material. Since Dave realized that something was off in the population estimates used by DOH in calculating vax effectiveness, he has continued to poke at the issue and look at alternatives. For reasons that are unclear, DOH is using a five-year trailing average from the US Census Bureau to estimate total population and population by age groups, even though a 2020 five year average is available, as is a 2021 one-year average. That creates a mismatch with the data used to create the vaxed and vaxed and boosted sub-group populations in Minnesota, which are current within a month of each week’s reporting. So basically a 2019 total population estimate is used in a calculation with current 2022 data. As we showed in the initial post, the effect is to boost vax effectiveness. I don’t know if this is intentional, it simply could be that DOH didn’t think through the consequences of their choices.
A quick reminder that the core concept is that DOH 1) gets the total population estimate from the census table, broken down by age group, 2) knows from other data it collects the size of the vaxed and vaxed and boosted sub-groups, so 3) adds those two group sizes together, subtracts from the total and what is left is the unvaxed population. Minnesota has three adult age groups for vaccine effectiveness reporting purposes, 18 to 49, 50 to 64 and 65 and over. As Dave explains below, because of the different sizes of the total population and the different size of the unvaxed population, the effect of using the wrong total population estimate is different for each group. The 65 and over age group has by far the smallest unvaxed sub-group, so changes in the size of that group have a substantial effect on subsequent event rate calculations.
As a check on our work, we took a week much earlier in the year, during the Omicron peak, to ascertain if we saw the same impact. Although somewhat smaller, you can see in the tables the similar effect on comparative rates.
Dave is continuing the exploration. We are going to give you raw tables of the census estimates over an extended period so you see the typical changes in a population sub-group from year-to-year and can see the longer term trend to identify if any year is an anomoly. We will show you the effect of using the one-year estimate instead of a five-year averaged estimate. We will show the effect of using 2021 data when it is released in a week. And we will do a projection of what the current 2022 population likely is, based on extrapolation from past trends.
The important conclusions so far appear to be that unvaxed rates of events are far lower than those DOH has been publishing, and that the decline in effectiveness applies to hospitalizations and deaths, not just cases. So vaccine effectiveness against serious disease in the 65 and over group has been and is continuing to be exaggerated. Nonetheless, there is still some effectiveness, less currently than at the start of the year, but there does appear to be some level of protection against serious disease.


 Dave’s notes:
- We recently discussed the impact the use of the 2019 US Census Bureau population estimates by the Minnesota Department of Health (MDH) has on Covid cases, hospital admissions, and deaths rates per 100k here, here: https://healthy-skeptic.com/
2022/11/30/data-fiddling-in- the-estimates-of-vax- effectiveness-for-the-over-65- age-group/. MDH calculates the size of the unvaccinated population of each age group by starting with the US Census estimate for the age group and then subtracting the populations of the vaccinated and of the boosted, as MSH describes under Data Definitions here: https://www.health.state.mn. us/diseases/coronavirus/stats/ vbt.html. In this post we examine the consequences of using the 2019 population estimate instead of the 2020 population with Covid data starting in May 2021, which are dramatic for the 65+ age group. The US Census Bureau currently plans on releasing the 2021 population estimates in a few days on Dec. 8. Only when the 2021 population estimates are released will we finally have a population estimate that is for the same time period as of the start of Covid breakthrough data. - Currently MDH uses the 2019 American Community Survey (ACS) 5-year Estimate. However the ACS 2020 5-year Estimate was released earlier this year, but not implemented by MDH. Because the unvaccinated populations are calculated as the residual after subtracting the sizes of the vaccinated and of the boosted population, any changes in the size of the overall age group population will flow through to the unvaccinated population. In comparing the 2019 Census to 2020, we can see that the 65+ age group increased by 28,878, which therefore increased the size of the unvaccinated group by the same amount. As we will show, this then greatly lowers the rates per 100k of cases, hospital admissions, and deaths for the 65+ age group. However, the impact on the 50-64 and 18-49 age groups is very minimal.
- Fig. 1, Minnesota Covid Data 65+ Age Group, 10/30/2022: This table displays the population and Covid data for the 65+ age group for the week of 10/30/2022, as found in the data file “vbtadultcirates.xlsx”, downloaded from the MDH Vaccine Breakthrough web page on 11/24/2022: https://www.health.state.mn.
us/diseases/coronavirus/stats/ vbt.html. The overall age group populations for 2019 and 2020, at the top of the yellow columns, are found in the ACS 5-year estimate (Table S01010) for Minnesota, downloaded from the US Census Bureau web page on 11/21/2022, here for 2019 (https://data.census.gov/ table?g=0400000US27&tid= ACSST5Y2019.S0101) and here for 2020 (https://data.census.gov/ table?g=0400000US27&tid= ACSST5Y2020.S0101). The boosted and vaccinated populations are taken from vbtadultcirates.xlsx, and the resulting unvaccinated population is calculated by subtracting these from the overall population total. Cases, hospitalizations, and deaths are all taken from vbtadultcirates.xlsx for the week of 10/30/2022. The rates per 100k are calculated by dividing the cases, hospitalizations, or deaths by the population size, and then multiplying by 100,000. Note that the rates per 100k we calculated for the 2019 population size matches the rates published in vbtadultcirates.xlsx. - The critical point in Fig. 1 is to compare the rates per 100k for the unvaccinated using the 2019 population estimate, as used by MDH, with the rates per 100k which result from using the 2020 population estimate. These are shown highlighted in purple. Note that the unvaccinated population size increased from 2019 to 2020 by 28,878. This results in a dramatically lower calculated rate per 100k for the unvaccinated using the 2020 population estimate. The cases rate per 100k, for example drops from 396.4 per 100k using the 2019 population, to 270.2 per 100k using the 2020 population, a decrease of 31.8%. Meanwhile, because the sizes of the boosted and vaccinated groups come from MDH data bases, the rates per 100k for the boosted and vaccinated groups are unaffected by the difference in overall population size estimate, as shown in the columns highlighted in green and pink.
- Note that the 65+ age group is highly affected by the change in estimated overall population because it is almost all vaccinated. The resulting unvaccinated population for the 65+ age group is very small, so the change in population size from the 2019 to the 2020 estimates is proportionally very large.
- Fig. 2, Minnesota Covid Data 65+ Age Group, 01/02/2022: Here we repeat the data table in Fig. 1, but using data from near the peak of the Omicron wave for the week of 01/02/2022. Compared to Fig. 1, we can see the 2019 unvaccinated population is slightly larger than on 10/30/2022, and so the increase in unvaccinated population using the 2020 estimated population is proportionally slightly smaller than on 10/30/2022, but is still significant. The cases per 100k drop by 27.4% using the 2020 Census population vs 2019, compared to a 31.8% drop for the week of 10/30/2022. Going back further in time, because the unvaccinated population is larger the farther back we go, the percentage reduction will be smaller using the 2020 estimates instead of 2019.
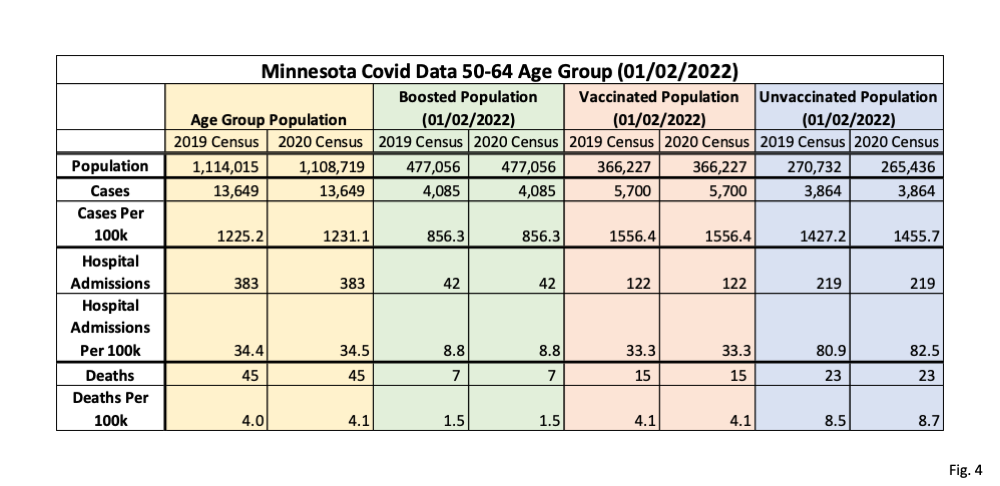
- Fig. 3 and 4, Minnesota Covid Data 50-64 Age Group, 10/30/2022 and 01/02/2022: In these two tables we display the impact of using the 2020 population estimate vs the 2019 population estimate for the 50-64 age group. In contrast to the 65+ age group, we can see that the 50-64 age group actually went down by 6,296, which then causes the unvaccinated age group to go down by the same amount. Because the unvaccinated population is relatively large, compared to the 65+ age group, this increase in unvaccinated population estimates causes the rates per 100k using the 2020 population estimate to go up very slightly compared to 2020, as shown in the purple columns.
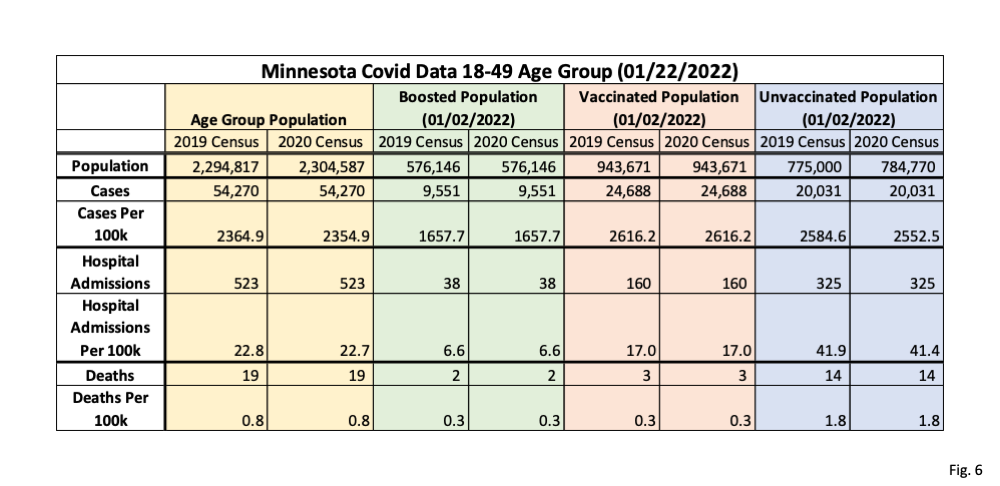
- Fig. 5 and 6, Minnesota Covid Data 18-49 Age Group, 10/30/2022 and 01/02/2022: In these two data tables we display the impact of using the 2020 population vs. the 2019 population estimate for the 18-49 age group. This age group increases by 9,770 using the 2020 population estimate (yellow columns), which increases the unvaccinated group size by the same amount, and therefore lowers the unvaccinated rates per 100k by a very slight amount (purple columns). Because this age group has a very large unvaccinated population the increase in population size from the 2019 to the 2020 estimate has a very small impact on the resulting rates per 100k.

Is there any way that Dave Dixon could engage in a public and comprehensive dialogue, either written or verbal?
Dave has regular contact with DOH and a back and forth with them. They tend to be defensive about their methods but we will see.
With DOH?
You said: “I don’t know if this is intentional, it simply could be that DOH didn’t think through the consequences of their choices.”
My comment – To find the cause of any problem in society, presume that government is guilty until proven innocent.’ So whether it was intentional or not, doesn’t matter. They were responsible for the data and false conclusions.
Thank you for putting your data in a table instead of a chart. The charts show trends over time, but in periods like the present it is difficult to accurately evaluate the differences in the various populations since the chart lines are so close together.