Everyone keeps waiting for a fall/early winter wave and at least in the official reports there just aren’t signs of that. Flu and RSV appear to be more of a problem.


 Dave’s notes:
- This post is an update to the yearly comparison charts last published here on 11/07/2022: https://healthy-skeptic.com/
2022/11/07/year-over-year- charts-november-2022/. The linear trend continues mostly unchanged, except for an uptick in ICU admissions. It is hard to know how seriously to take this when cases are gradually declining and we have had reports in the press that as many as 50% to 75% of Covid hospitalizations are admissions for non-Covid reasons. (Such as the StarTribune here: https://www.startribune.com/ covid-19-levels-stubbornly- stagnant-in-minnesota/ 600201117/). - Fig. 1: New Daily Covid Cases: New daily cases still very gradually declining since the peak last May. The very linear appearance of the cases curve is pretty remarkable. Baring a new variant that is more infectious, are the current case levels what the background level of Covid is going to be going forward? We don’t know how many tests are performed in Minnesota, since this data is not reported anymore, but perhaps as long as there is widespread testing we will continue to see this level of cases.
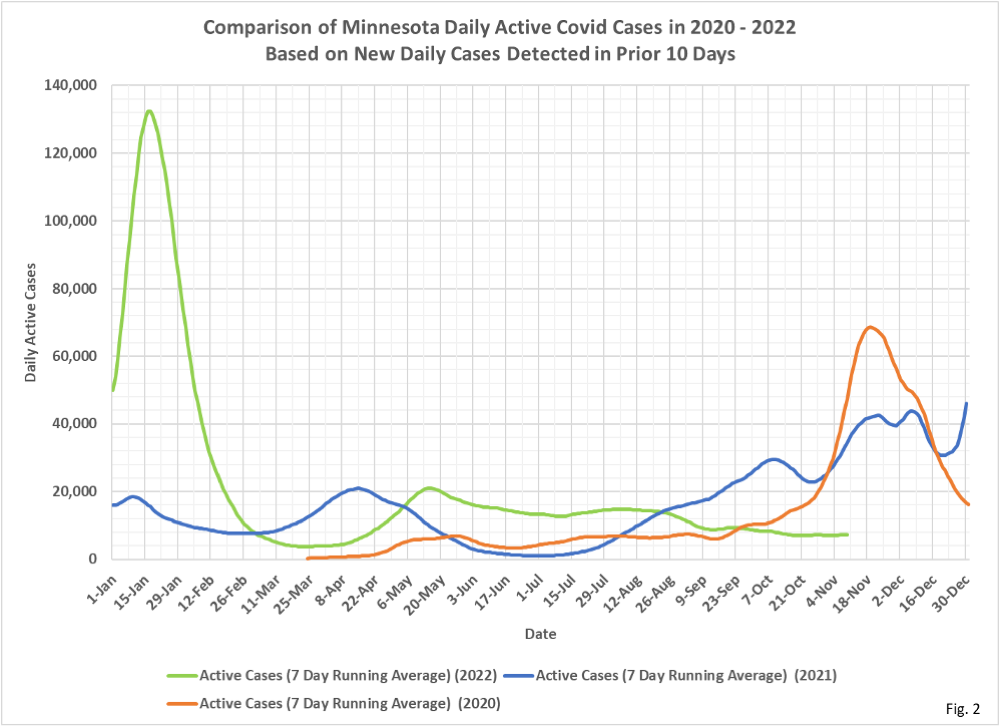
- Fig. 2: Estimated Active Covid Cases: We are simply showing the number of people who test positive in a 10 day period as an estimate for how many people may be actively infected at any one time, since MDH stopped reporting the number of people No Longer Needing Isolation.
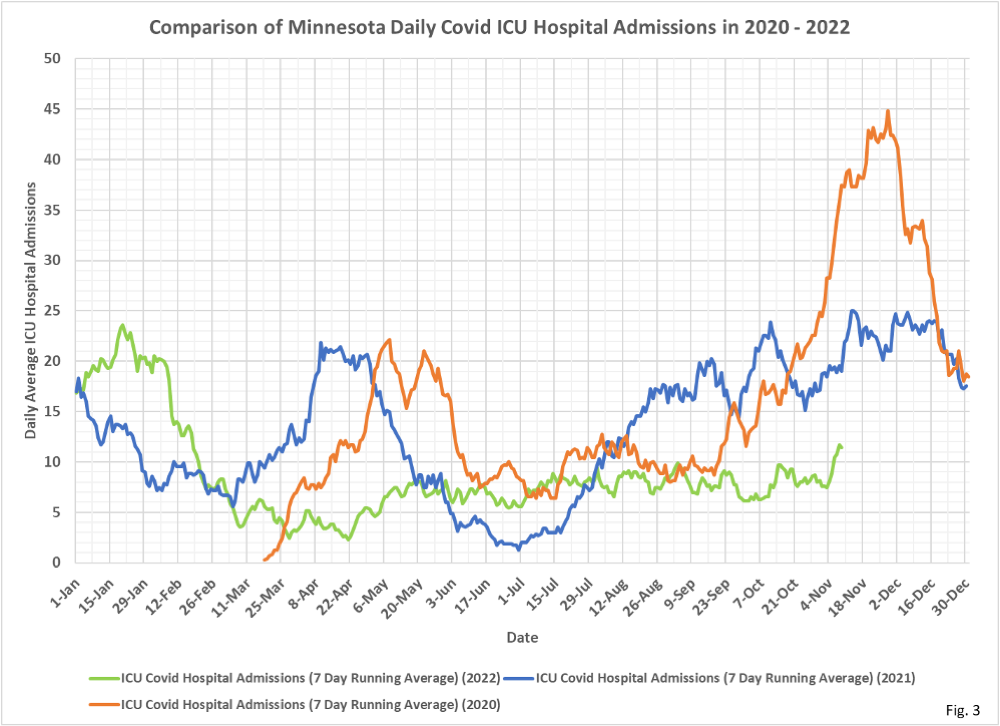
- Fig. 3: Covid ICU Admissions: Average daily Covid ICU admissions have broken out of the band that we have been seeing since May, exceeding 10 admissions per day for the first time since February 2022. It will take a few weeks to know if this increase is just noise in the data, or the start of an increasing trend for Covid ICU admissions in Minnesota.
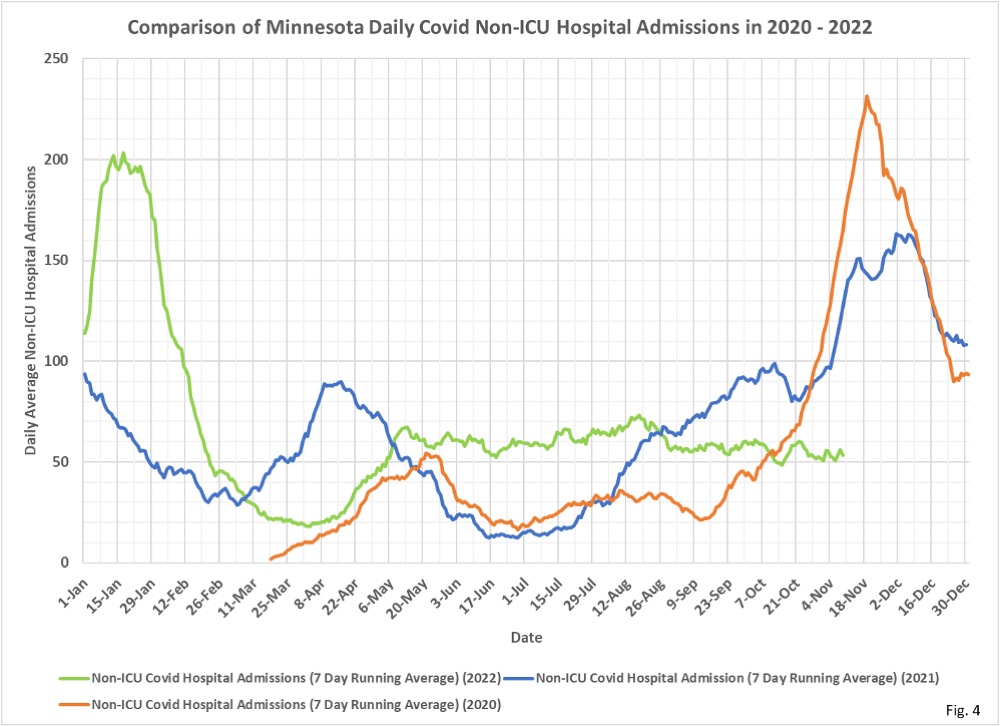
- Fig. 4: Covid Non-ICU Admissions: Average daily Covid Non-ICU admissions remain within the band of 50 to 70 admissions per day that we have seen since May, despite the increase in ICU admissions.
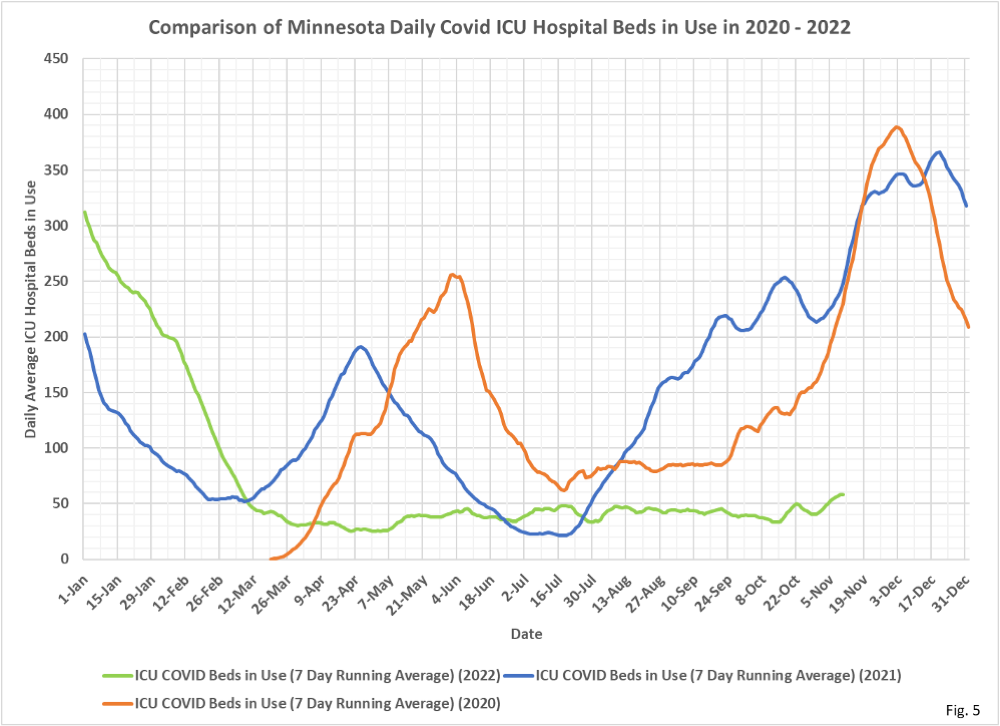
- Fig. 5: Covid ICU Beds in Use: Covid ICU beds in use have risen above 50 for the first time since March, to go along with the increase in ICU admissions. It is some consolation I suppose that ICU beds in use for Covid patients are much lower than at this time in 2020 or 2021.
- Fig. 6: Covid Non-ICU Beds in Use: Non-ICU Covid hospital beds in use remain quite consistent since May, with no increase in beds in use as seen for ICU beds.
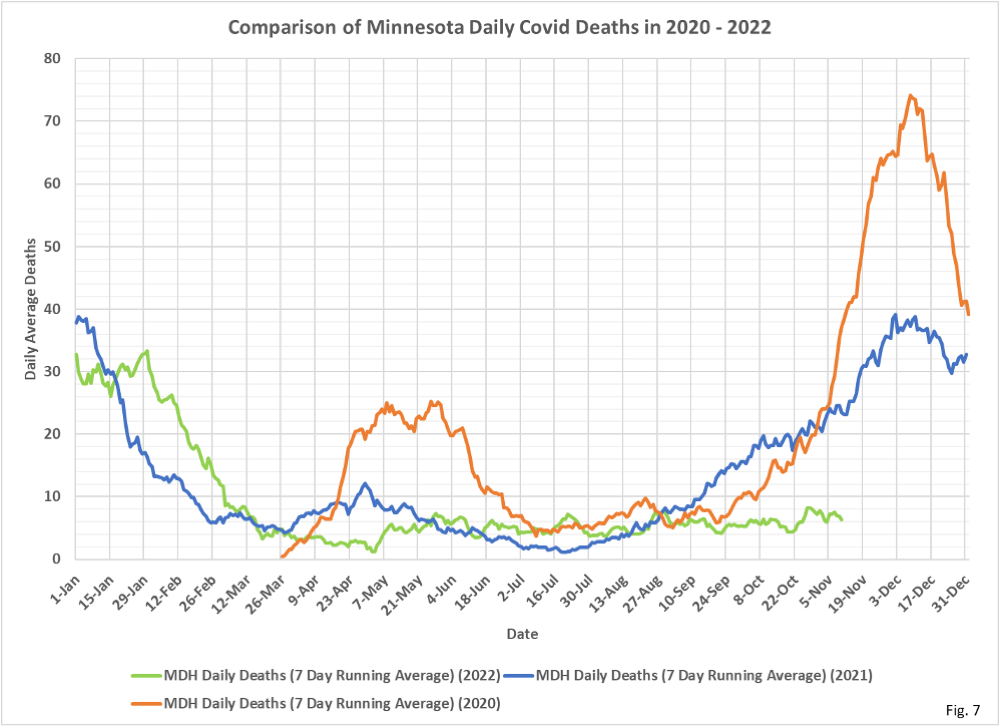
- Fig. 7: Covid Deaths: Deaths attributed to Covid have been relatively constant since May, similar to hospital admissions and beds in use.
- All data is taken from data files available on various pages of the Minnesota Department of Health (MDH) Situation Update for COVID-19 web page https://www.health.state.mn.
us/diseases/coronavirus/stats/ index.html. - All data is shown as 7 day running averages. The past 7 days of data is omitted, to avoid plotting potentially incomplete reporting. The last 14 days of death data is omitted.
