We do not seem to be experiencing the fall/early winter uptick in either cases or hospitalizations yet, although many factors make a comparison difficult.
 Dave’s notes:
- This post is an update to the yearly comparison charts last published here on 10/10/2022: https://healthy-skeptic.com/
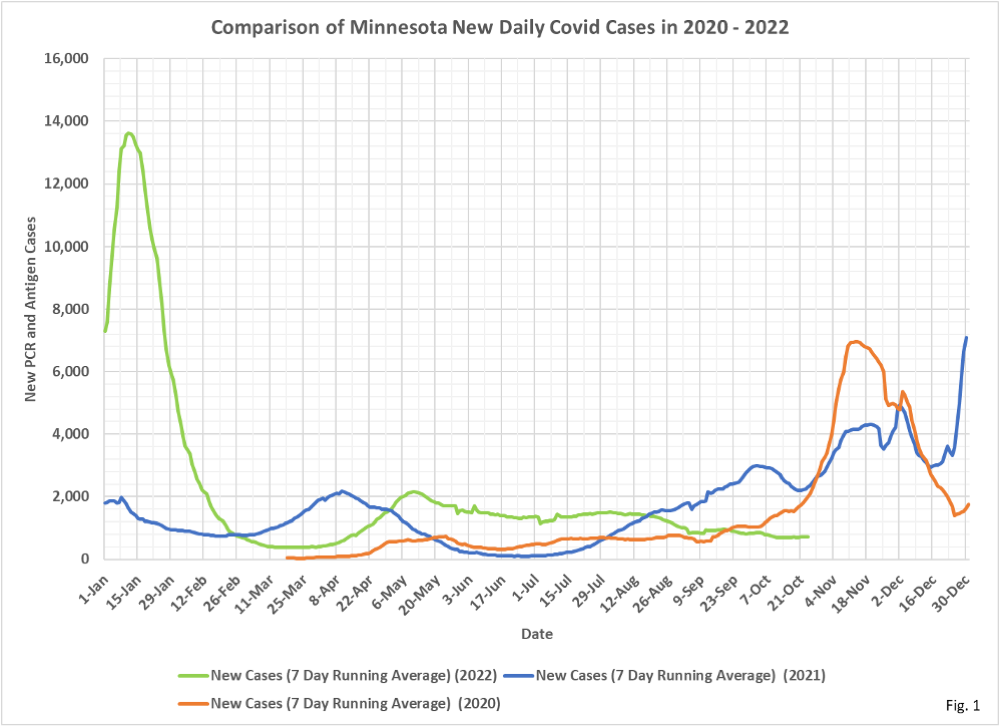
2022/10/10/year-over-year- charts-october-6/. Since then the general linear trends seem to continue, but most importantly we have yet seen any sign of an increase as winter approaches. Perhaps we won’t see a seasonal increase like we have the past two winters. - Fig. 1: New Daily Covid Cases: New daily cases still very gradually declining since the peak last May. The very linear appearance of the cases curve is pretty remarkable.
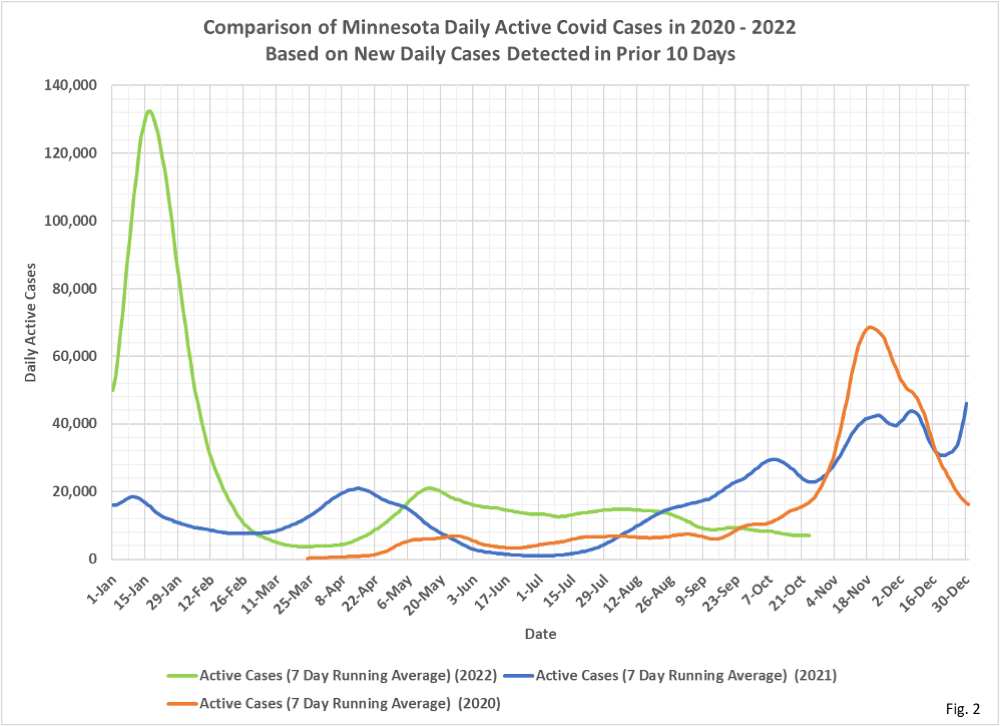
- Fig. 2: Estimated Active Covid Cases: We are simply showing the number of people who test positive in a 10 day period as an estimate for how many people may be actively infected at any one time, since MDH stopped reporting the number of people No Longer Needing Isolation.
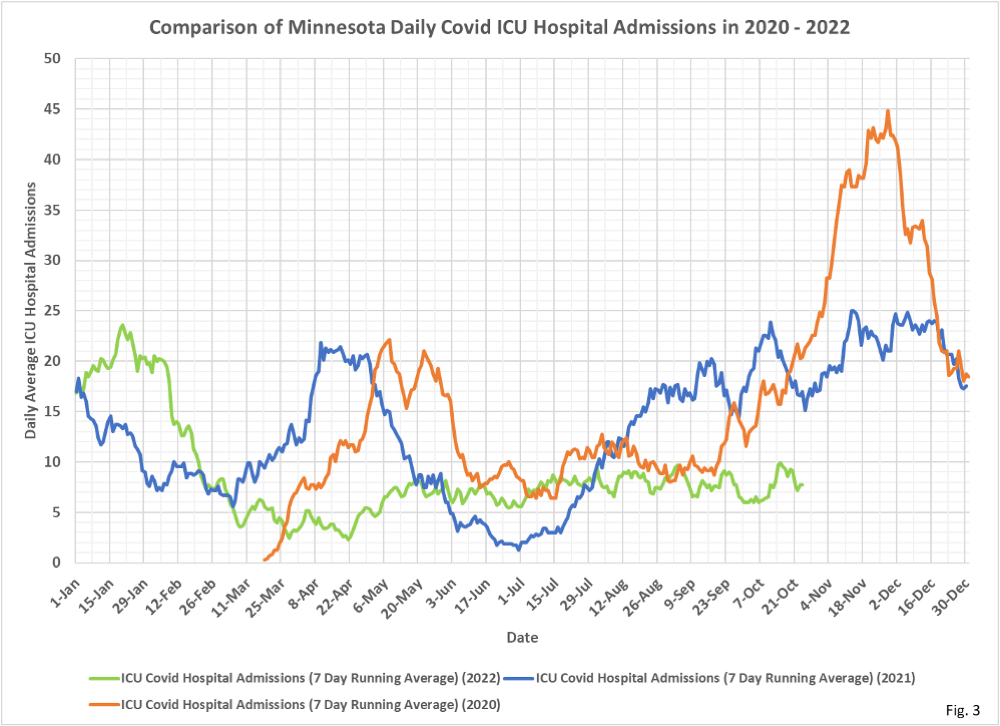
- Fig. 3: Covid ICU Admissions: Average daily Covid ICU admissions continue in a band between 5 and 10 admissions per day since early May. Although cases have been gradually declining since May the ICU admissions have been relatively constant, if not gradually rising. Of course, as reported in the StarTribune (https://www.startribune.com/
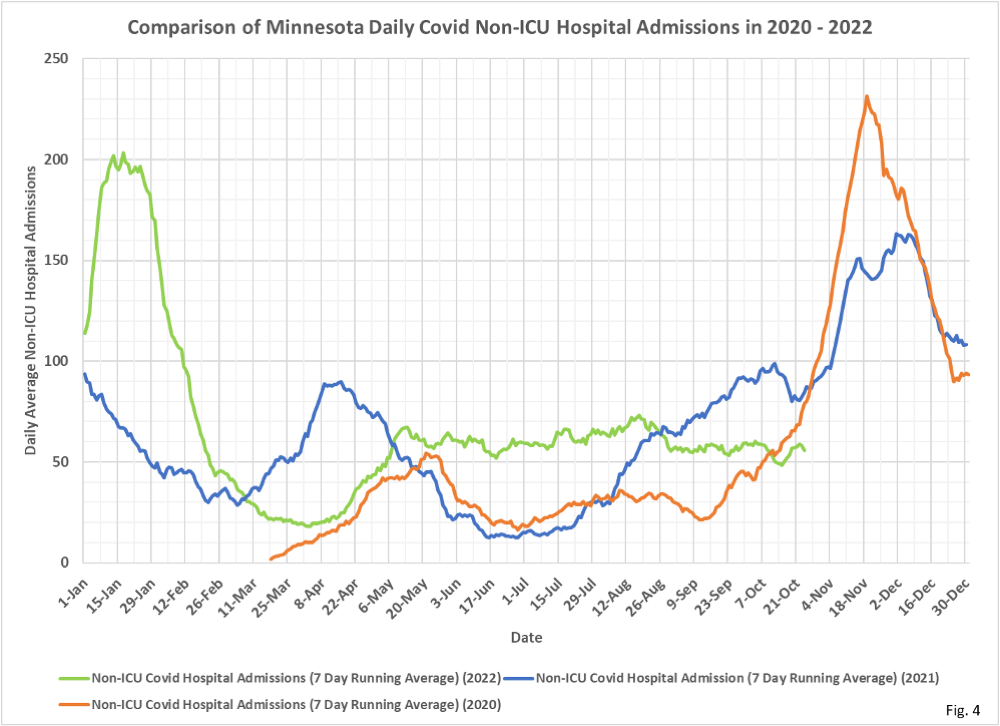
covid-19-levels-stubbornly- stagnant-in-minnesota/ 600201117/), between half and three-quarters of all Covid hospitalizations were admitted for non-Covid reasons. - Fig. 4: Covid Non-ICU Admissions: Average daily Covid Non-ICU admissions have also been remarkably consistent, having been in a band between 50 and 70 admissions per day since early May, although there was a reduction in admissions in August that has held so far.
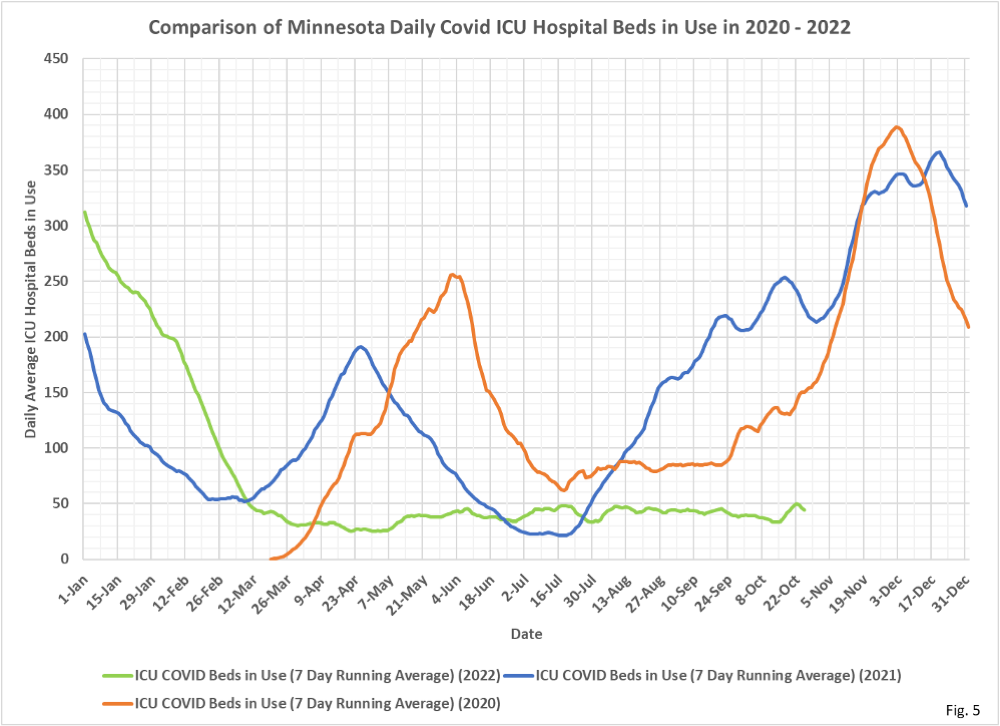
- Fig. 5: Covid ICU Beds in Use: Covid ICU beds in use have also been remarkably consistent, between 30 and 50 beds in use since early May, with no sign yet of a decline in beds in use as new cases gradually decline.
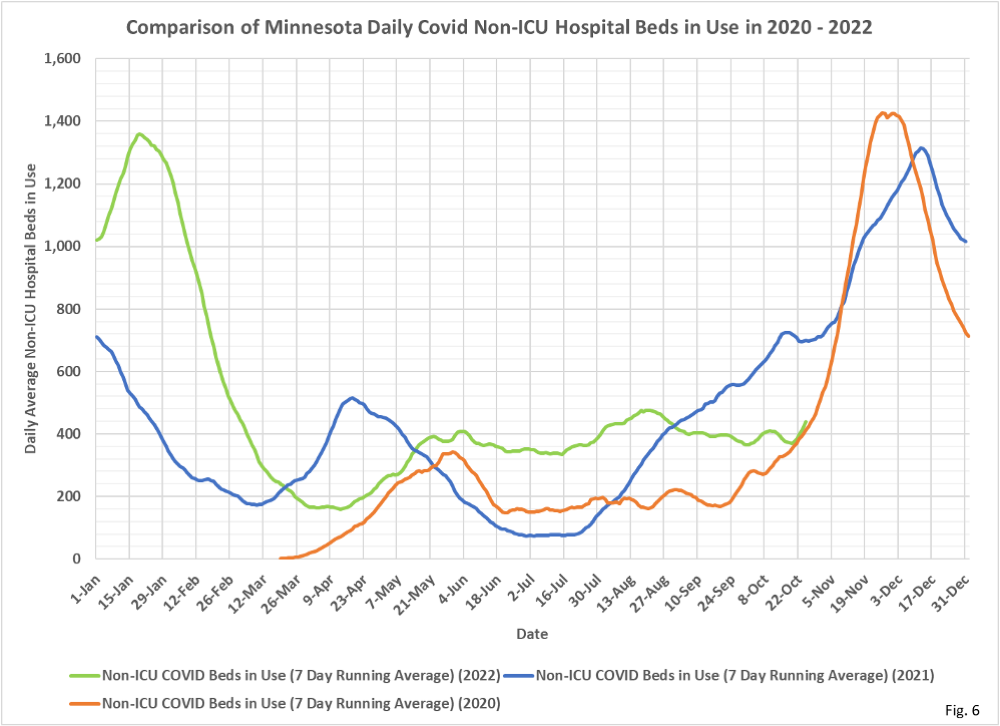
- Fig. 6: Covid Non-ICU Beds in Use: Non-ICU Covid hospital beds in use remain quite elevated despite the drop in Covid cases the last few weeks. Cases in 2022 are now a little lower than at this time in 2020, yet Non-ICU beds in use are 50% higher.
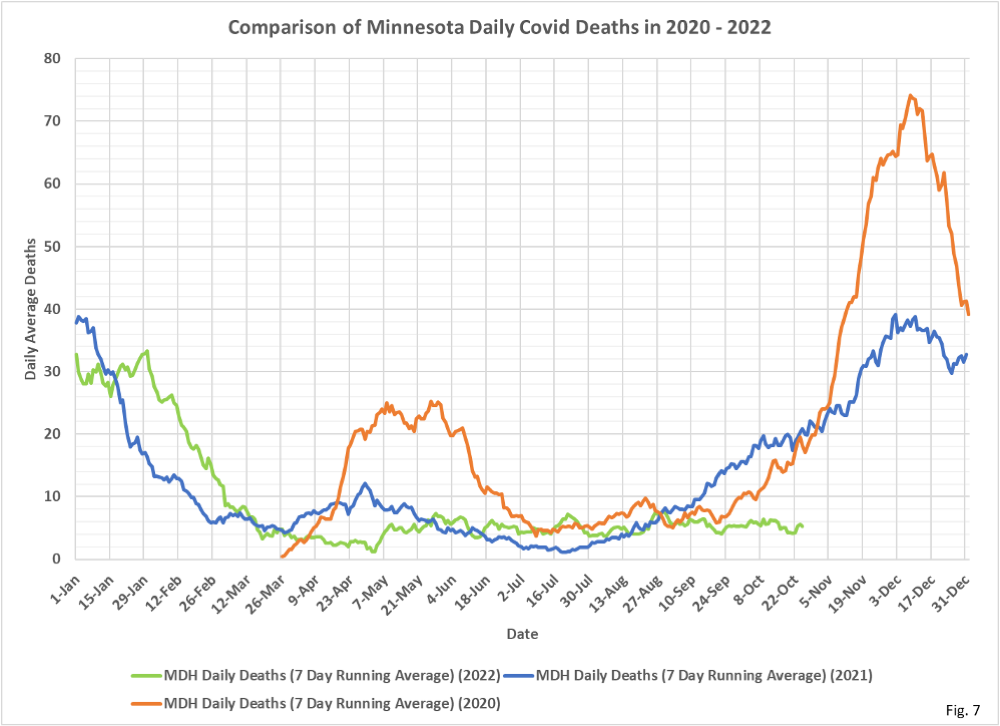
- Fig. 7: Covid Deaths: Deaths attributed to Covid have been relatively constant since May, similar to hospital admissions and beds in use.
- All data is taken from data files available on various pages of the MDH Situation Update for COVID-19 web page https://www.health.state.mn.
us/diseases/coronavirus/stats/ index.html. - All data is shown as 7 day running averages.
