Dave keeps looking at this because it is critical to the economy, and it is even the source of heating energy for many people in the Northeast. Supplies are tight, prices are high. Here is an article explaining why the price and supply of diesel is important. (Diesel Article)
 Dave’s notes:
- We recently posted on the topic of diesel fuel prices and days of storage, on 10/27/2022 here: https://healthy-skeptic.com/
2022/10/27/diesel-fuel-prices/ . In today’s update we have added one week of additional data, and we have added a second chart to each data set, starting from 1/1/2020, in order to see recent trends more clearly. - There is no material change in the data since our 10/27 post. Prices for gasoline and diesel have stabilized at a high level, although lower than the peak prices in June. Days of storage for diesel fuel remain at around 25 days of storage.
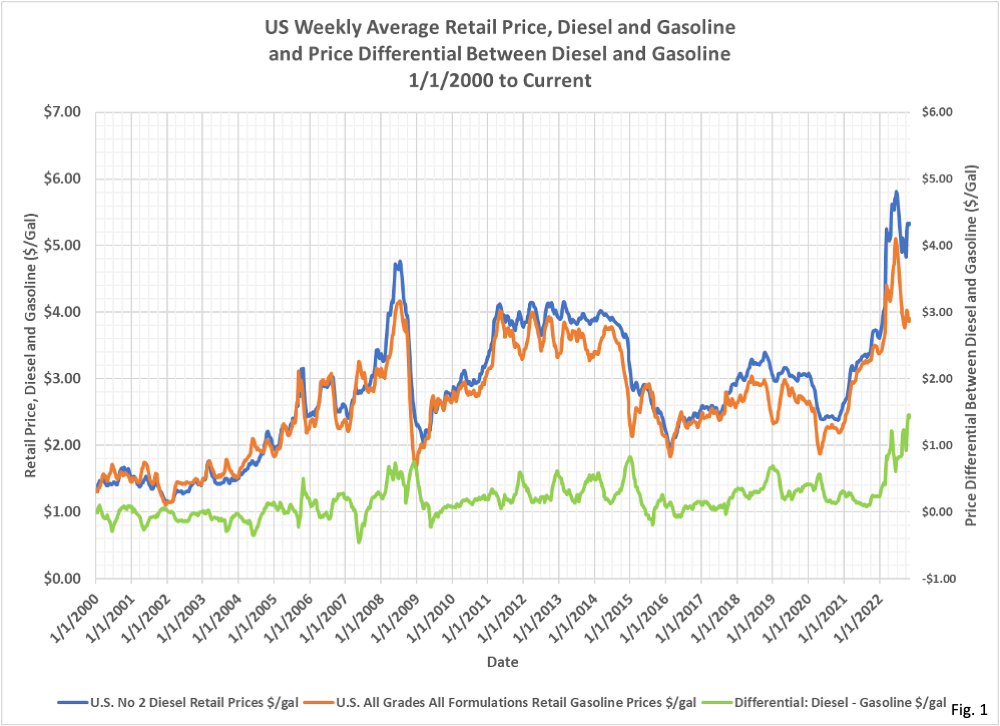
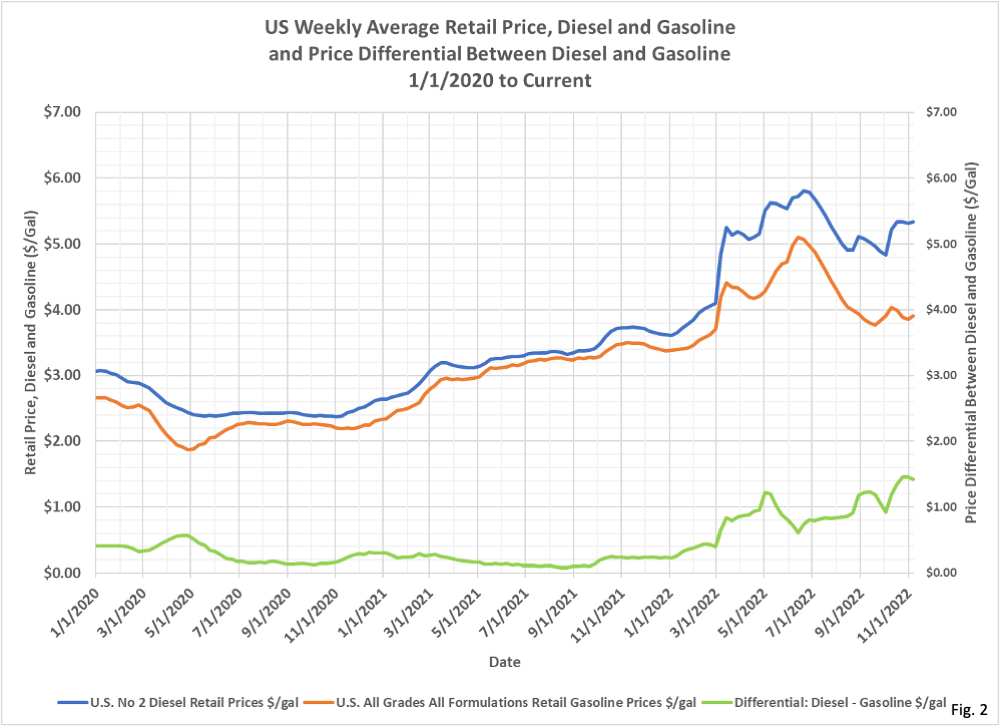
- Fig. 1 and 2, US Weekly Prices for Diesel and Gasoline: These charts shows the average US price for diesel fuel and gasoline, and the price differential between the two, from 2000 in Fig. 1 and from 2020 in Fig. 2. For 11/7/2022 the average US price for diesel fuel was $5.33/gal, and for the average of all grades and formulations of gasoline $3.91, with a differential between diesel and gasoline of $1.42/gal. The prices per gallon for gasoline and diesel fuel are lower than the peak prices in June, especially gasoline, which is $1.20 lower than the peak price of $5.11 on 6/13/2022. The difference in prices between gasoline and diesel remains high at $1.42, just $0.04 off the highest differential of $1.46 on 10/31/2022. It is interesting to note that prices for both gasoline and diesel started rising in early November, 2020, and took a sharp jump up on 3/1/2022. The large scale Russian invasion of Ukraine on 2/28/2022 led to this jump in prices, but the US was already in a precarious energy position at that time, with prices rising, refining capacity falling, and amount of fuel stored at relatively low levels and falling. The moral of the story is that when supplies are tight it only takes an international incident or natural disaster to cause a substantial spike in prices, which will have ripple effects throughout the economy. The data is available from the US Energy Information Administration (EIA) here: https://www.eia.gov/dnav/pet/
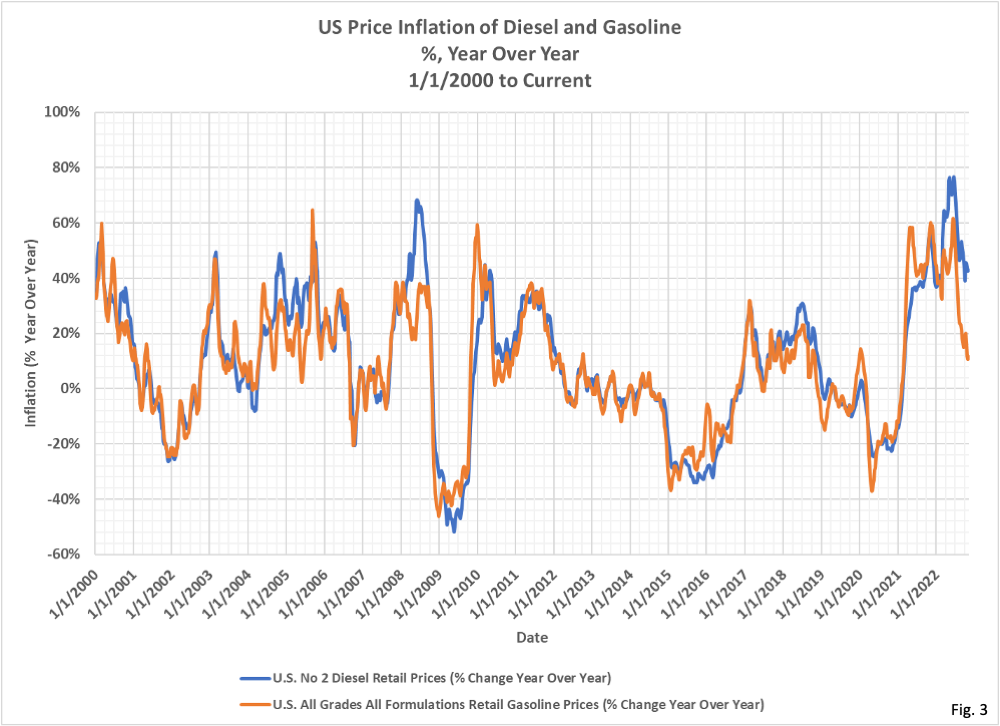
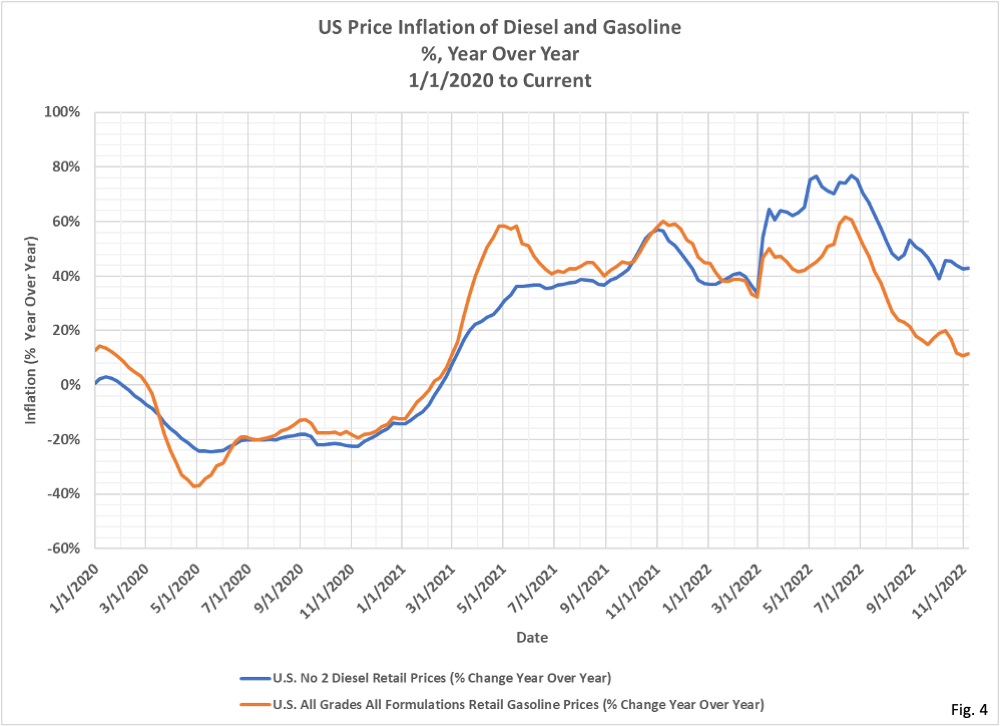
PET_PRI_GND_DCUS_NUS_W.htm . - Fig. 3 and 4, US Price Inflation of Diesel and Gasoline, Year Over Year: The year over year inflation rate of diesel and gasoline have both receded from the peaks in June. This is small consolation with the inflation rate for gasoline at 11.5% and diesel at 43%. Once we get to March of 2023 the year over year inflation rate will drop dramatically, once we start comparing 2023 prices to the prices after the March 2022 spike. The inflation rate is calculated from the price data displayed in Fig. 1 and 2.
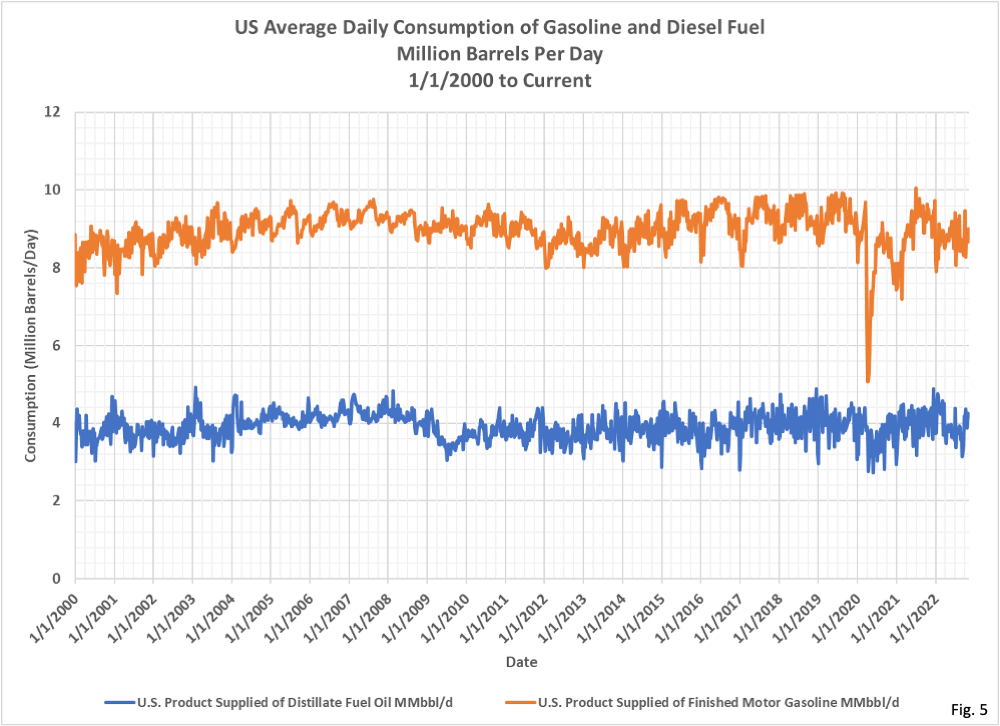
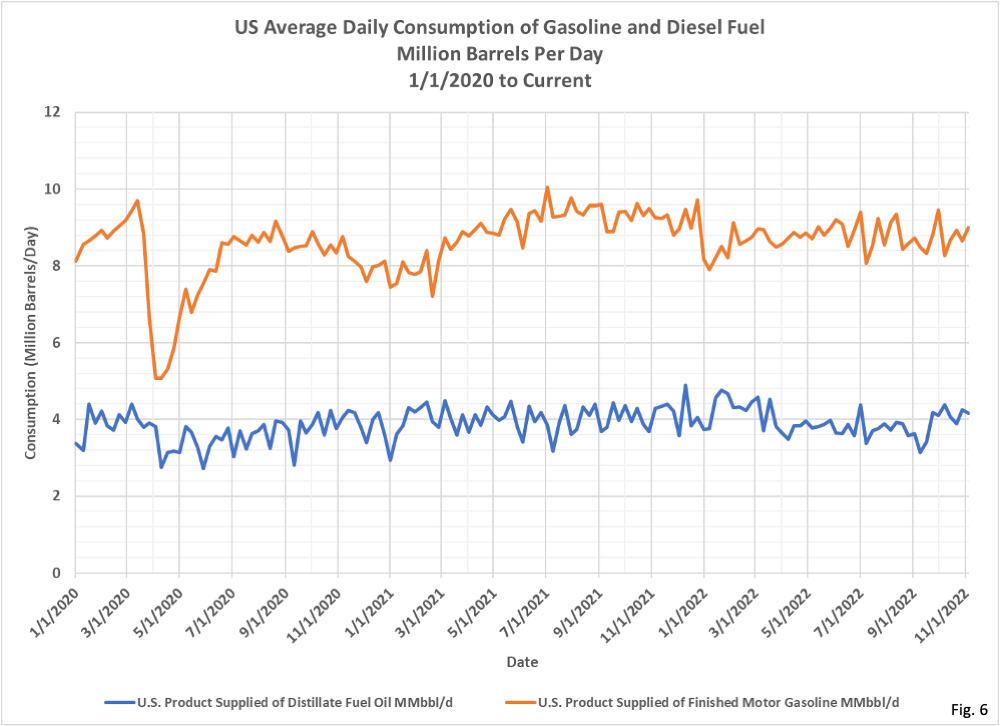
- Fig. 5 and 6, US Average Daily Consumption of Gasoline and Diesel: Consumption of diesel and gasolines are both well below the pre-pandemic peaks in 2019, and also lower than the post-pandemic recovery in 2021. High demand does not appear to be the cause of either high prices, or of low levels of storage. Note that the way the EIA defines things, product supplied by refineries and blenders is assumed to be equal to the amount consumed by vehicles. The data is available from the EIA here: https://www.eia.gov/dnav/pet/
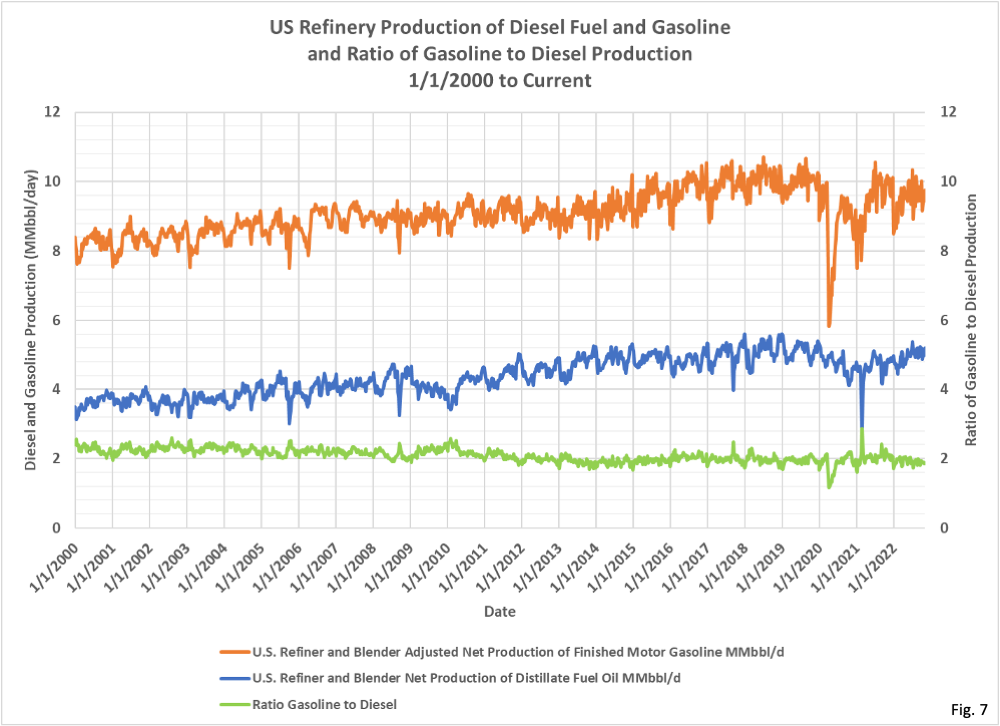
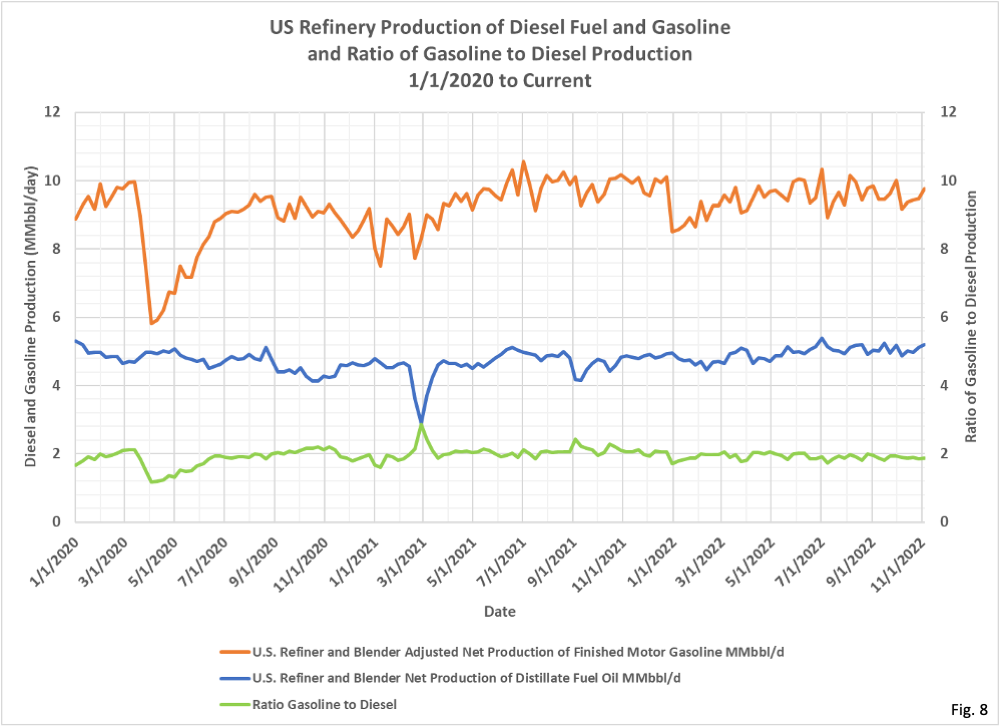
pet_cons_wpsup_k_w.htm . - Fig. 7 and 8, US Refinery Production of Gasoline and Diesel, and Ratio of Gasoline to Diesel Production: Shown here are US refinery production amounts since 2000 in Fig. 7 and from 2020 in Fig. 8. The production amounts were on a gradually rising trend up to the start of the Covid pandemic in 2022, while consumption was fairly flat as shown in Fig. 5 and 6. Gasoline production recovered nearly to pre-pandemic levels in July of 2021 but has been lower ever since. Meanwhile, diesel production never had a large decline at the start of the Covid pandemic like gasoline did, and production has been relatively stable in 2022. The ratio of gasoline production to diesel production has been slowly falling since 2000, meaning that proportionally less gasoline is produced per volume of diesel. This means that refinery mix is not responsible for reduced diesel storage amounts. The data is available from the EIA here: https://www.eia.gov/dnav/pet/
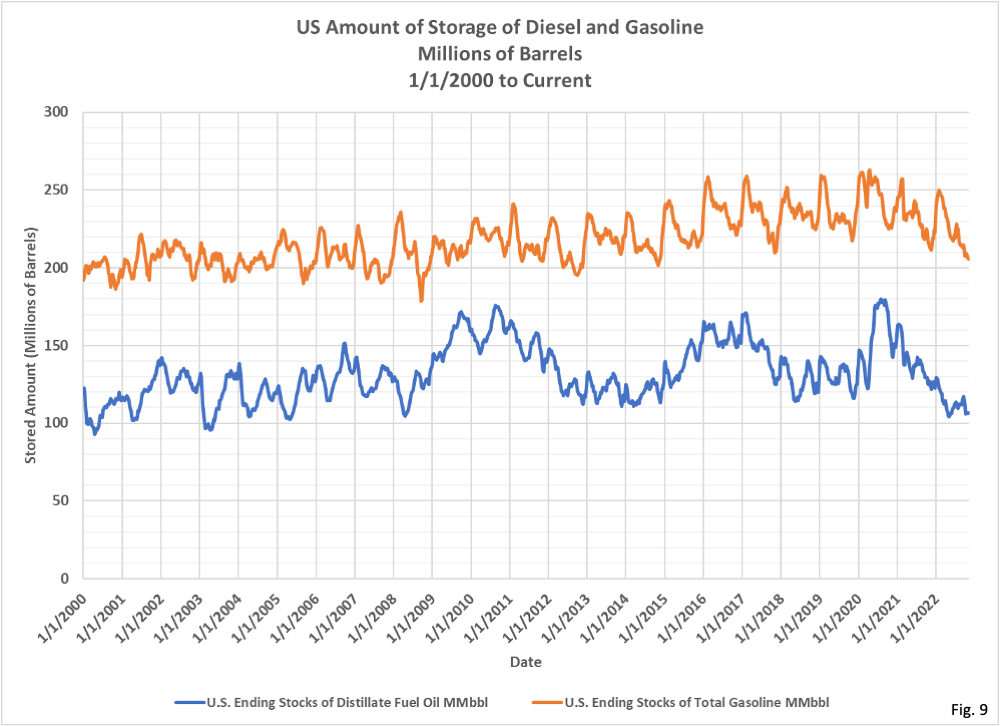
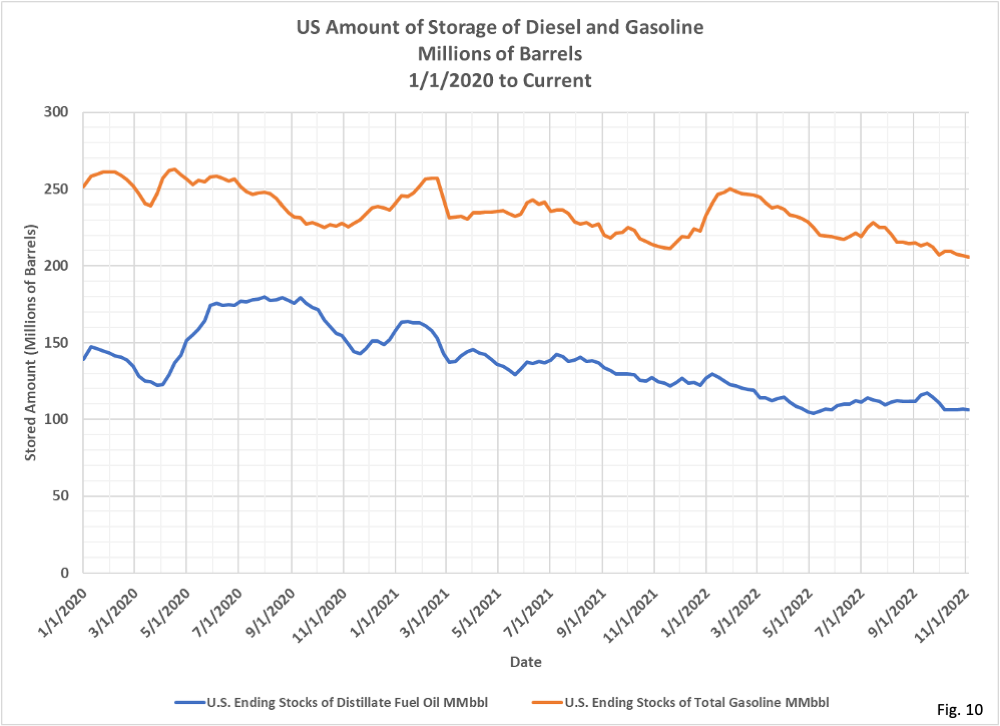
PET_PNP_WPRODRB_DCU_NUS_W.htm . - Fig. 9 and 10, US Storage of Diesel and Gasoline: The amount of diesel fuel in storage is the lowest since late 2014. The amount of gasoline in storage was lower in May 2022 than today, but before that we have to go back to 2005 to find a lower amount in storage. Storage data is available from the EIA here: https://www.eia.gov/dnav/pet/
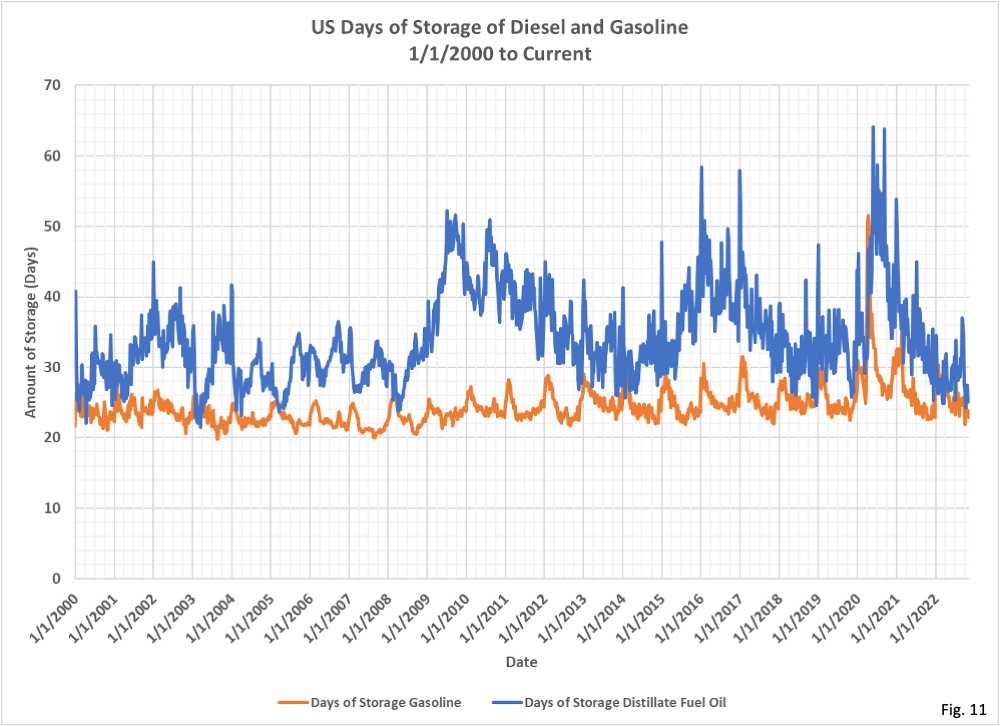
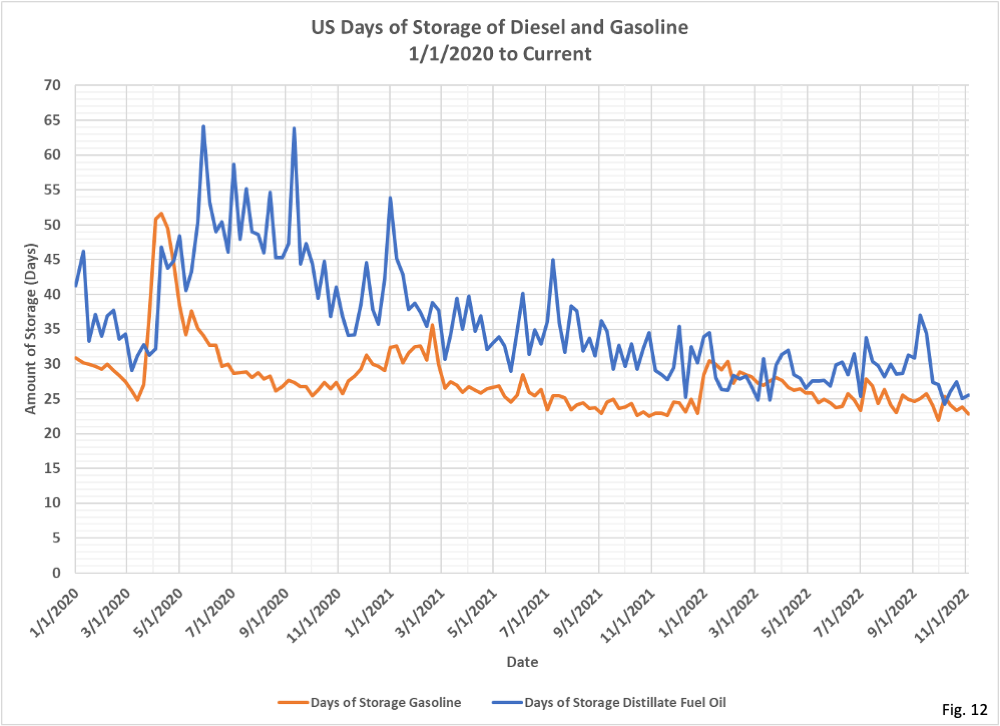
pet_stoc_wstk_dcu_nus_w.htm . - Fig. 11 and 12, US Days of Storage: This chart displays how long it would take to completely drain the existing stored amount of diesel and gasoline, if production ceased completely and demand continued at the current rate. Diesel storage is holding at the 25 days level, as claimed in recent news articles, which was also the case earlier this year as well as in 2013 and 2018, and was even a little lower in the early 2000’s. This level of storage is not unprecedented, but perhaps what is unprecedented is the disruption to the refining and transportation industries, which may make this level of storage problematic when in years past it was not as much of a problem. The days of storage of gasoline is a little lower at 22.8 days, but has been as low as 20 days frequently in the past. The days of storage is calculated by dividing the storage amount from Fig. 9 by the consumption data from Fig. 5.
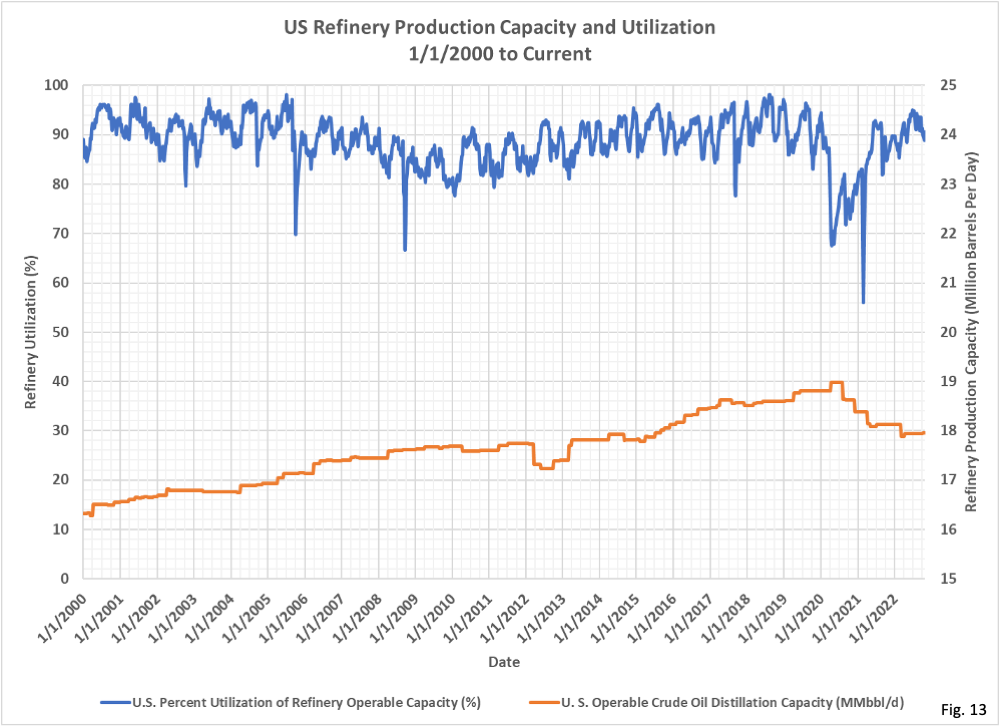
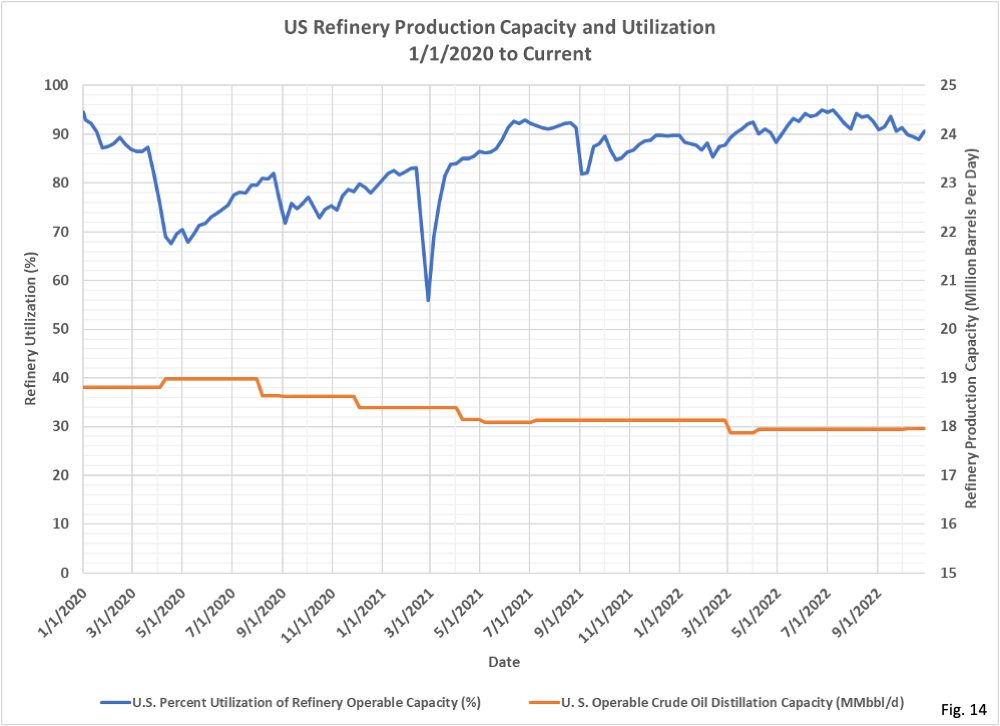
- Fig. 13 and 14, US Refinery Capacity: US refinery capacity after peaking in mid-2020 at 19 million barrels per day has gradually decreased to 18 million barrels per day now, a decrease of 5.3%. Refinery utilization was at 92.1% on 11/4/2022. Utilization has been higher in the past, but it is unknown what the realistic peak operating level of the refineries in service today can achieve. Refining capacity data is available from the EIA here: https://www.eia.gov/dnav/pet/
pet_pnp_wiup_dcu_nus_w.htm . - Overall, it appears that refinery capacity, while lower than in 2020, is probably capable of a couple percent more output. Since consumption is not increasing it seems that low days of storage is due to slightly low refinery utilization. High prices seem to be due to a combination of crude oil costs and reduced refinery capacity. It is unknown from the data available why diesel is so expensive relative to gasoline.
