One thing to note at the start is the usual screwed up data presented by DOH. When their own files don’t reconcile, it doesn’t give you a high level of confidence. The other thing to note is that despite the constant bleating from Little Timmy Walz about hospital capacity, the number of ICU beds and total beds has decreased from the start of the epidemic and we were never in serious jeopardy of running out of beds.
 Dave’s notes:
- We have not posted charts on the topic of hospital bed utilization in Minnesota in a long time, and given chatter in the news about upticks in pediatric hospitalizations due to RSV we should look at the current state of hospital usage. For example, the StarTribune on 10/24/2022 here What’s behind worrying RSV surge in US children’s hospitals? (startribune.com) states “Children’s hospitals in parts of the U.S. are seeing a surge in a common respiratory illness that can cause sever breathing problems for babies.” In addition, hospitalizations of patients with Covid in Minnesota have been relatively constant since May, 2022, despite a gradual decline in cases (see here, for example, on 10/10/2022: https://healthy-skeptic.com/
2022/10/10/year-over-year- charts-october-6/). Finally, on 6/30/2022 the Minnesota Department of Health (MDH) revised their data reporting Given these circumstances we are long overdue in revisiting this topic. - Starting 6/30/2022 MDH reports hospital utilization and capacity in two data files, hcdsource.csv and hcapacity.csv, both available on the hospitalizations and capacity page of the Situation Update for COVID-19 web page https://www.health.state.mn.
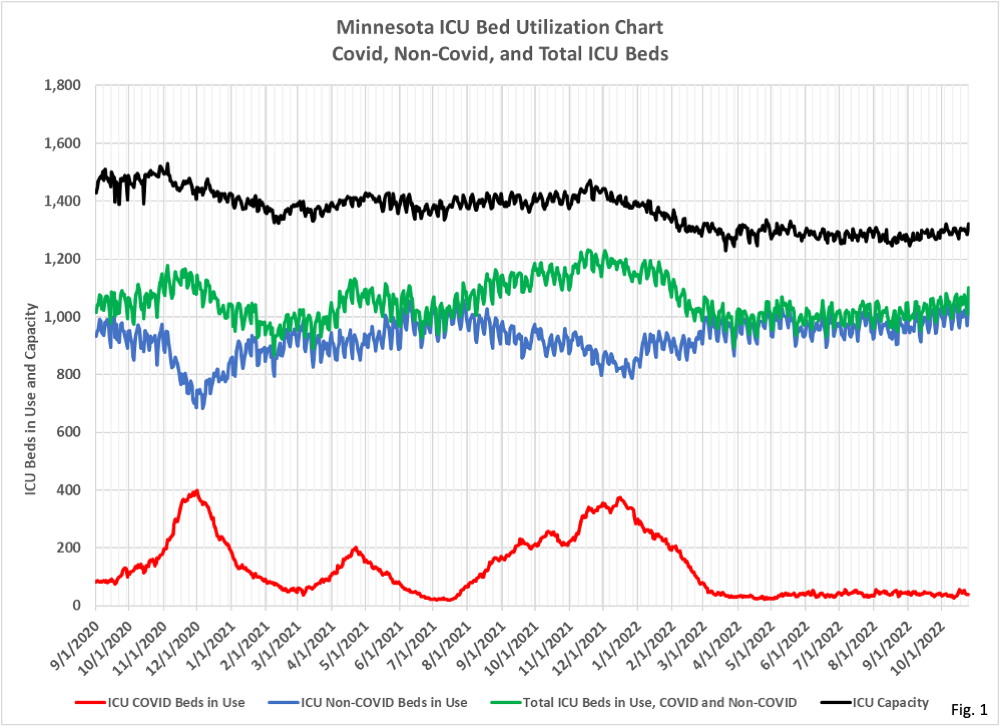
us/diseases/coronavirus/stats/ hosp.html. The file hcdsource.csv contains daily data for the number of beds capacity, occupied, and available, for ICU and Non-ICU categories, for Covid and Non-Covid categories, and for each region of Minnesota statewide totals. The data file “hcapacity.csv” contains daily data for total capacity and beds available for the categories Pediatric Intensive Case, Pediatrics, Adult Intensive Care, and Medical and Surgical, for each region in Minnesota and statewide. We have chosen to consider Medical and Surgical to be effectively Adult Non-ICU. The data in both data files starts on 9/1/2020, after the “14 days to flatten the curve” mantra from our government and medical authorities. Fig. 1 through Fig. 4 are based on hcdsource.csv and the rest are based on hcapacity.csv. - Fig. 1, ICU Bed Capacity and Utilization: This chart displays the daily ICU beds occupied for Covid patients (red curve), non-Covid patients (blue curve), total ICU beds (green curve), and total ICU capacity as reported in hcdsource.csv (black curve). Note that every time Covid hospital beds increase that non-Covid beds decrease, undoubtedly an effect of incidental Covid infections for people admitted for something else, which we have noted several times. It is also interesting to note that total ICU capacity as reported by MDH is lower now than on 9/1/2020, despite any money spent on increasing capacity.
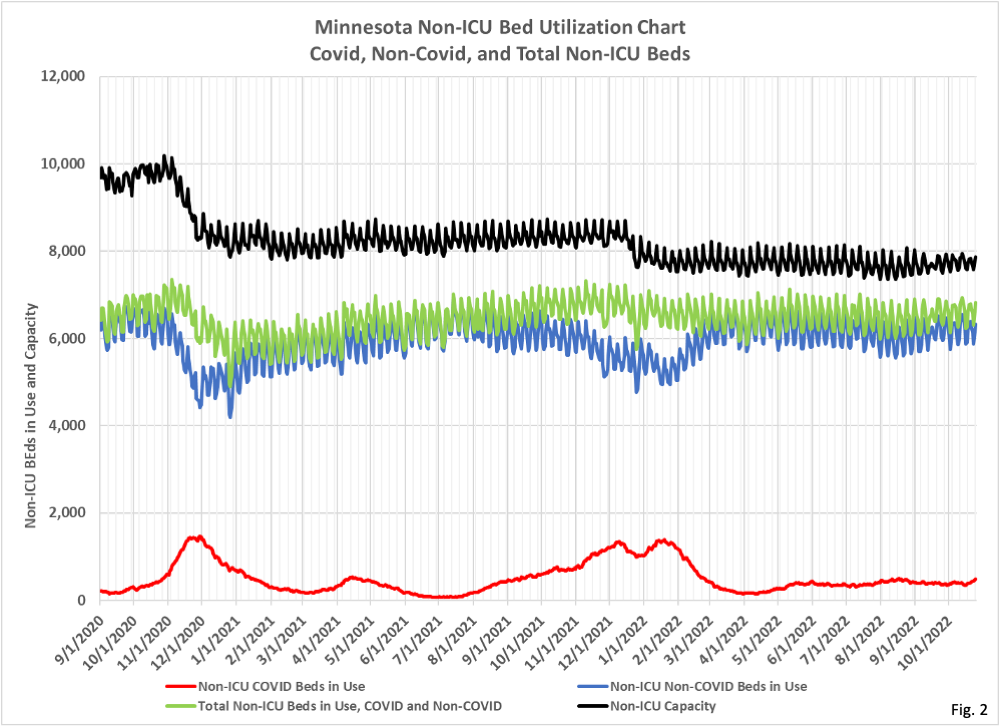
- Fig. 2, Non-ICU Capacity and Utilization: This chart is identical to the ICU chart in Fig. 1, just showing Non-Covid bed utilization and capacity. The general features of this chart are similar to those in Fig. 1. Non-Covid beds drop every time Covid beds surge, and overall capacity is lower now than on 9/1/2020. Note also that total beds in use dropped during the surge in cases and Covid hospitalizations in late 2020 and early 2021. This must have been due to a combination of hospital avoidance by patients, and deferred surgery scheduling by hospitals. This same sort of reduction in overall utilization was not seen during the Omicron surge in late 2021/early 2022.
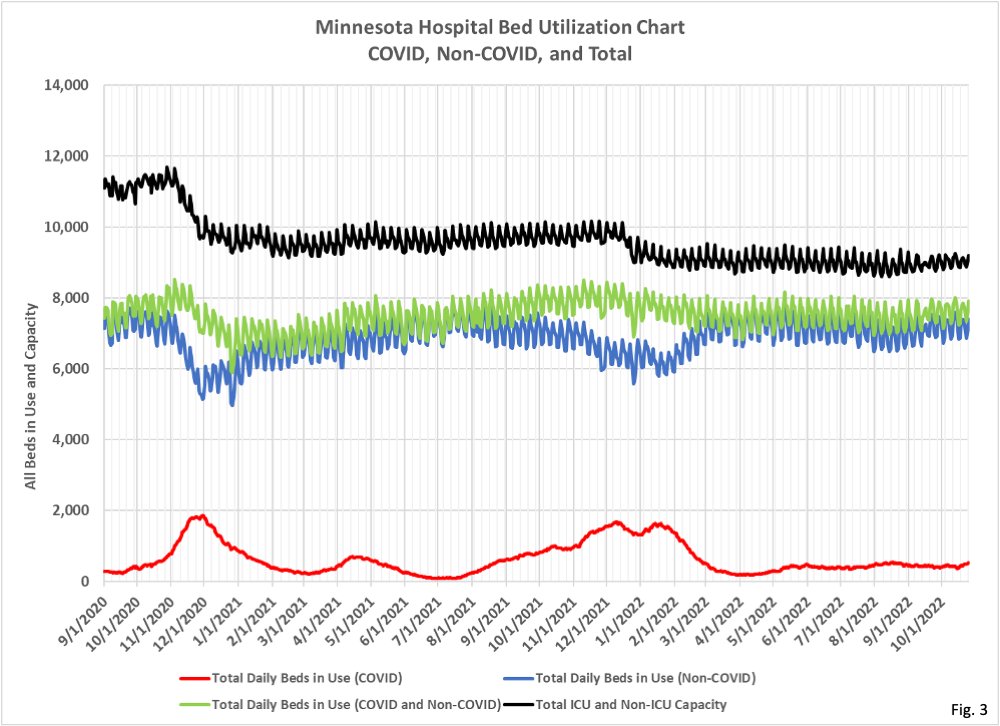
- Fig. 3, Total Capacity and Utilization: This chart displays the totals of the ICU and Non-ICU capacity and utilization data displayed in Figs. 1 and 2. Since the number of Non-ICU beds used and capacity is larger than ICU, this chart largely mirrors the Non-ICU chart in Fig. 2.
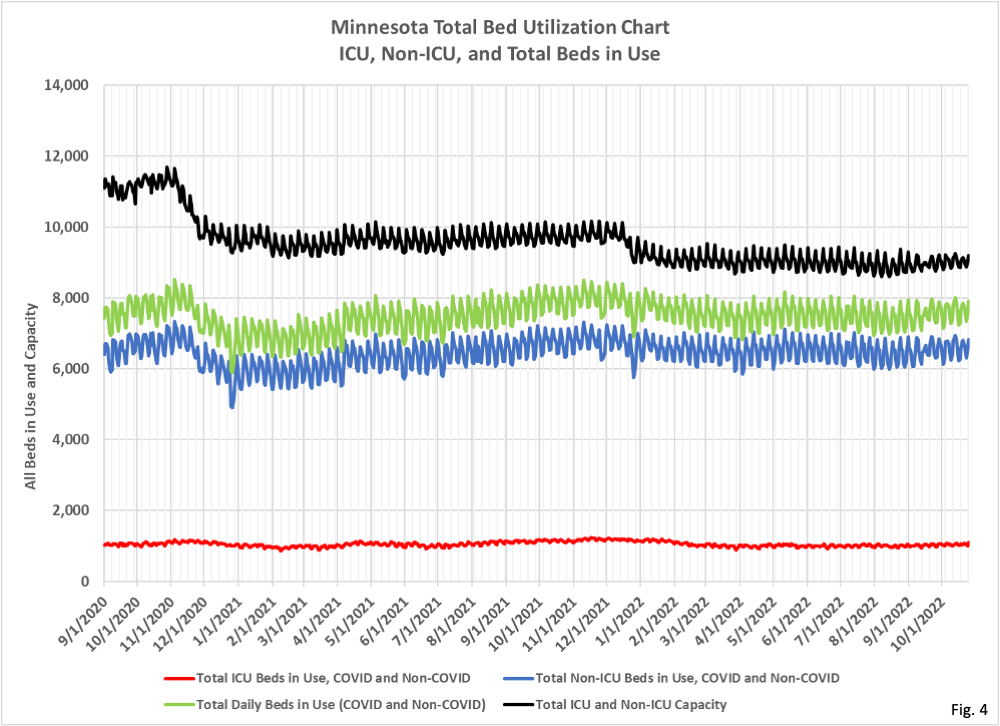
- Fig. 4, Total Capacity and Utilization for ICU and Non-ICU: This chart displays much of the same information as the first three charts, except that this time we are lumping Covid and Non-Covid beds together. The total ICU beds in use (red curve) is remarkably stable despite whatever surge in Covid cases and admissions was occurring at any time. This tells us that Covid admissions had a relatively small impact on ICU bed utilization. Non-ICU beds in use (blue curve) however did drop during the late 2020/early 2021 surge in cases (instead of rising as one might have expected) and were relatively constant throughout the second half of 2021 and 2022. Again, not a lot of visual evidence that Non-ICU beds in use were hugely affected by any of the surges in Covid cases.
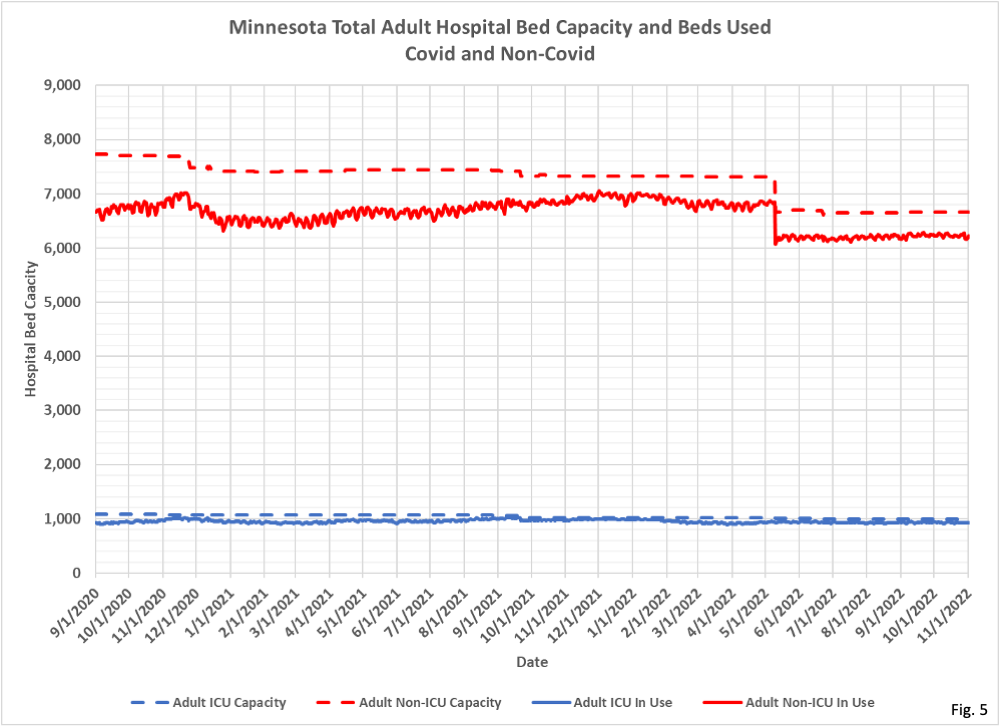
- Fig. 5, Adult Capacity and Beds Used: This is the first chart based on the data file hcapacity.csv. We are given adult ICU and adult Non-ICU beds in use and capacity. One feature that stands out is the large drop in Non-ICU capacity on 5/9/2022 and also the large drop in Non-ICU beds in use. This makes no sense and must be some sort of data or reporting error. We also note that the adult ICU beds in use are always very nearly equal to adult ICU beds capacity. Finally, we should note that the total beds used, based on adding adult and pediatric beds in use and beds capacity, does not match the beds in use and capacities from the data file hcdsource.csv that formed the basis of Fig. 1 through Fig. 4. It is not clear which of the two data files is considered to be more authoritative.
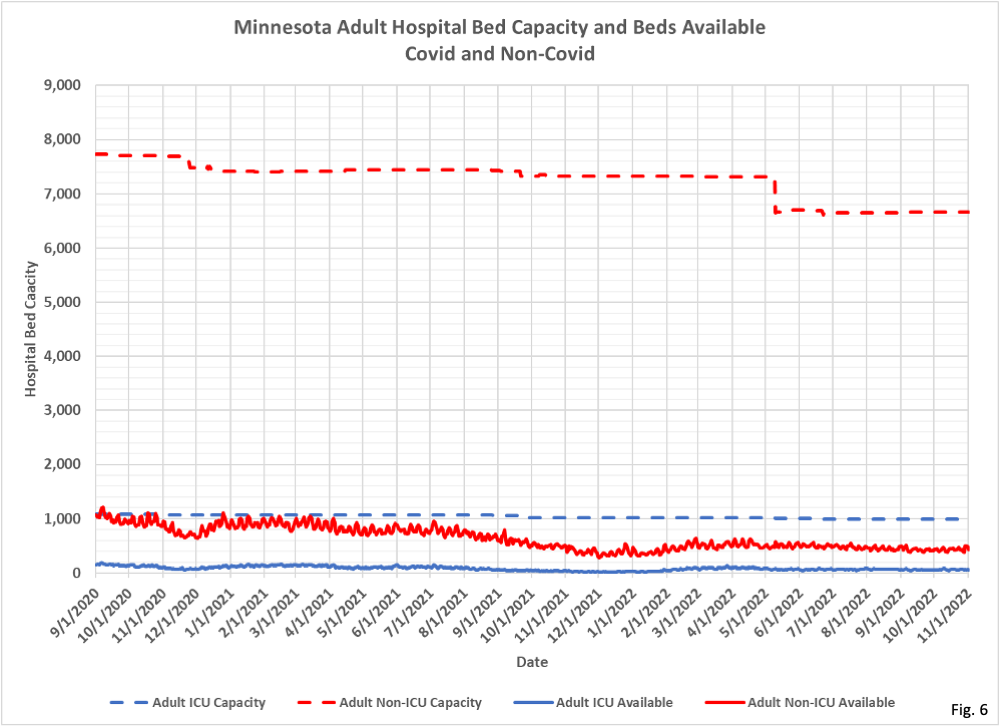
- Fig. 6, Adult Capacity and Beds Available: This chart is based on Fig. 5, just displaying the adult ICU and adult Non-ICU beds available, instead of beds used as in Fig. 5.
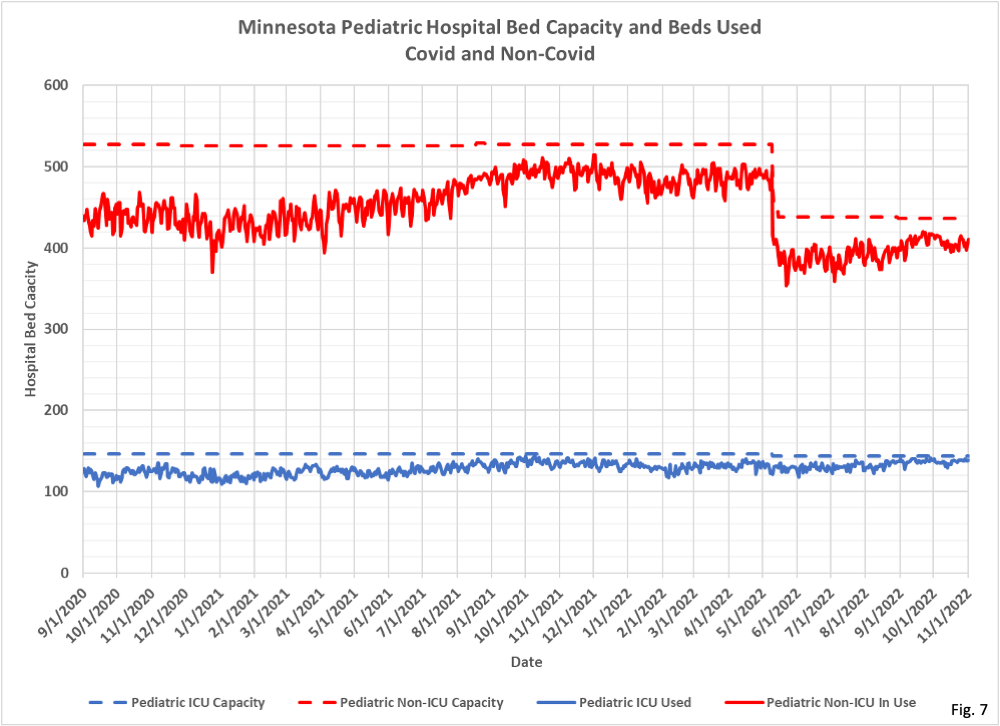
- Fig. 7, Pediatric Capacity and Beds Used: This chart displays the pediatric ICU and pediatric Non-ICU beds in use and capacity. Similar to adult Non-ICU capacity in Fig. 5, we see a large drop in capacity and beds in use on 5/9/2022. ICU beds in use is clearly closer to the stated capacity now than in late 2020.
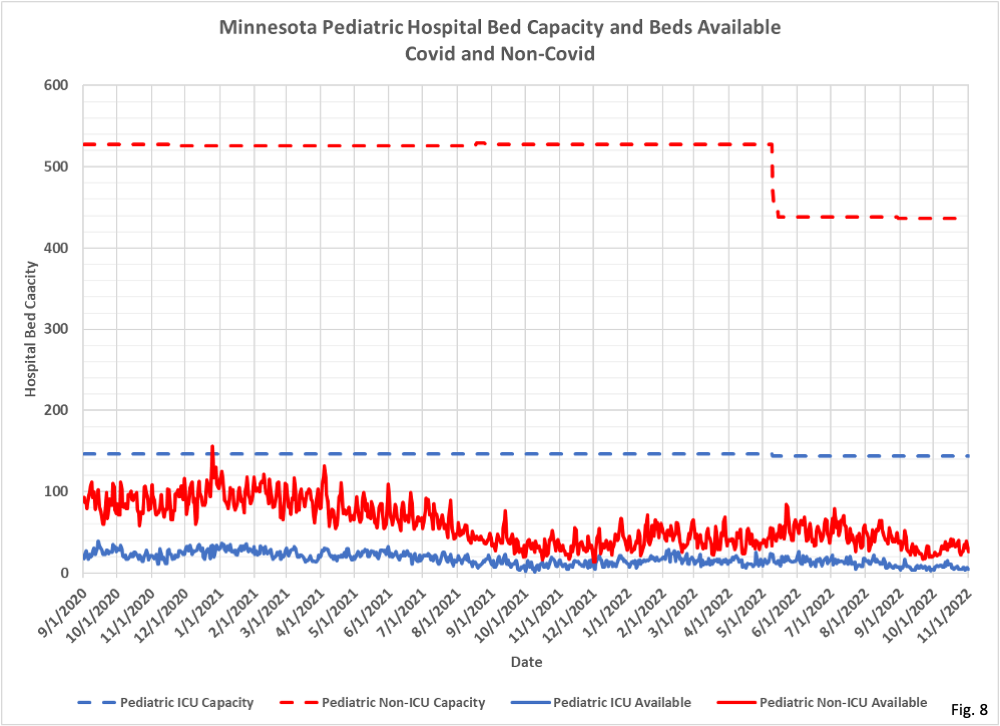
- Fig. 8, Pediatric Capacity and Beds Available: This chart is the same as Fig. 7, except displaying pediatric beds available and capacity. Both ICU and Non-ICU beds available have been decreasing since 2020, while capacity has also been decreasing.
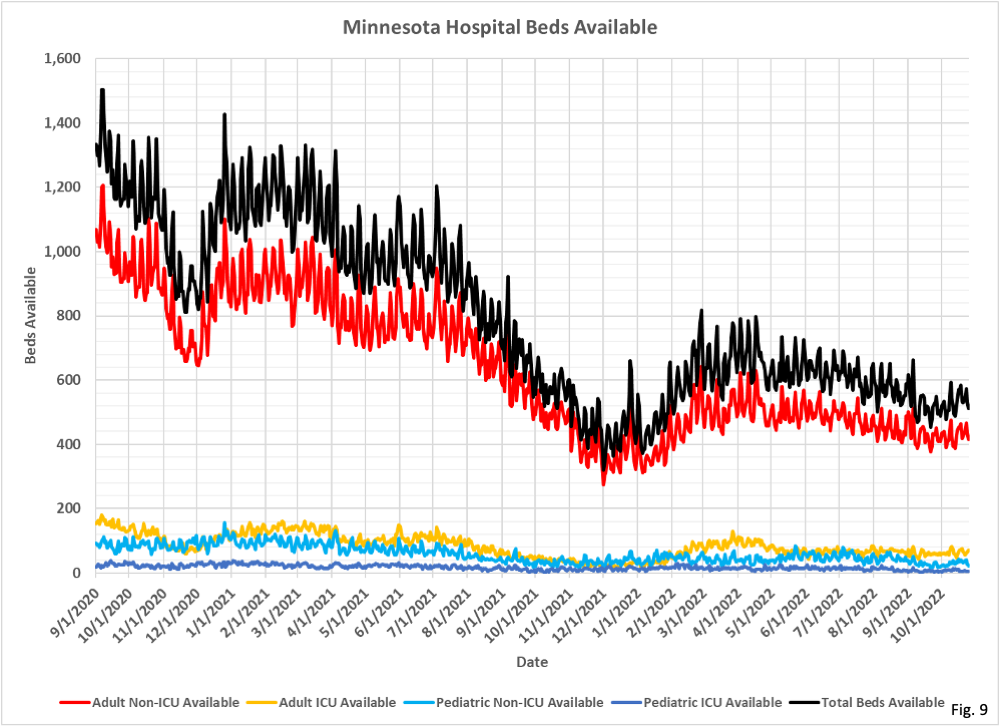
- Fig. 9, Total Hospital Beds Available: This chart displays the number of beds available in each of the four categories, ICU and Non-ICU beds, adult and pediatric, as well as the overall total. The total reported beds available was lowest in December 2021 before rising again until March 2022. While beds available have decreased in recent months, the beds available now are still higher than the December 2021 lows. In addition, as we noted, the beds used and beds capacity reported in the two different data files do not agree, so it is difficult to make any strong assertions about the current state of Minnesota hospital capacity and availability.

Remember when they told us they’d use those first two weeks to increase hospital capacity? I was extremely skeptical and critical of their (Walz, et al.) actions from the start, but the level of dishonesty they delivered far exceeded my expectations. The only thing more surprising to me than the habitual dishonesty is the will of so many people to believe. I’d wager money that your average Star Tribune reader believes DPRMn ran out of hospital beds at some point and that Tim Walz increased hospital capacity.
It looks to me like facilities stopped staffing non-ICU beds around May of 2021, as well as some ICU beds months earlier