Like health care, energy is a very large and complex part of the US economy. Using false climate alarmist, extreme environmentalists have partnered with cynical investors to attempt to remake the US electricity generation industry. The investors get rich on subsidies, while consumers pay more and more for less reliable electricity generation, coupled with significant environmental harms, like killing millions of birds, disrupting normal wind flow patterns, use of hazardous substances, etc. Dave Dixon is extremely familiar with the industry, having worked in it for years, and has embarked on a project to help understand where we are and the dangers ahead. In my opinion, we are creating a world with far more expensive electricity while creating a risk of blackouts and doing nothing to reduce overall environmental impact.
 Dave’s notes:
- Minnesota’s Climate Action Framework (https://climate.state.mn.us/
sites/climate-action/files/ Climate%20Action%20Framework. pdf) is the current administration’s climate and energy policy. Much of this policy consists of platitudes and generalizations, however Goal 4: Clean Energy and Efficient Buildings, does lay out several specific goals. The vision statement on Page 49 is that “Minnesotans have reliable, clean, and lower-cost energy through equitable investments in energy efficiency, clean energy, and low-carbon technology…”. Page 50 of this document displays a graphic showing the goals for Minnesota’s electrical generation in the coming years. By 2034, only 12 years from now, the goal is to have 45% of Minnesota’s electricity come from wind, 10% from solar, 6% hydroelectric, 15% nuclear, 7% natural gas, and 15% coal. By 2040 the goal is to have 100% of Minnesota’s electricity come from carbon free sources, and in addition 55% is to come from renewable sources. - We have discussed a paper by the Center for the American Experiment here, https://healthy-skeptic.com/
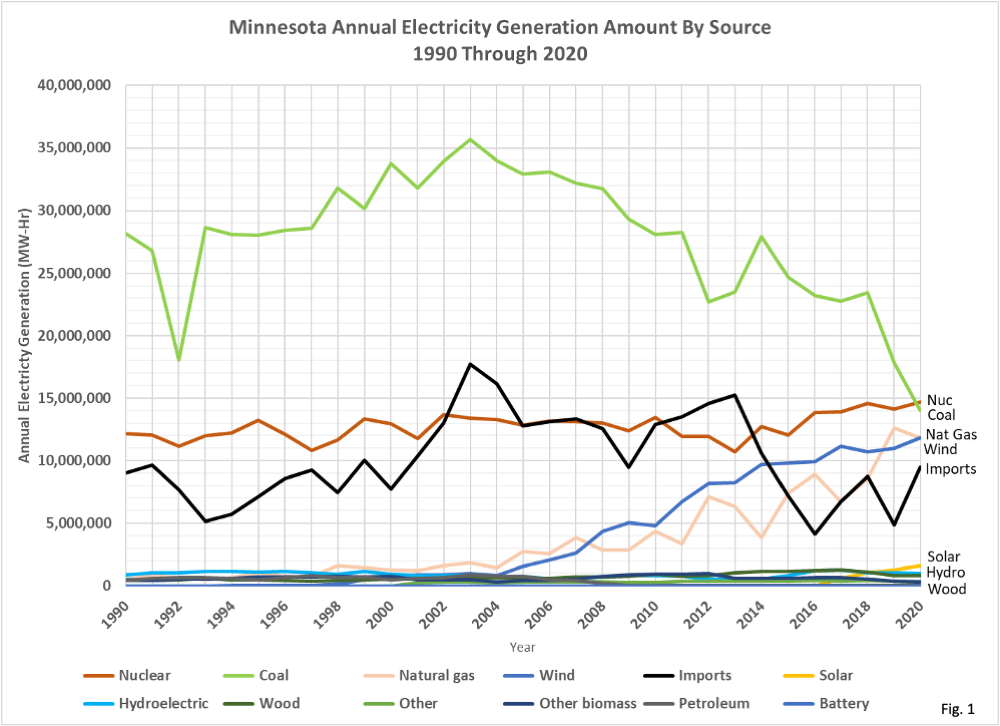
2022/09/15/a-sensible-report- on-energy-production/, which points out the many costs and problems associated with getting to a “carbon-free” electrical supply in Minnesota. In today’s charts we will display Minnesota’s long term trend in energy production, and some of the variability that occurs on a month to month basis. - Fig. 1: Minnesota’s actual annual amounts of electrical generation by source. The U.S. Energy Information Administration (EIA) publishes annual summaries of electrical data for each state, covering the years 1990 through 2020. Minnesota’s summary is available here: https://www.eia.gov/
electricity/state/Minnesota/ state_tables.php. Table 5 of this data base contains the annual electrical production in Minnesota by source for each year. Table 10 contains the source and disposition of total electrical power, including the net amount imported from Canada or from other states. Note that the amount of power generated from coal has been declining fairly steadily since peaking in 2003. Minnesota’s three remaining coal power plants are all scheduled for closure by 2035 (Sherco by 2030, https://energycentral.com/ news/shercos-third-coal-plant- close-2030-some-worry-about- transition; Boswell converted to natural gas by 2035, https://www.startribune.com/ minnesota-power-shutting- converting-final-two-coal- plants-by-2035/600009603/, and Allen King operated part time and shut down completely by 2028, https://www.stcroix360.com/ 2020/08/xcel-energy-will-shut- down-king-plant-six-months- each-year/). - Note also in Fig. 1 the curve shown for imports, which in 2020 was the fifth largest source of electricity in Minnesota. Details of the source of these imports are unavailable, but we do know that Minnesota gets a large amount of electricity from coal power plants in North Dakota, as well as hydroelectric power from Canada. The future of North Dakota’s coal power plants is unclear. Here in rural Stearns County our power comes from Great River Energy, which in turn gets 58% of its power from the Coal Creek plant in western North Dakota. This plant has been under pressure for years, like all coal plants in the US, but it appears that it will keep operating for the time being: https://www.kfyrtv.com/2021/
06/30/buyer-announced-coal- creek-power-station/. If so, then while Minnesota might not generate electricity from coal after 2035, we will still consume electricity derived from coal, at least as things stand now. - Finally, note in Fig. 1 that wind and natural gas have gradually increased over the years to offset the decline in coal power. Nuclear power has been fairly constant, as expected since there has not been any change in the number of nuclear power plants in Minnesota. Solar and hydroelectric are basically lost in the noise along with all the other minor sources of electrical power.
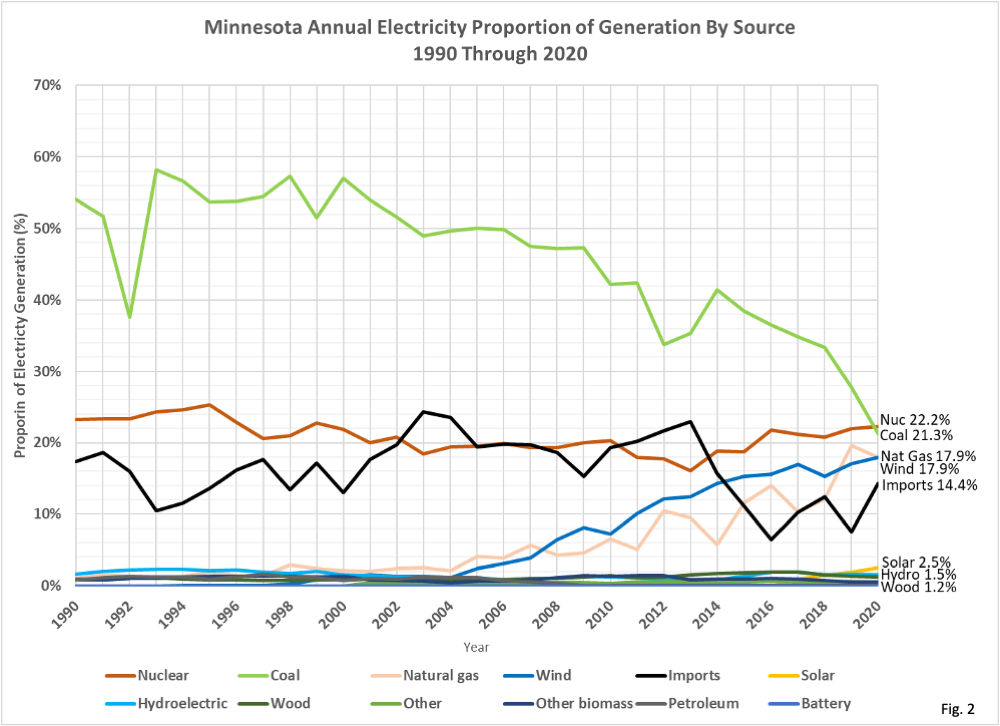
- Fig. 2: Minnesota’s actual electrical production expressed as an annual percentage. Here we can see that coal provided 21.3% of Minnesota’s electrical power in 2020, and natural gas provided 17.9%, for a combined 39.2%. Not counting imported power from coal, this 39.2% would have to be replaced by wind, solar, or other carbon free sources of electricity by 2040 under the Climate Action Framework.
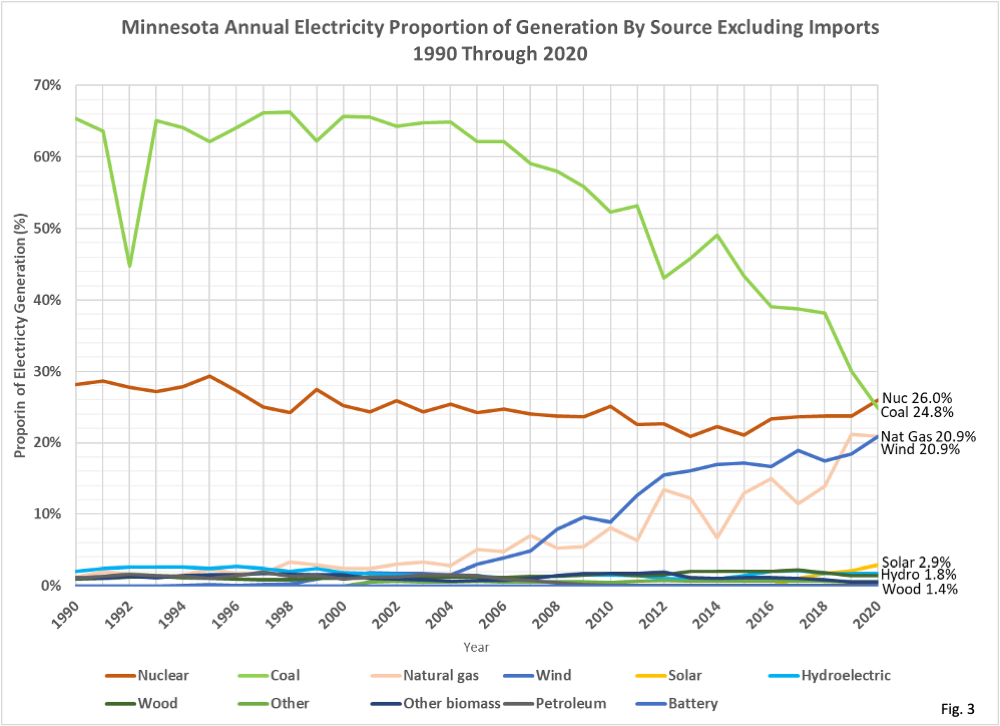
- Fig. 3: Minnesota’s actual electrical production expressed as a percentage, and excluding imported power. When excluding the amount of power that Minnesota imports, the proportion of power accounted for by domestic coal and natural gas rises to 24.8% and 20.9% respectively.
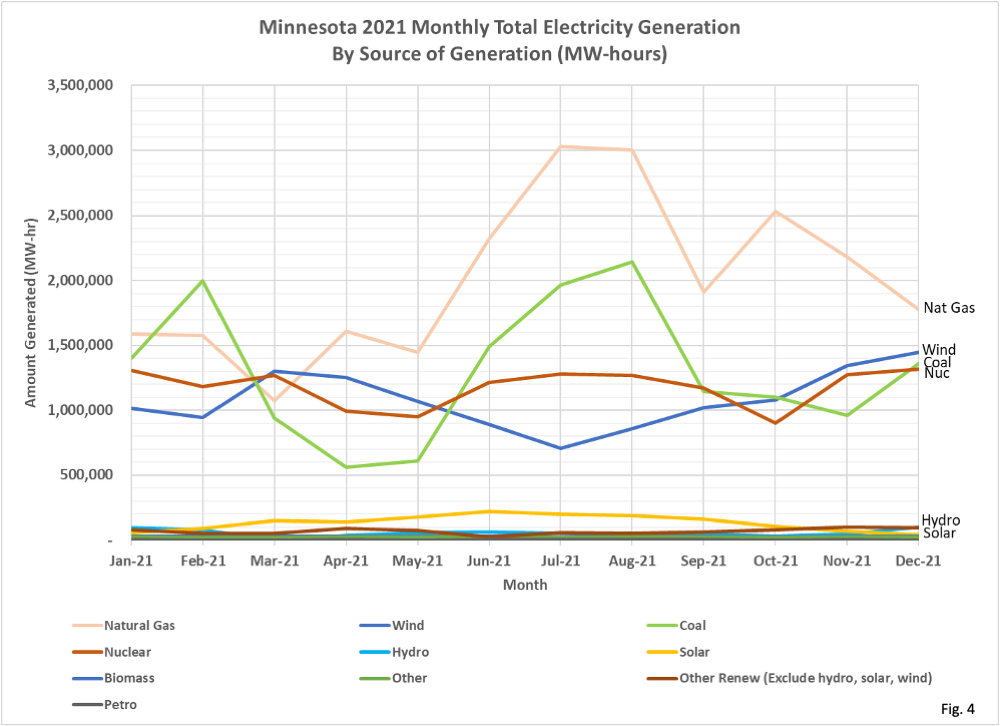
- Fig. 4: Minnesota’s monthly electrical power production in 2021. Monthly electrical data is obtained from the EIA’s Electric Data Browser, https://www.eia.gov/
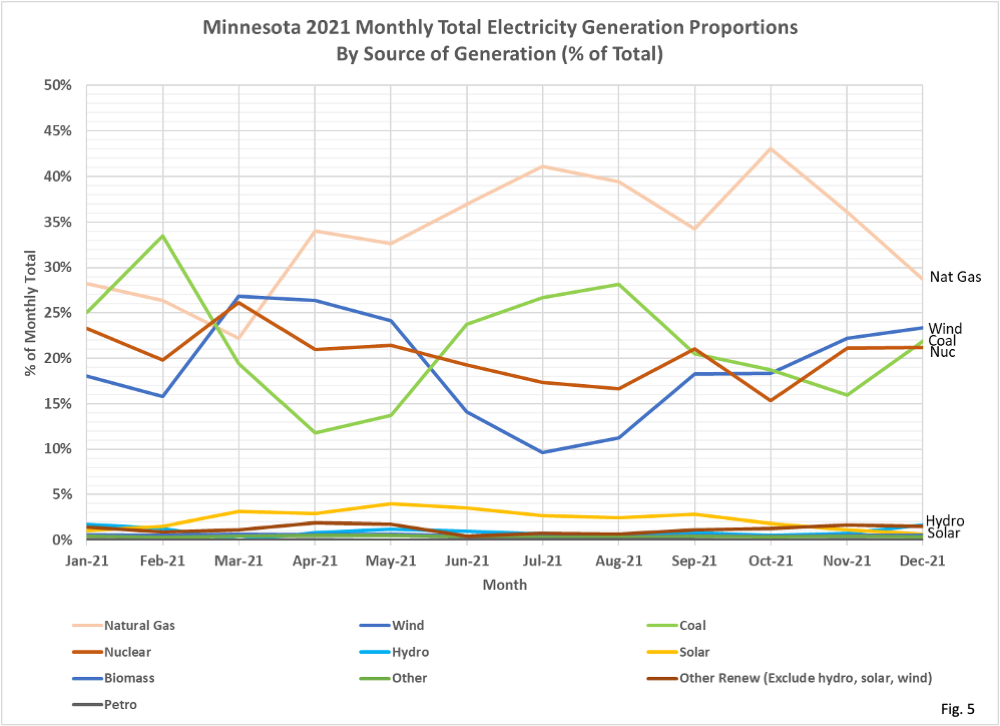
electricity/data/browser/. This monthly data highlights the variability of demand and supply throughout the year. Power from coal and natural gas both are high in July and August, when wind power is at its lowest. Solar is highest in June, but there is not enough solar in Minnesota currently to be considered a significant source of power. The challenge then in being carbon free is not only to build out enough wind and solar plants to meet the annual average, we need to also consider the peak monthly power requirements. If we could obtain this type of data on a daily basis for Minnesota, we would surely see even more extremes in supply and demand of electrical power. Note that this chart excludes the amount of electrical power imported into Minnesota. - Fig. 5: Minnesota’s monthly electric power production in 2021, proportion of total. This chart makes it very evident that wind power varies greatly from month to month, with the highest proportion being 26.8% in March 2021 and the lowest 9.6% in July 2021.
- In summary, in 2021 Minnesota is still highly reliant on coal and natural gas electrical power. Eliminating coal based power by 2035 will make power from natural gas much more critical. Natural gas, while having the advantage of being able to dispatched on short notice if needed to make up for a drop in wind power, is also subject to a lot more price variability than coal based power. In addition, if reserves of natural gas power are not established to back up the planned expansion of wind power in Minnesota, then shortfalls will be inevitable.
