 Dave’s notes:
- These age structure charts display the number of Covid cases, ICU hospital admissions, non-ICU hospital admissions, and deaths in Minnesota each week, sorted by age group. These are an update of last week’s charts published here on 9/13/2022: https://healthy-skeptic.com/
2022/09/13/age-structure- charts-september-10-raw- numbers/. - The data for the charts on cases comes from the data file “cage.csv”, Case Rate by Age Group, published by the Minnesota Department of Health (MDH) here: https://www.health.state.mn.
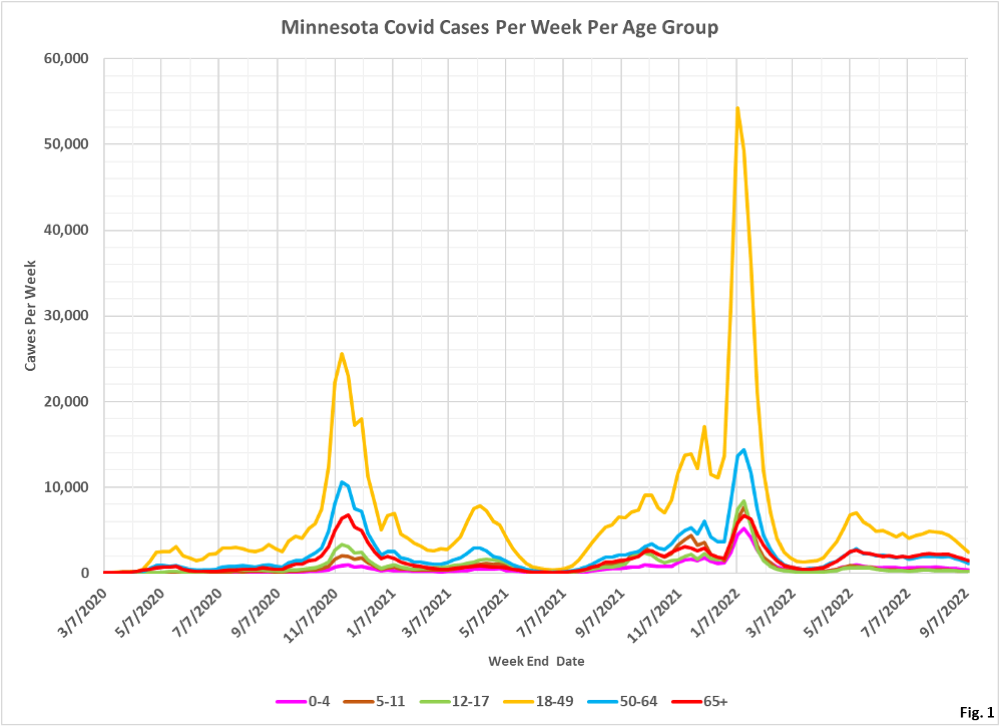
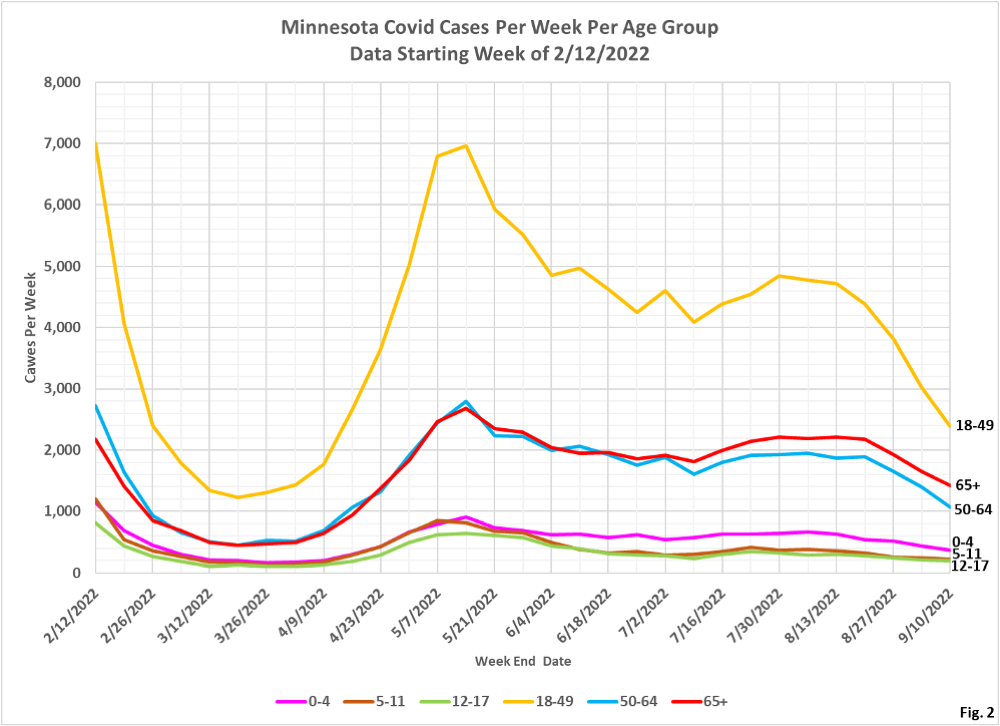
us/diseases/coronavirus/stats/ case.html. The link to the data file is located in the notes under the graphic “Case Rate by Age Group”. Similarly, the data for hospital admissions is taken from the data file “hage.csv”, Hospitalization Rate by Age Group available here: https://www.health.state.mn. us/diseases/coronavirus/stats/ hosp.html . The data in this data file is plotted without modification except that we are taking the difference between total hospital admissions and ICU admissions in order to display non-ICU admissions. Finally, the data for deaths is taken from the data file “dage.csv”, Mortality Rate by Age Group, available here” https://www.health.state.mn. us/diseases/coronavirus/stats/ death.html. - Fig. 1 and 2: Covid Cases Per Week. The reported Covid cases for the week ending 9/10/2022 continue the declining trend in all age groups. While at-home tests are not included in this data, it appears that the number of overall cases in Minnesota is finally dropping from the overall consistent levels seen most of the summer.
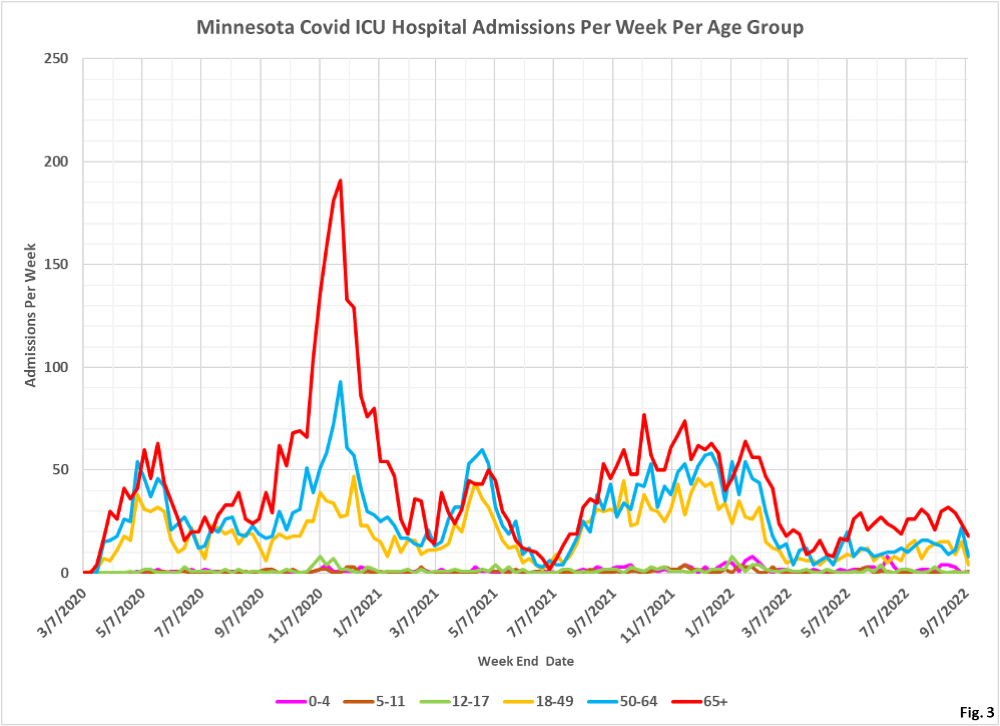
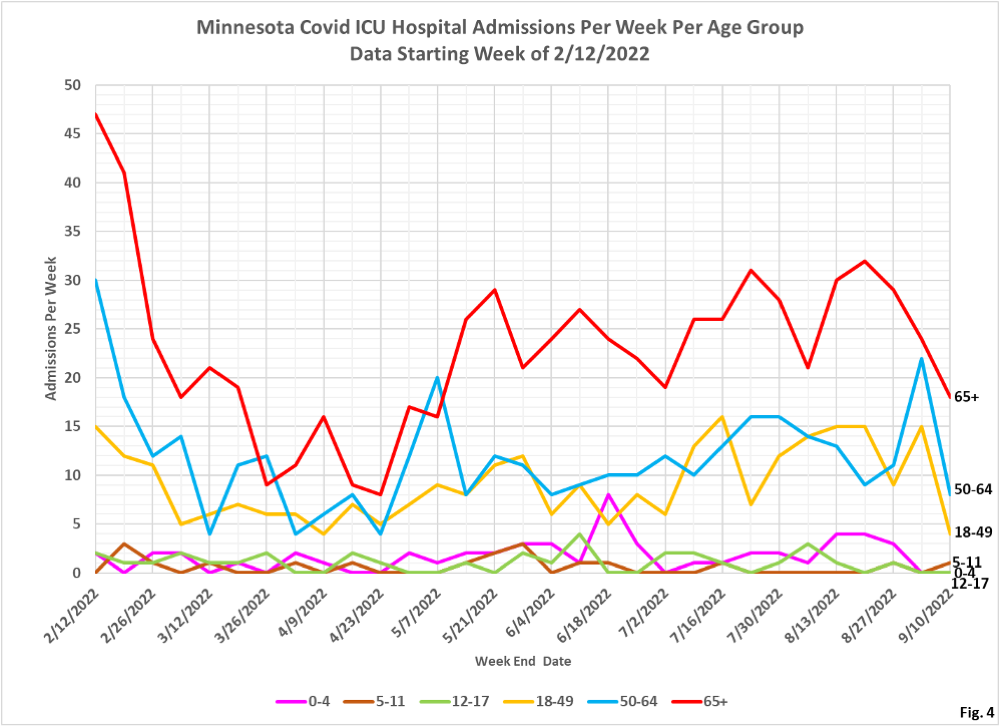
- Fig. 3 and 4: ICU Covid Admissions Per Week. ICU admissions for the week ending 9/10/2022 are dramatically lower in all age groups, but note that there have been significant revisions to the data we published last week. For example, last week the 50-64 was reported to have 13 admissions for the week of 9/03/2022. Now there are reported to have been 22 admissions for the 50-64 age group for the week of 9/03/2022.
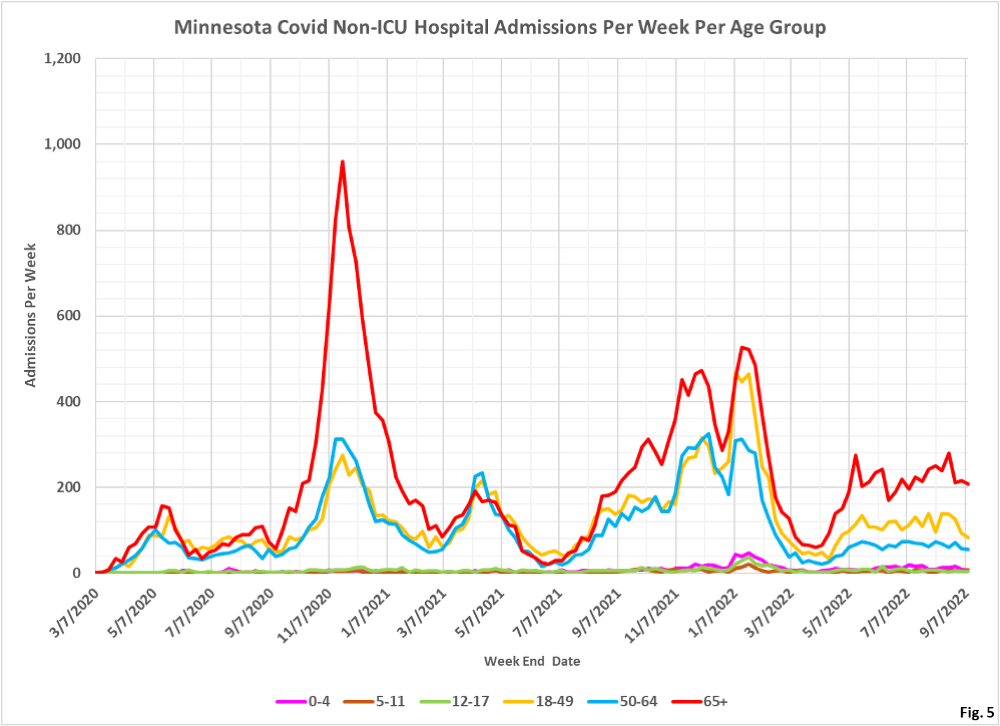
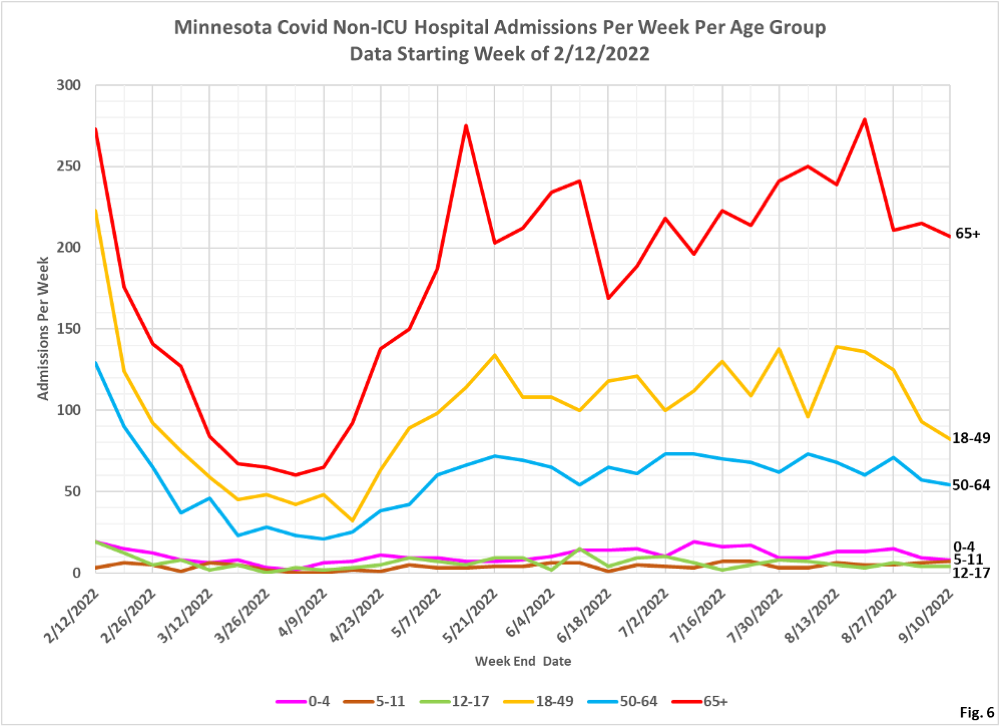
- Fig. 5 and 6: Non-ICU Covid Admissions Per Week. Non-ICU admissions for all age groups were somewhat lower for the week of 9/10/2022. The 65+ age group continues to have somewhat elevated admissions, but we do not know after all this time what the level of incidental Covid admissions are.
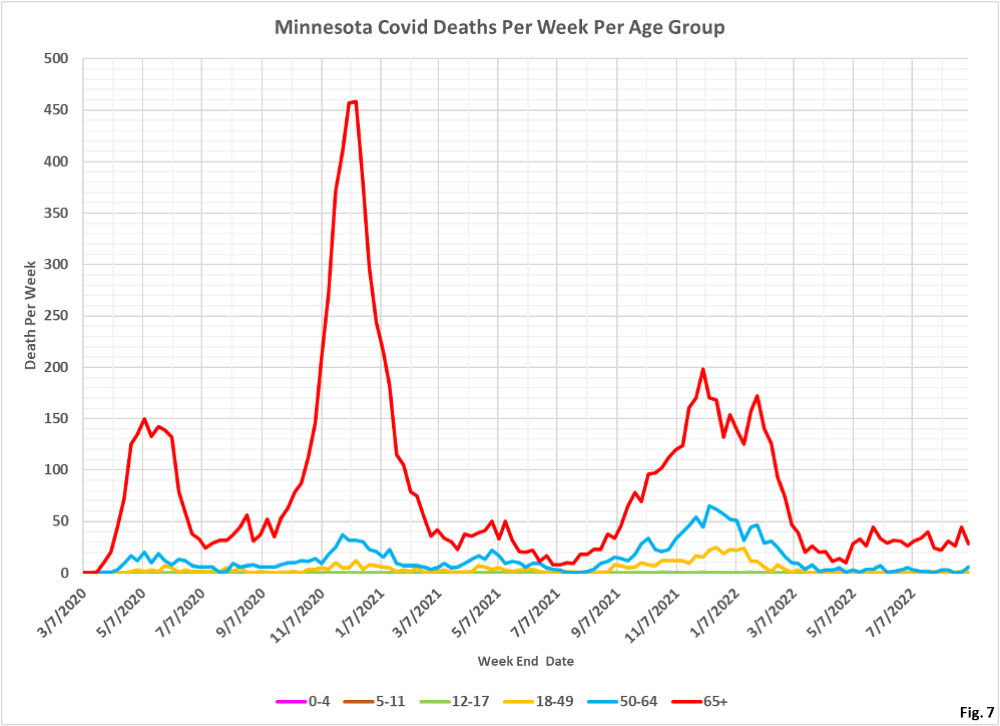
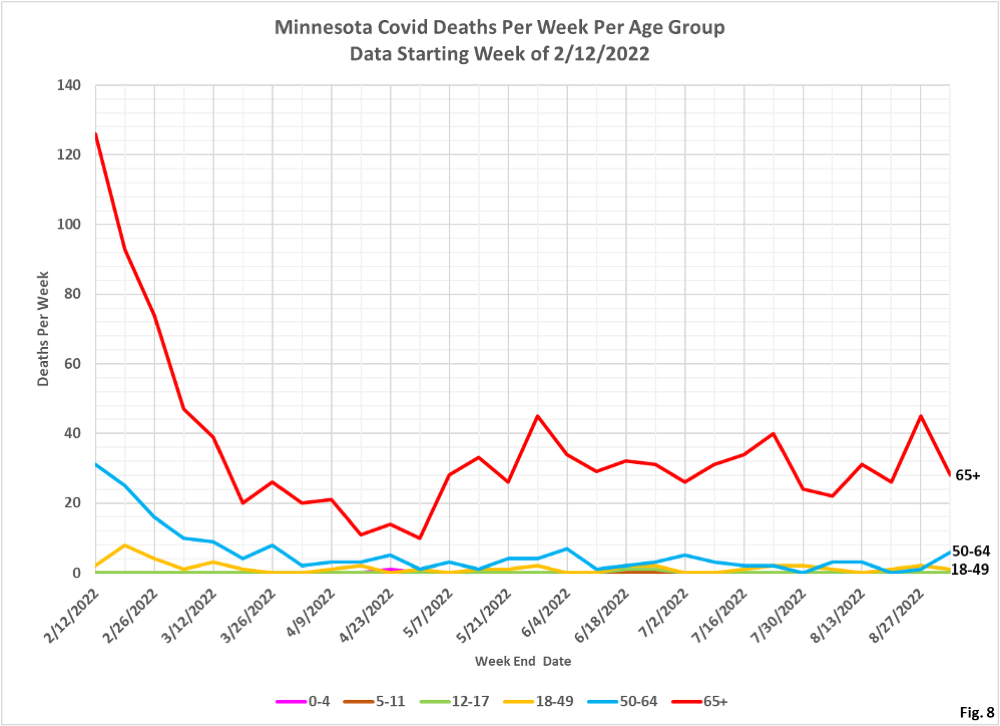
- Fig. 7 and 8: Covid Deaths Per Week. The last week of data is not displayed due to lags in reporting deaths. For the week of 9/03/2022 deaths in the 65+ and 50-64 age groups were generally within the range seen in recent months.
