
 Dave’s notes:
Notes:
- These age structure charts display the number of Covid cases, ICU hospital admissions, non-ICU hospital admissions, and deaths in Minnesota each week, sorted by age group. These are an update of last week’s charts published here on 9/04/2022: https://healthy-skeptic.com/2022/09/04/age-structure-charts-september-1-raw-numbers/.
- The data for the charts on cases comes from the data file “cage.csv”, Case Rate by Age Group, published by the Minnesota Department of Health (MDH) here: https://www.health.state.mn.us/diseases/coronavirus/stats/case.html. The link to the data file is located in the notes under the graphic “Case Rate by Age Group”. Similarly, the data for hospital admissions is taken from the data file “hage.csv”, Hospitalization Rate by Age Group available here: https://www.health.state.mn.us/diseases/coronavirus/stats/hosp.html . The data in this data file is plotted without modification except that we are taking the difference between total hospital admissions and ICU admissions in order to display non-ICU admissions. Finally, the data for deaths is taken from the data file “dage.csv”, Mortality Rate by Age Group, available here” https://www.health.state.mn.us/diseases/coronavirus/stats/death.html.
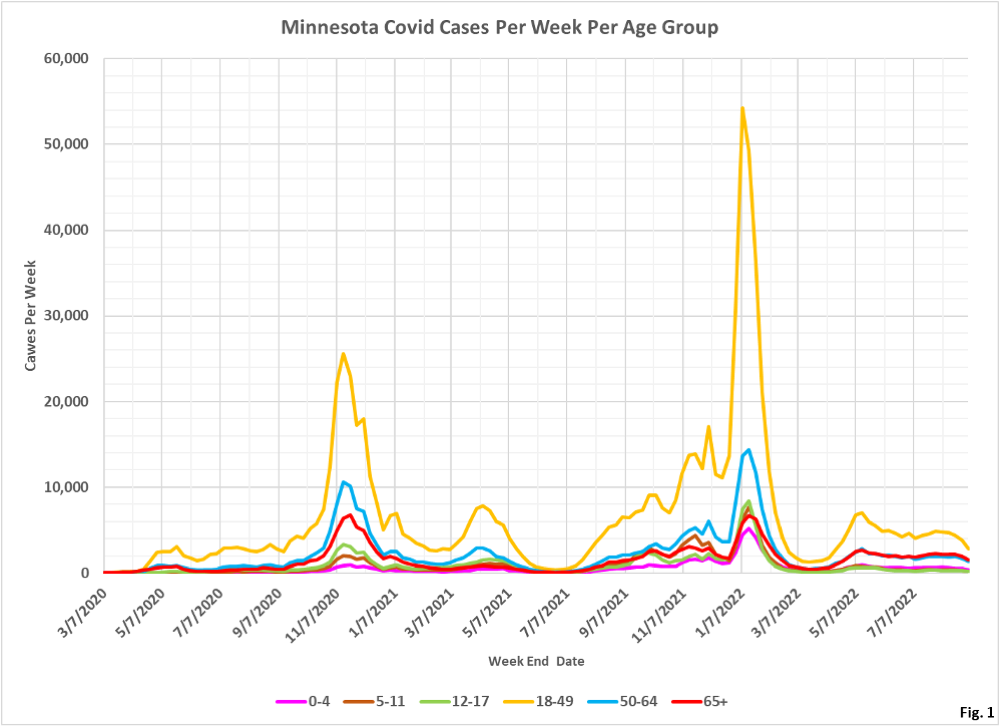
- Fig. 1 and 2: Covid Cases Per Week. The reported Covid cases for the week ending 9/03/2022 continue the declining trend in all age groups. It is possible that the most recent data point has incomplete reporting due to the Labor Day holiday.
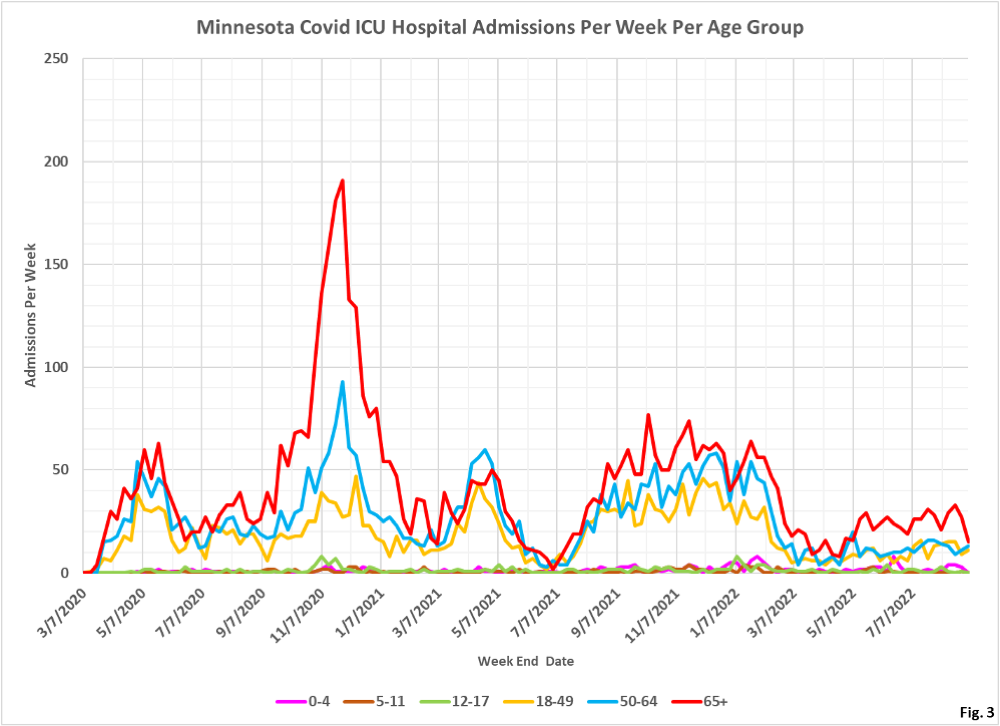
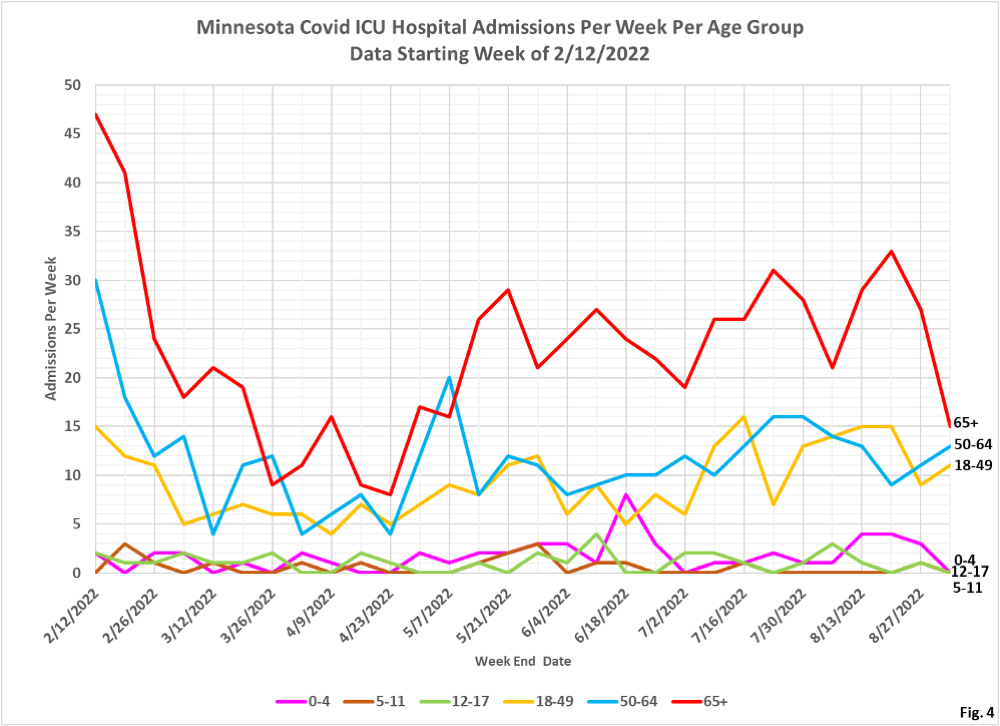
- Fig. 3 and 4: ICU Covid Admissions Per Week. ICU admissions for the week ending 9/03/2022 are dramatically lower in the 65+ age group, while the 18-49 and 50-64 age groups rose slightly. The lower age groups were all at zero admissions for the week.
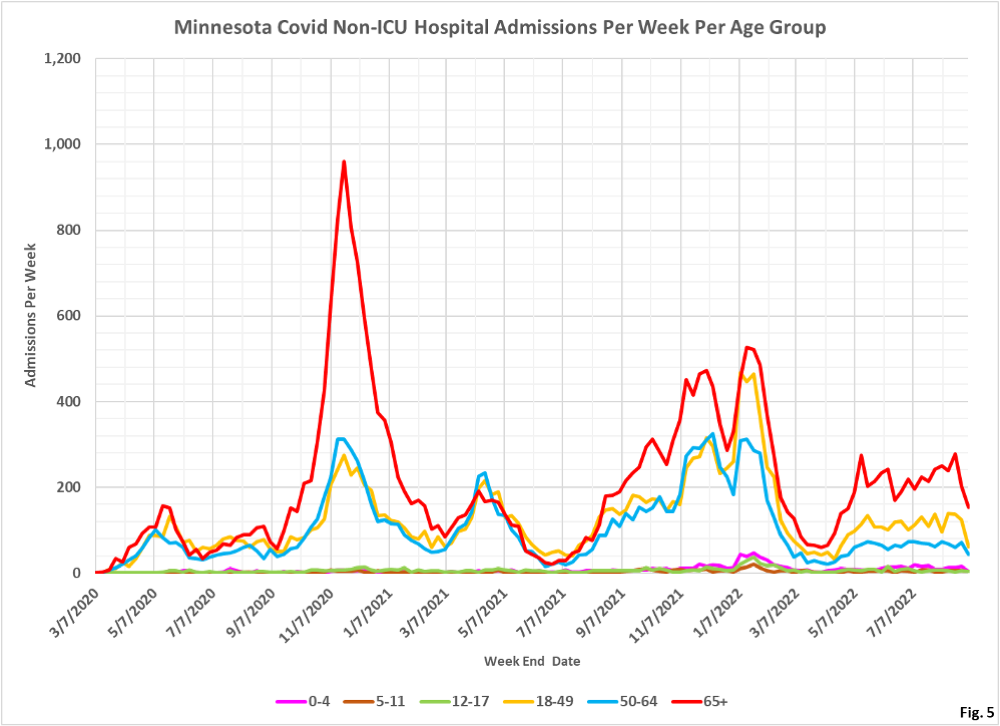
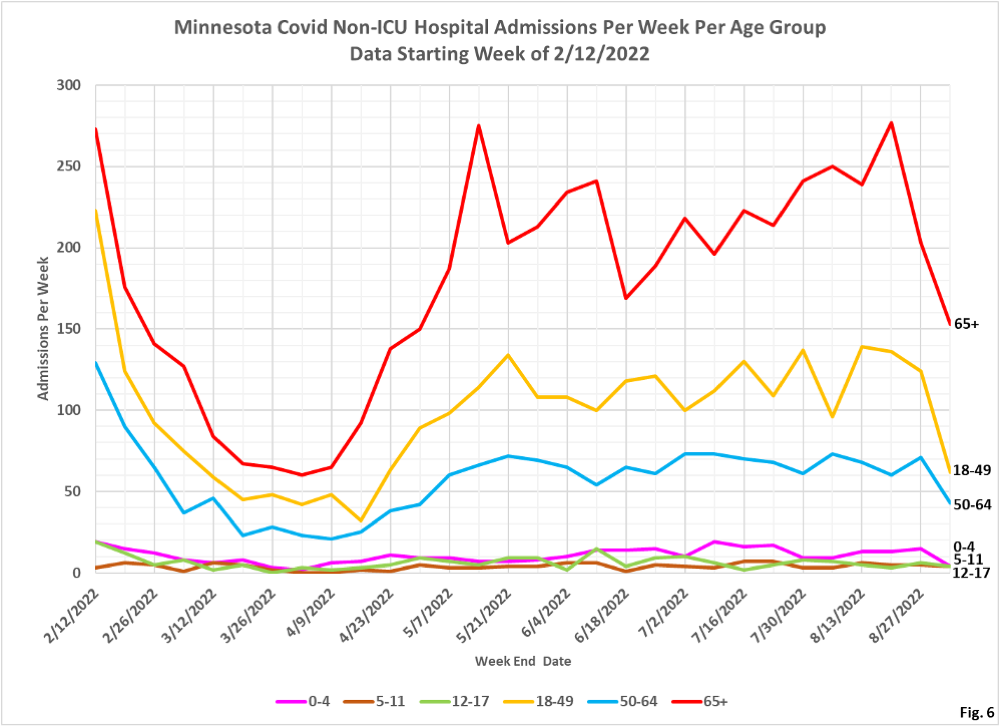
- Fig. 5 and 6: Non-ICU Covid Admissions Per Week. Non-ICU admissions for all age groups were sharply lower for the week of 9/03/2022. The 18-49, 50-64, and 65+ were all at the lowest levels since April, 2022. Hopefully this declining trend will continue.
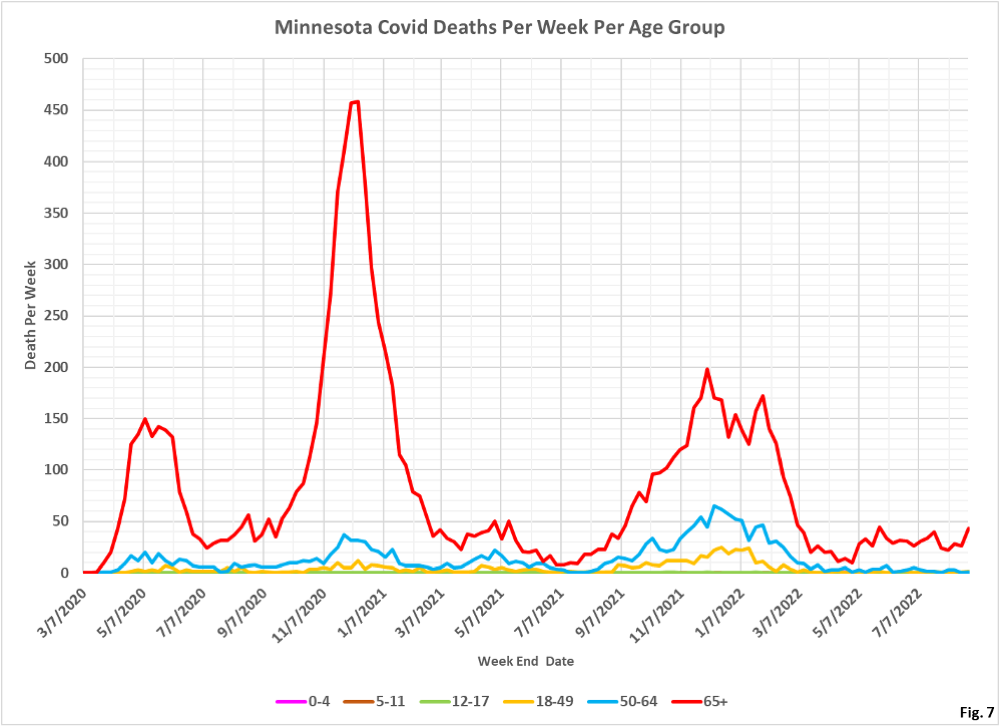
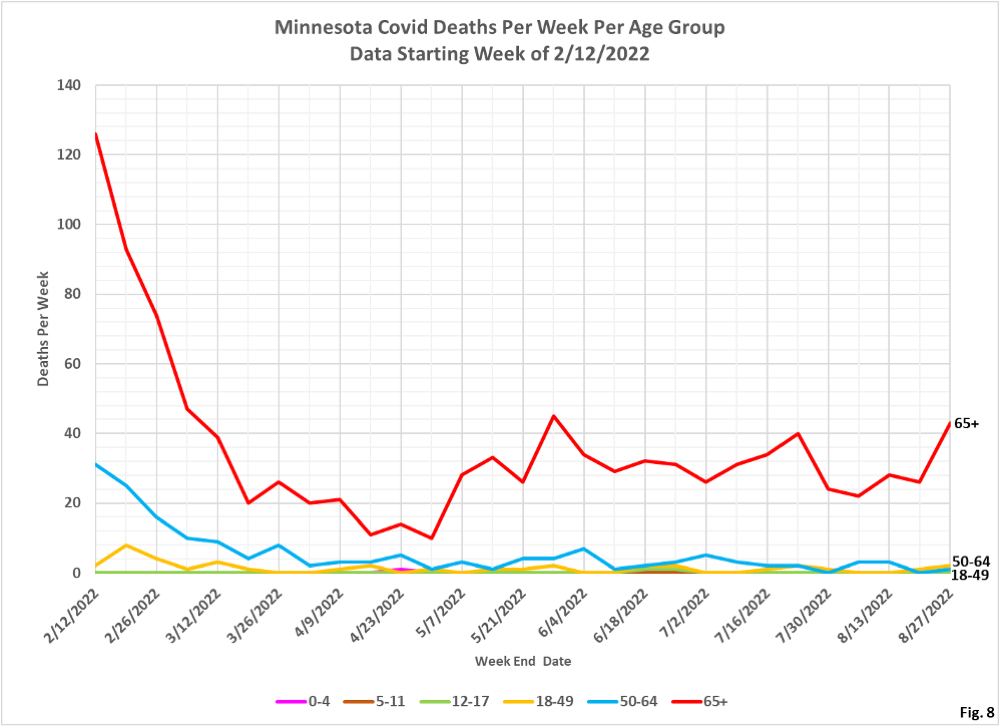
- Fig. 7 and 8: Covid Deaths Per Week. The last week of data is not displayed due to lags in reporting deaths. For the week of 8/27/2022 deaths in the 65+ age group were higher than had been reported in recent months, while there was one reported death in the 50-64 age group.
