 Dave’s notes:
- These age structure charts display the number of Covid cases, ICU hospital admissions, non-ICU hospital admissions, and deaths in Minnesota each week, sorted by age group. These are an update of last week’s charts published here on 8/20/2022: https://healthy-skeptic.com/2022/08/30/age-structure-charts-august-25-raw-numbers/.
- The data for the charts on cases comes from the data file “cage.csv”, Case Rate by Age Group, published by the Minnesota Department of Health (MDH) here: https://www.health.state.mn.us/diseases/coronavirus/stats/case.html. The link to the data file is located in the notes under the graphic “Case Rate by Age Group”. Similarly, the data for hospital admissions is taken from the data file “hage.csv”, Hospitalization Rate by Age Group available here: https://www.health.state.mn.us/diseases/coronavirus/stats/hosp.html . The data in this data file is plotted without modification except that we are taking the difference between total hospital admissions and ICU admissions in order to display non-ICU admissions. Finally, the data for deaths is taken from the data file “dage.csv”, Mortality Rate by Age Group, available here” https://www.health.state.mn.us/diseases/coronavirus/stats/death.html.
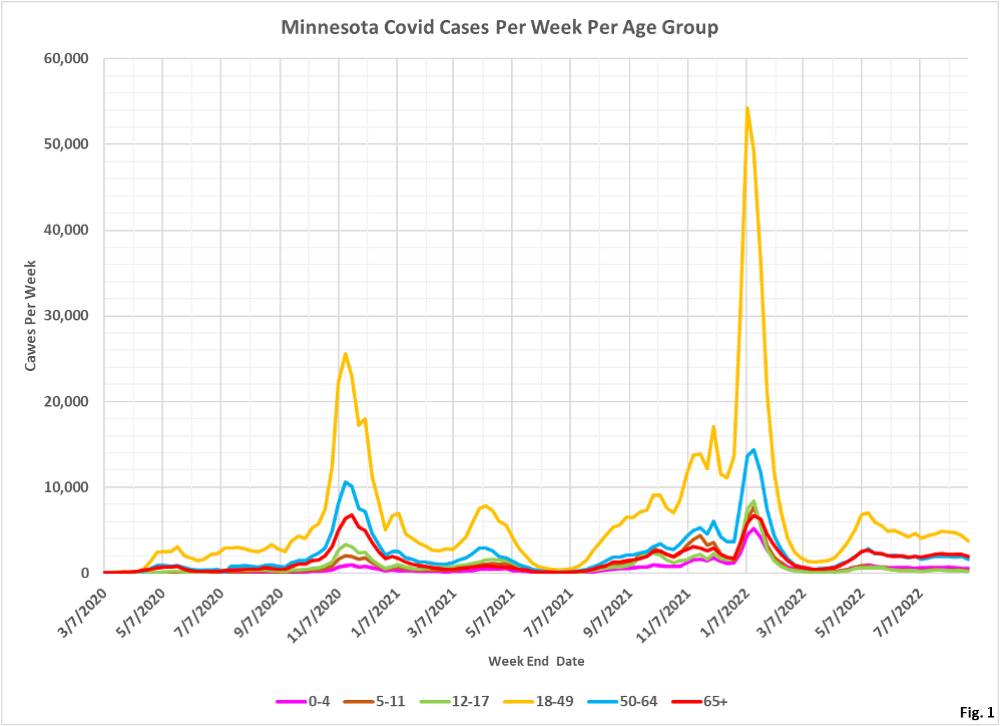
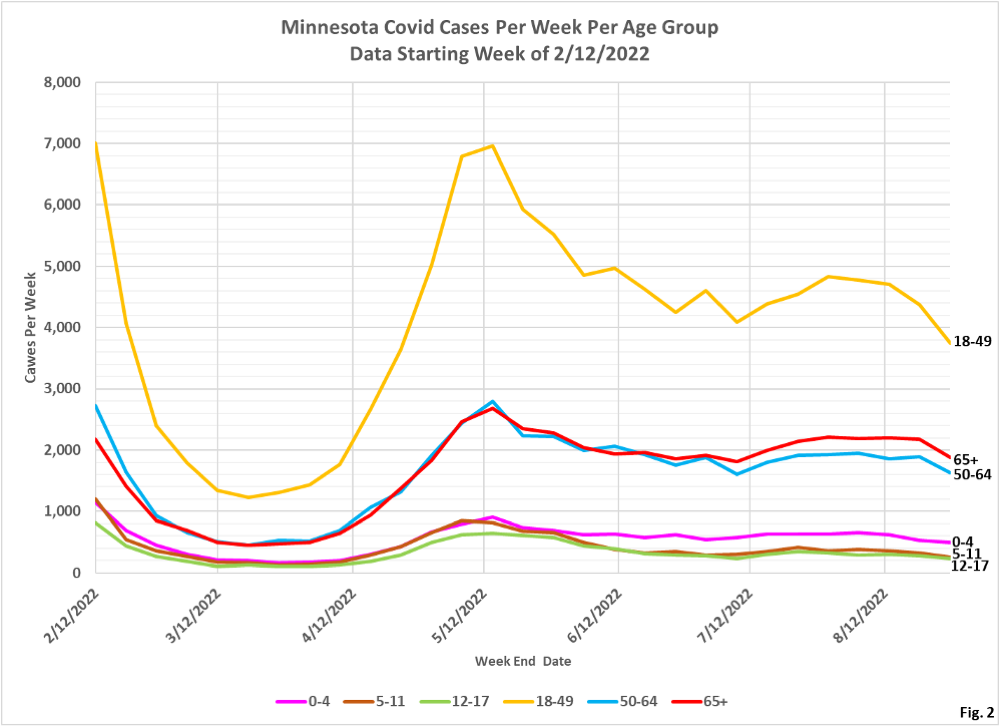
- Fig. 1 and 2: Covid Cases Per Week. The reported Covid cases for the week ending 8/27/2022 declined in all age groups. However, it is possible this decline will be revised away next week if it is due to delayed data processing or reporting by MDH.
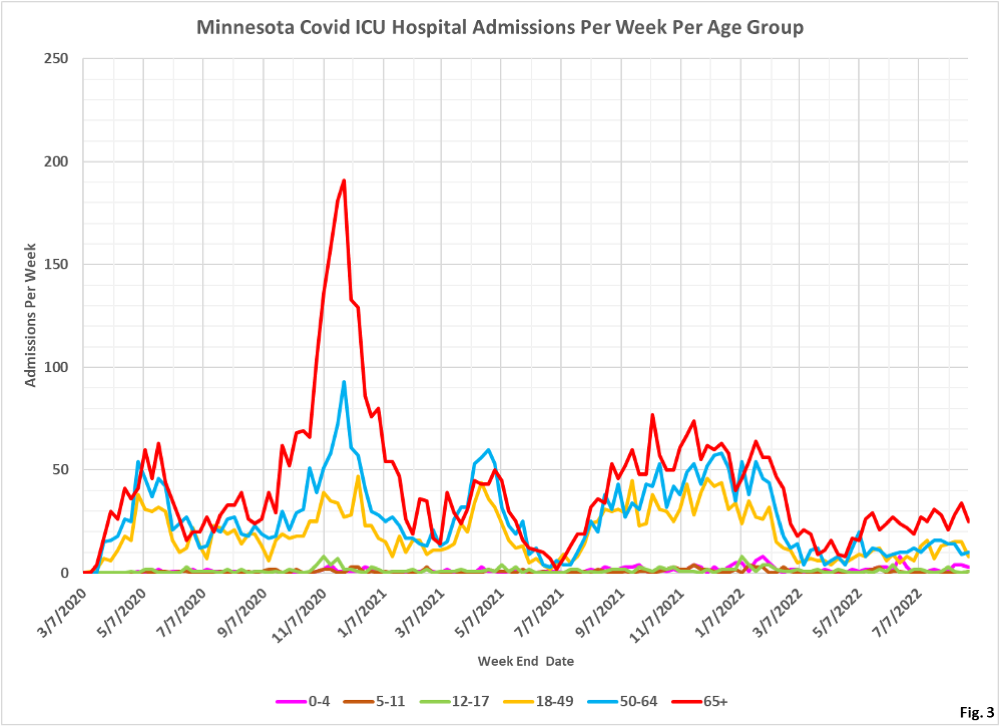
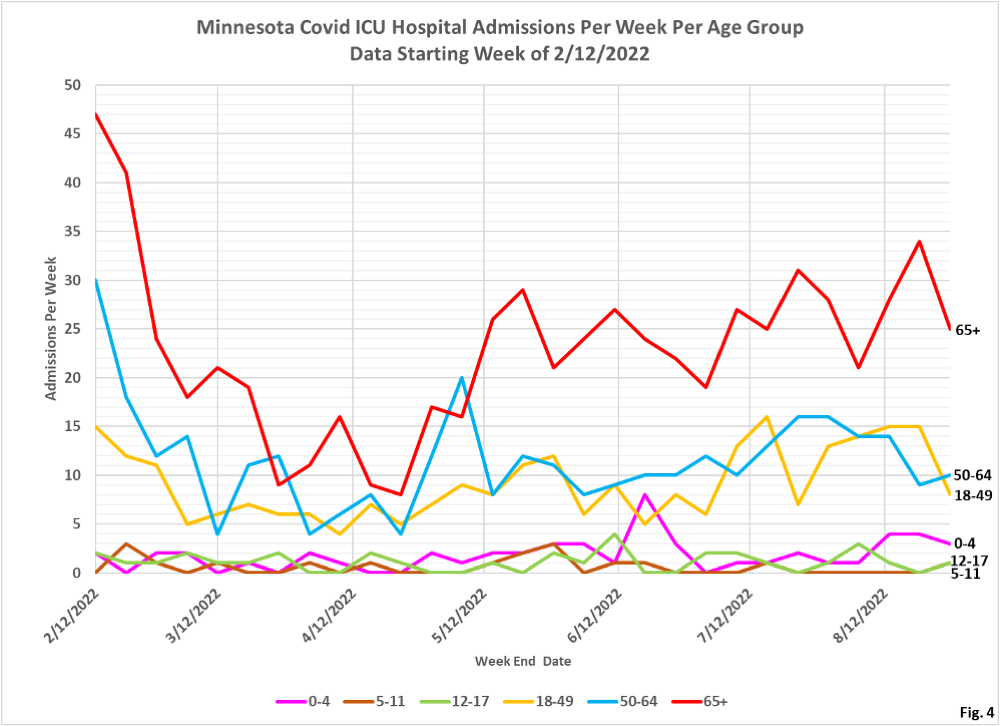
- Fig. 3 and 4: ICU Covid Admissions Per Week. ICU admissions for the week ending 8/27/2022 are lower in the 18-49 and 65+ age groups. However, it will take several weeks to confirm is this indeed a real decline, or just noisy data in the context of relatively elevated ICU admissions for Covid. Several of our Minnesota Government Data Practices Act requests for more data about incidental Covid infections (people admitted for non-Covid reasons but incidentally tested positive for Covid) have gone unanswered by MDH.
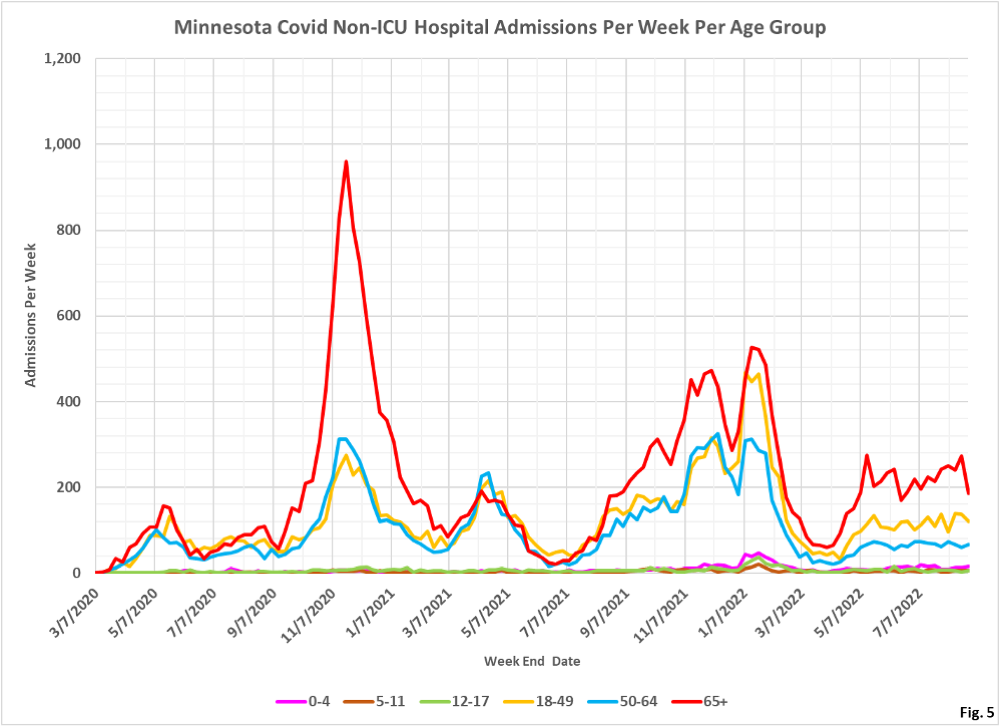
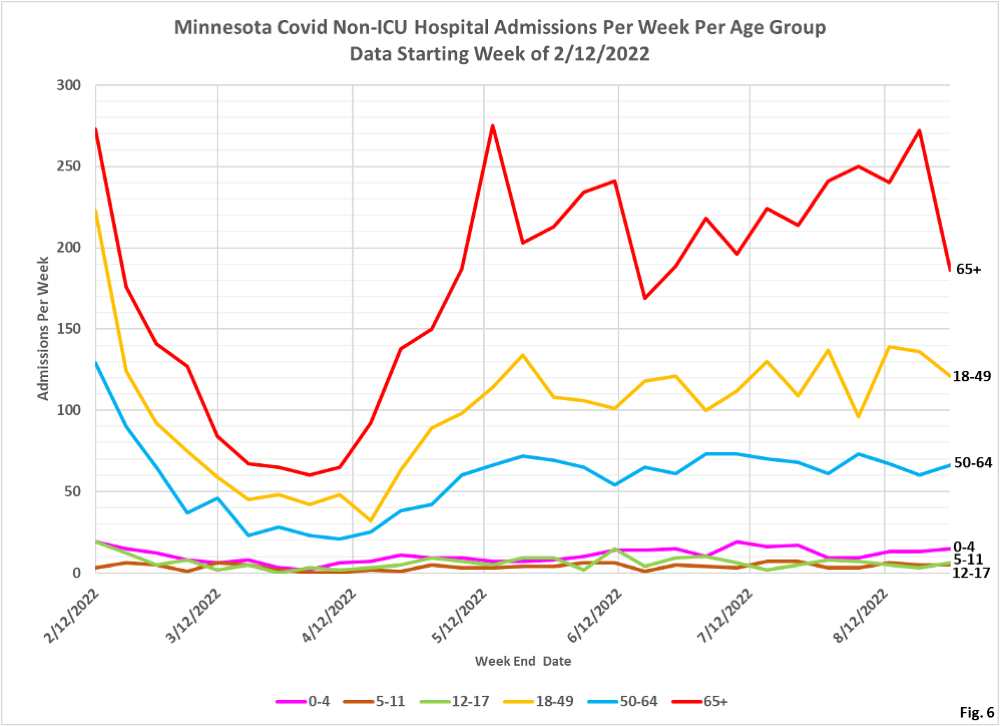
- Fig. 5 and 6: Non-ICU Covid Admissions Per Week. Non-ICU admissions for the 65+ age group were sharply lower for the most recent week, but may still be within the general long-term trend. The other age groups appear to be within their long-term trends over the last several months.
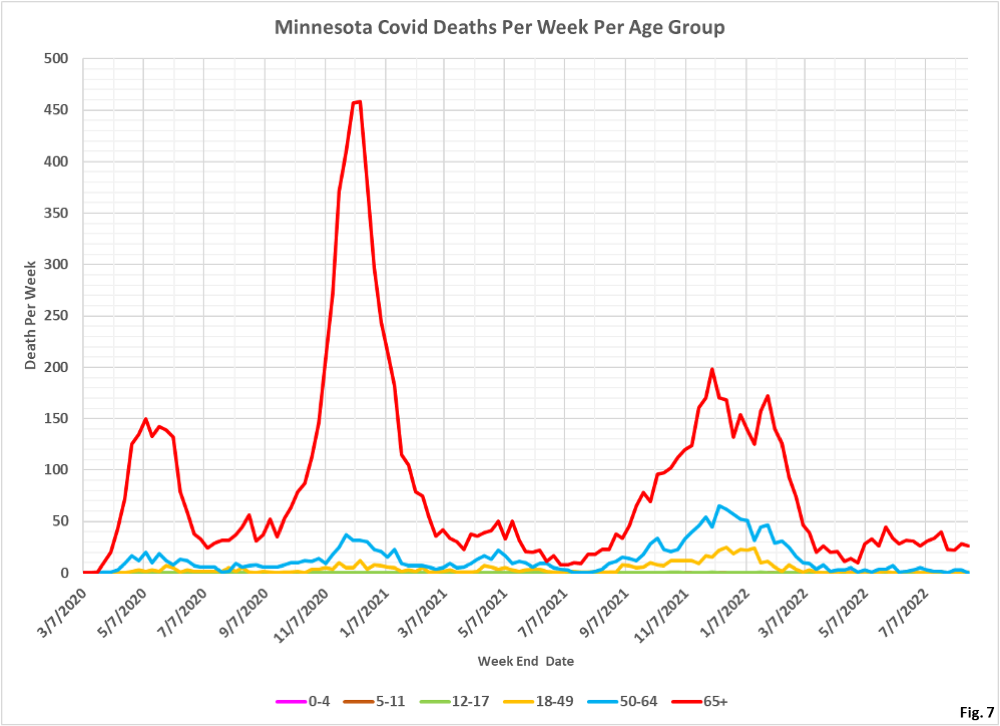
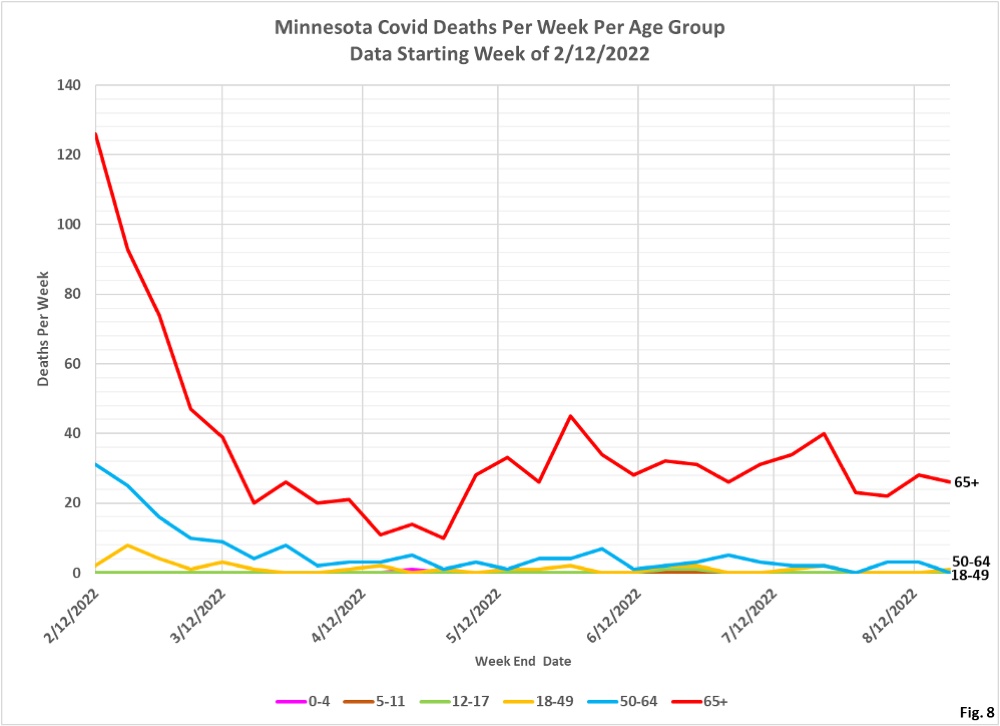
- Fig. 7 and 8: Covid Deaths Per Week. The last week of data is not displayed due to lags in reporting deaths. There is perhaps a light decreasing trend in Covid deaths among the 65+ age groups, with few or no deaths in the other age groups.

figure 7 – Minnesota covid deaths by age group.
The 50-64 age group shows an increase in deaths from approx 35-40 deaths per week in Nov/Dec 2020 vs approx 55-60 deaths per week in the Nov / Dec 2021. That seems to be an extremely high increase considering very small percentage vaxed in 2020 vs approx 60% vaxed (in that 50-64 age group) along with omicron being a less deadly variant.
Thoughts on the validity of the data. Seems that a lot of non covid deaths being coded as covid with that jump. Any info on how many of those “covid” deaths were coded as “unvaxed”
thanks for any insight.
I think probably still getting some Delta deaths then, but second issue is the biggie. I think at least half the deaths attributed to CV-19 actually had nothing to do with it