 Dave’s notes:
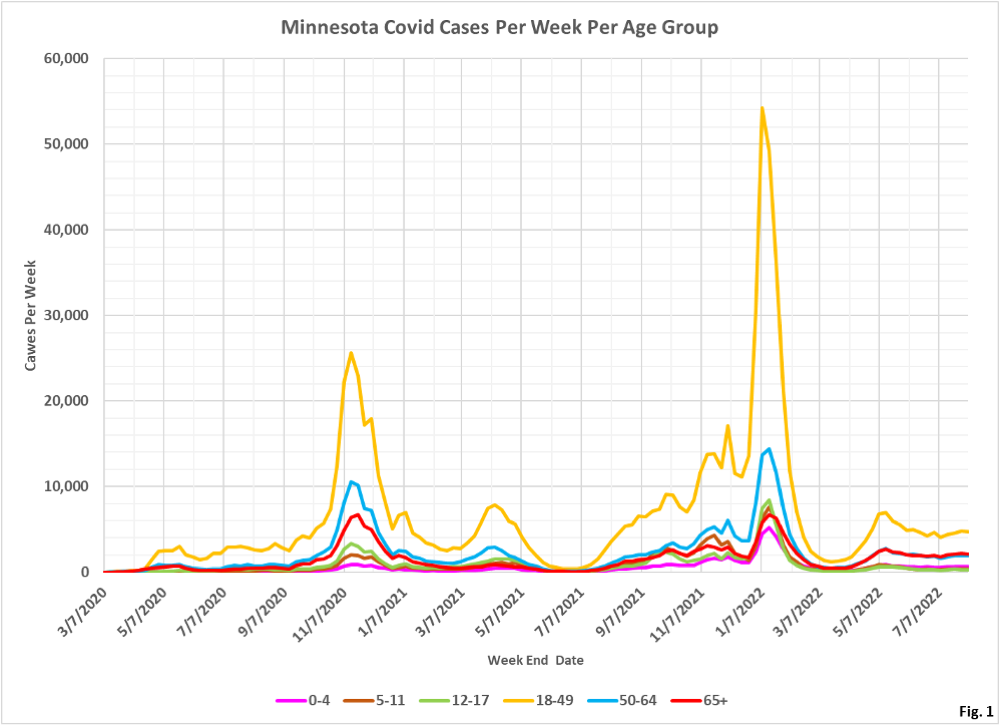
- These age structure charts display the number of Covid cases, ICU hospital admissions, non-ICU hospital admissions, and deaths in Minnesota each week, sorted by age group. These are an update of last week’s charts published here: https://healthy-skeptic.com/
2022/08/08/age-structure-raw- numbers-charts-august-4/. - The data for the charts on cases comes from the data file “cage.csv”, Case Rate by Age Group, published by the Minnesota Department of Health (MDH) here: https://www.health.state.mn.
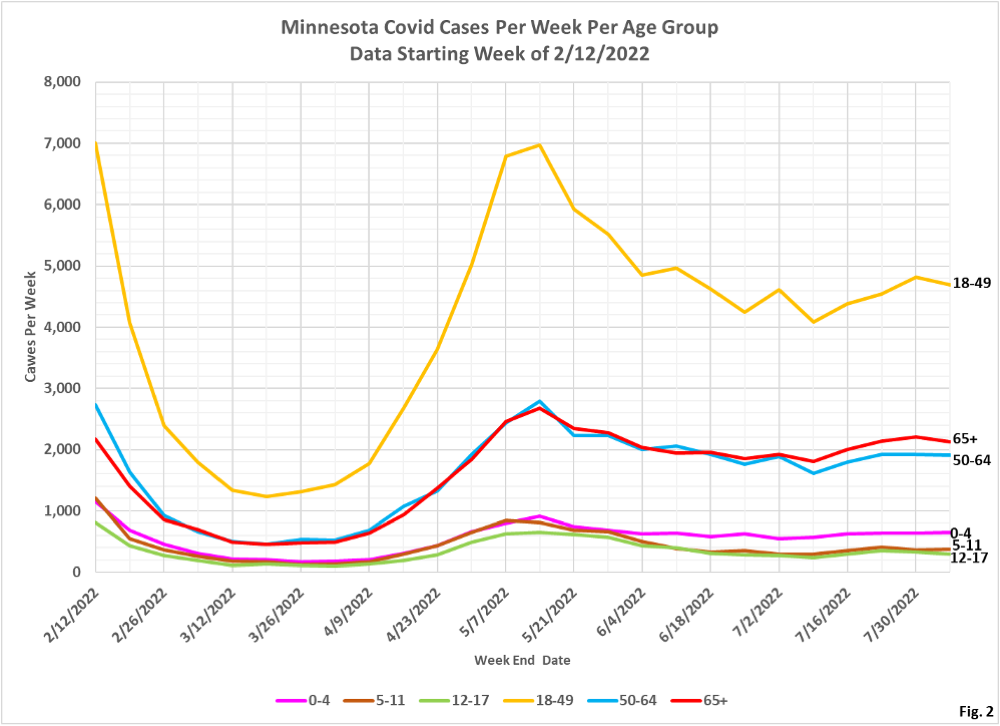
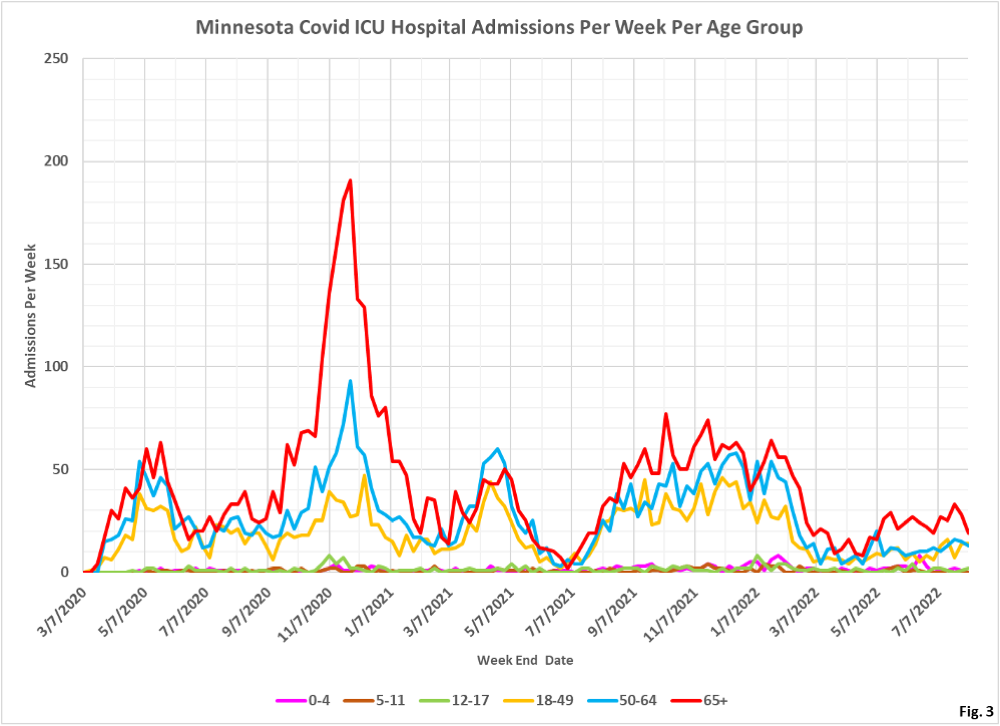
us/diseases/coronavirus/stats/ case.html. The link to the data file is located in the notes under the graphic “Case Rate by Age Group”. Similarly, the data for hospital admissions is taken from the data file “hage.csv”, Hospitalization Rate by Age Group available here: https://www.health.state.mn. us/diseases/coronavirus/stats/ hosp.html . The data in this data file is plotted without modification except that we are taking the difference between total hospital admissions and ICU admissions in order to display non-ICU admissions. Finally, the data for deaths is taken from the data file “dage.csv”, Mortality Rate by Age Group, available here” https://www.health.state.mn. us/diseases/coronavirus/stats/ death.html. - Fig. 1 and 2: Covid Cases Per Week. The reported Covid cases for the week ending 8/06/2022 are slightly lower or flat in all age groups.
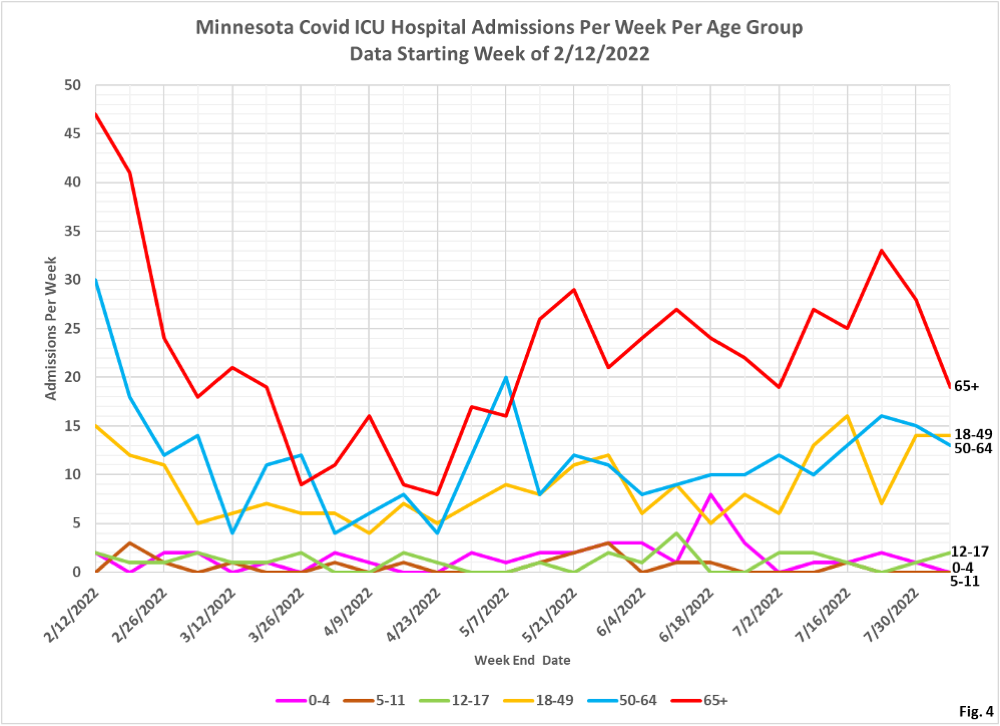
- Fig. 3 and 4: ICU Covid Admissions Per Week. Admissions for the 65+ age group were lower for the second week in a row.
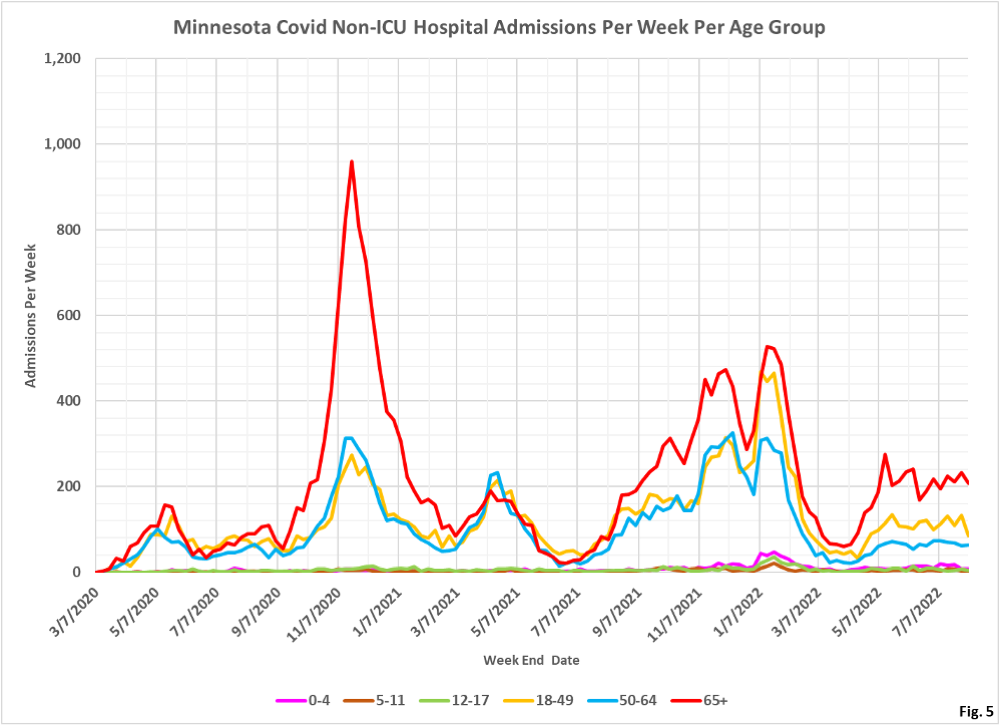
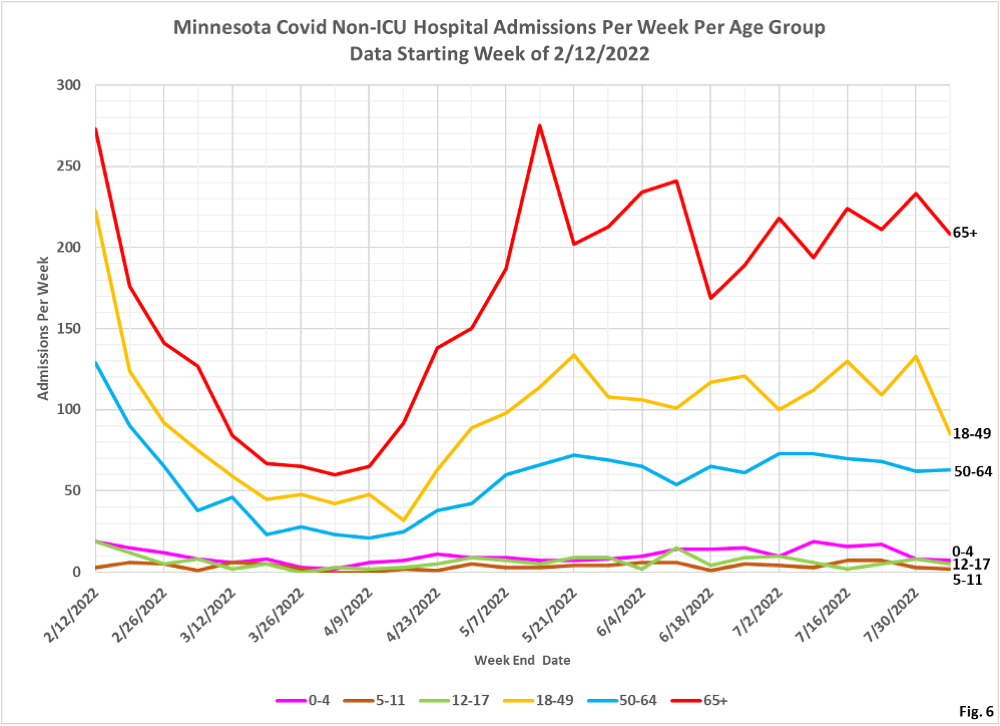
- Fig. 5 and 6: Non-ICU Covid Admissions Per Week. Large drop in admissions for the 18-49 age group. The other age groups remain within recent trends.
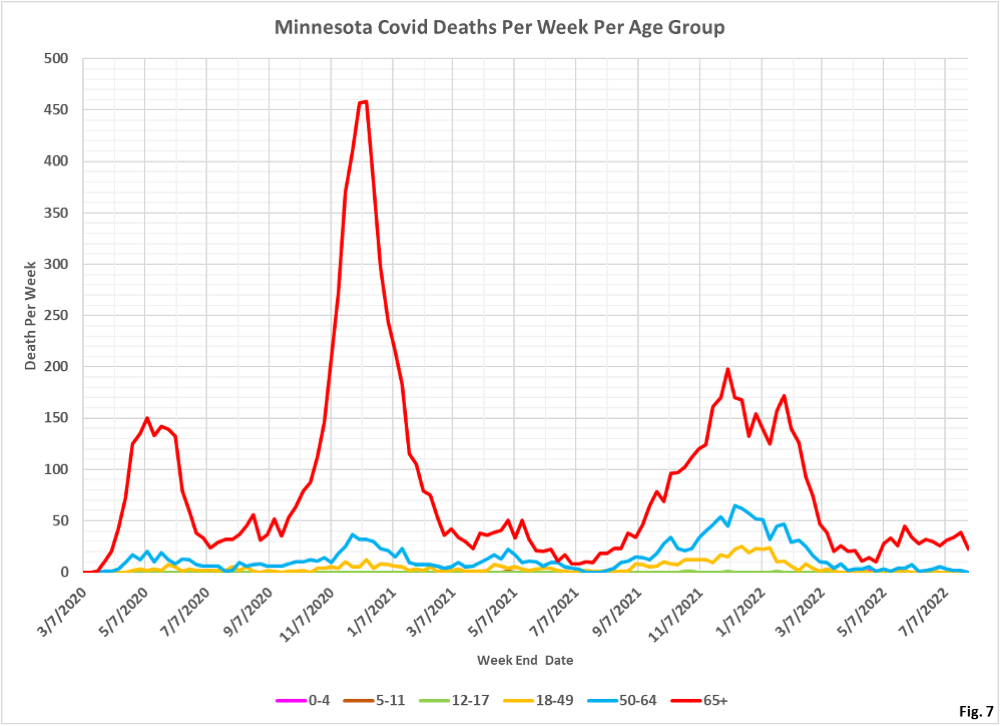
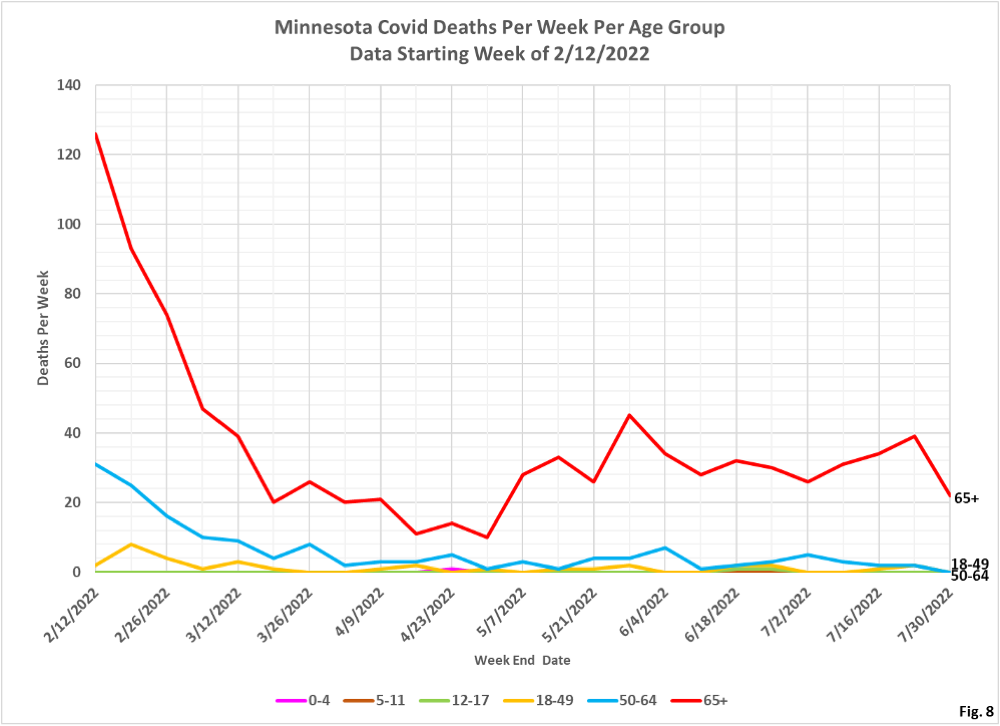
- Fig. 7 and 8: Covid Deaths Per Week. The last week of data is not displayed due to lags in reporting deaths. Death reporting lags can be quite variable, as we have seen in the past.
