 Dave’s notes:
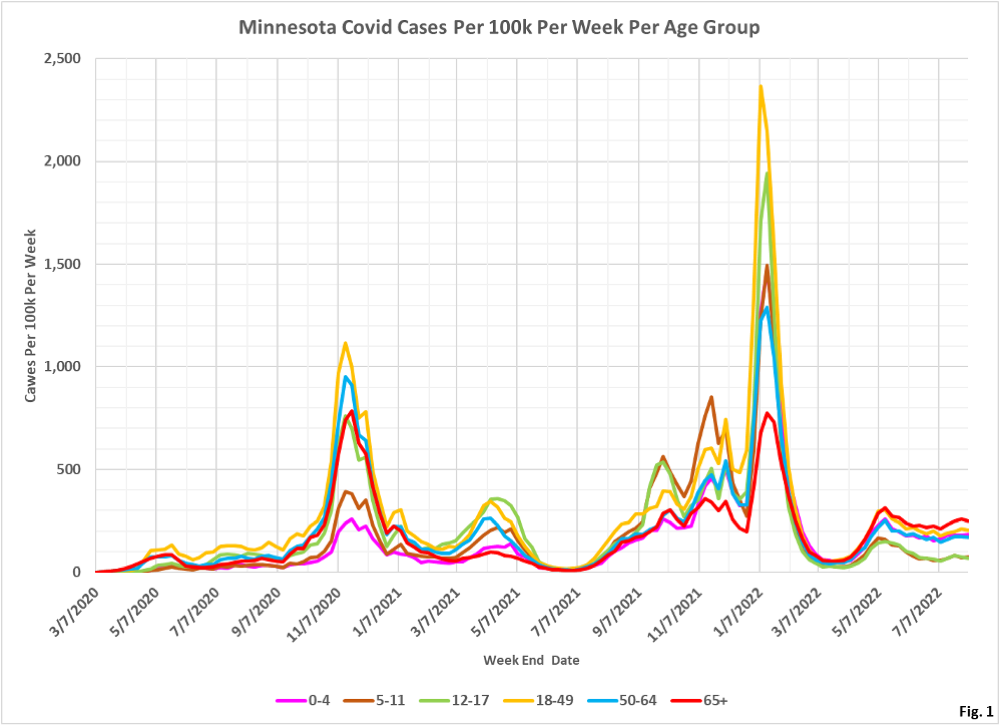
- These age structure charts display the rates per 100k of Covid cases, ICU hospital admissions, non-ICU hospital admissions, and deaths in Minnesota. These charts quantify the risk to an individual in each age group, in contrast to our other age structure charts sets which show the overall numbers of cases, admissions, and deaths in total for each age group for each week. These charts are an update of the population rate charts posted here on 8/08/2022: https://healthy-skeptic.com/
2022/08/08/age-structure- population-rate-charts-august- 4/. - The data for the charts on cases comes from the data file “cage.csv”, Case Rate by Age Group, published by the Minnesota Department of Health (MDH) here: https://www.health.state.mn.
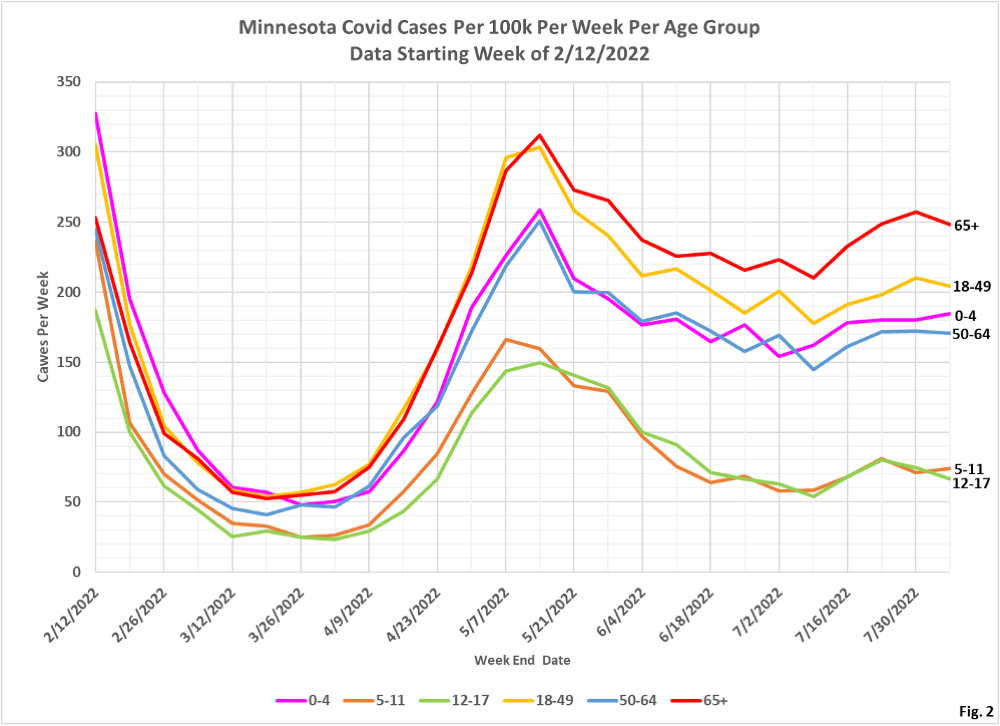
us/diseases/coronavirus/stats/ case.html. The link to the data file is located in the notes under the graphic “Case Rate by Age Group”. Similarly, the data for hospital admissions is taken from the data file “hage.csv”, Hospitalization Rate by Age Group available here: https://www.health.state.mn. us/diseases/coronavirus/stats/ hosp.html . The data in this data file is plotted without modification except that we are taking the difference between total hospital admissions and ICU admissions in order to display non-ICU admissions. Finally, the data for deaths is taken from the data file “dage.csv”, Mortality Rate by Age Group, available here” https://www.health.state.mn. us/diseases/coronavirus/stats/ death.html. - Fig. 1 and 2: Covid Cases Per 100k Per Week. For the week ending 8/06/2022, all age groups are slightly lower except the 0-4 and 5-11 age groups.
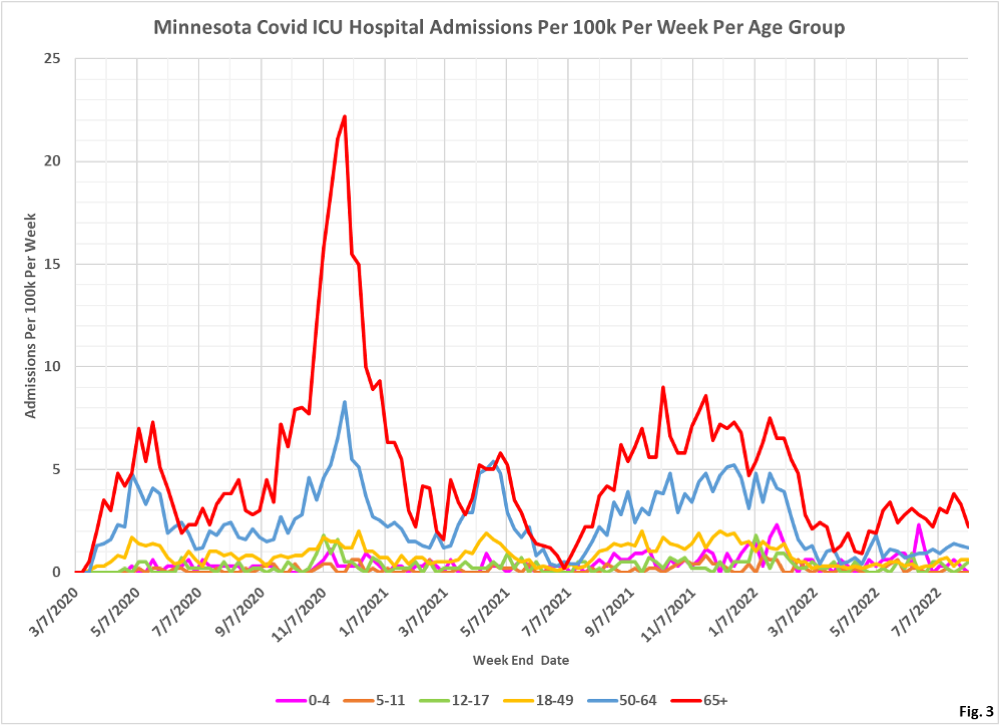
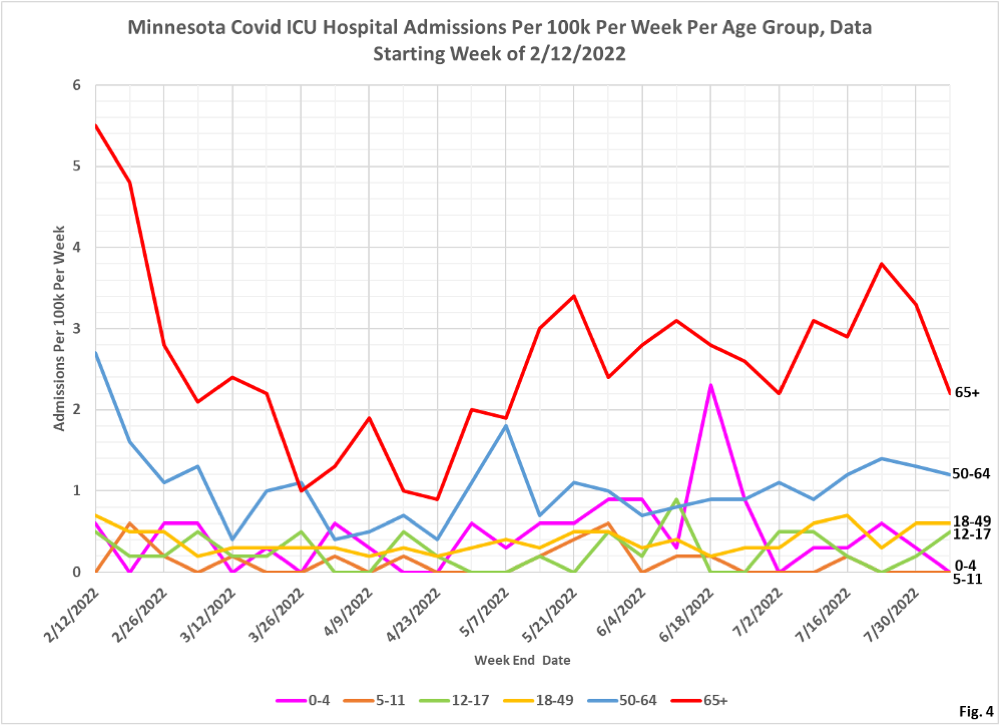
- Fig. 3 and 4: ICU Covid Admissions Per Week. This week we have a large decrease in the 65+ and an increase (from zero) in the 12-17 age group.
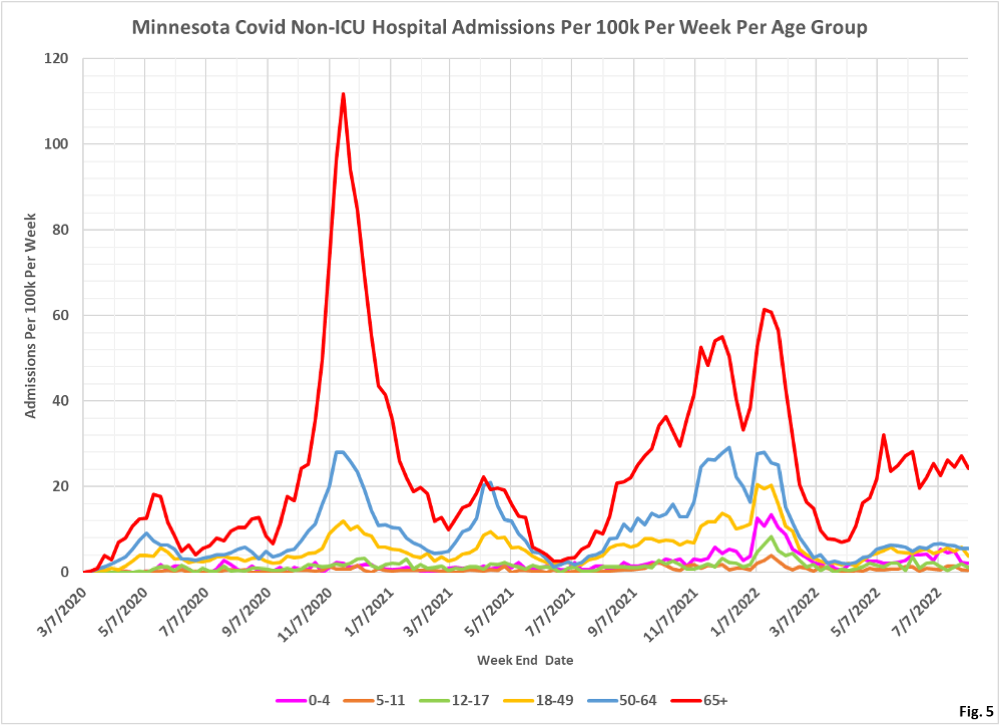
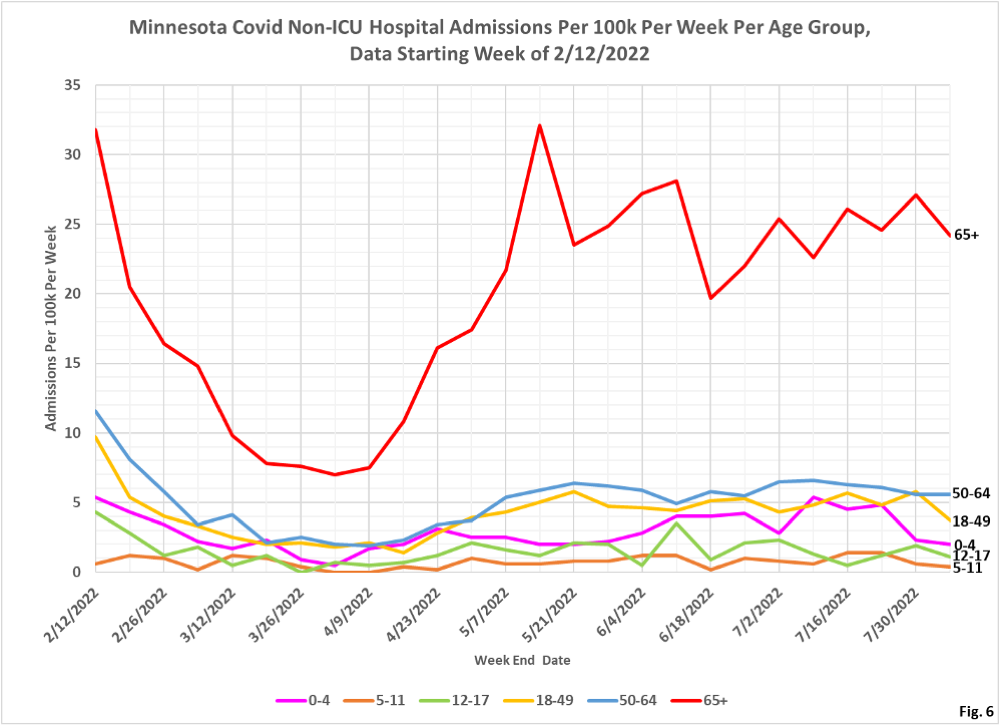
- Fig. 5 and 6: Non-ICU Covid Admissions Per Week. Non-ICU admission rates per 100k remain level, with perhaps the 18-49 group dropping below the recent trend.
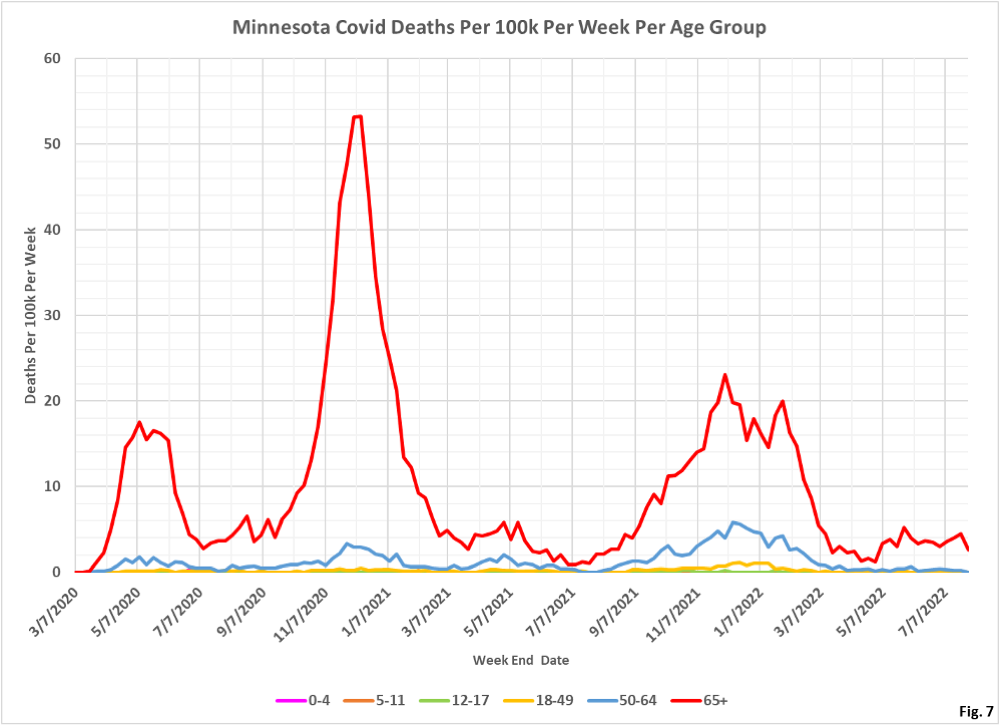
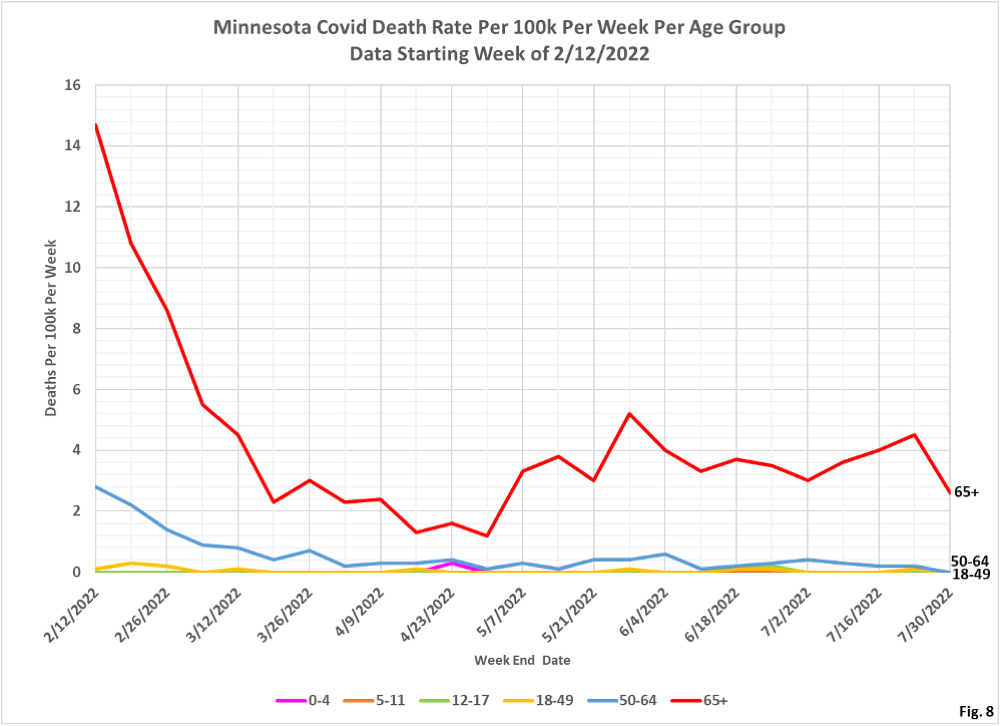
- Fig. 7 and 8: Covid Deaths Per Week. Due to reporting lags we are omitting the most recent week of data. For the week of 7/30/2022 there were no reported Covid deaths except in the 65+ age group. This data is revised retroactively, however, so additional deaths may be added later.
