Not much going on, just the sort of plateau across age groups that we have seen for weeks.
 Dave’s notes:
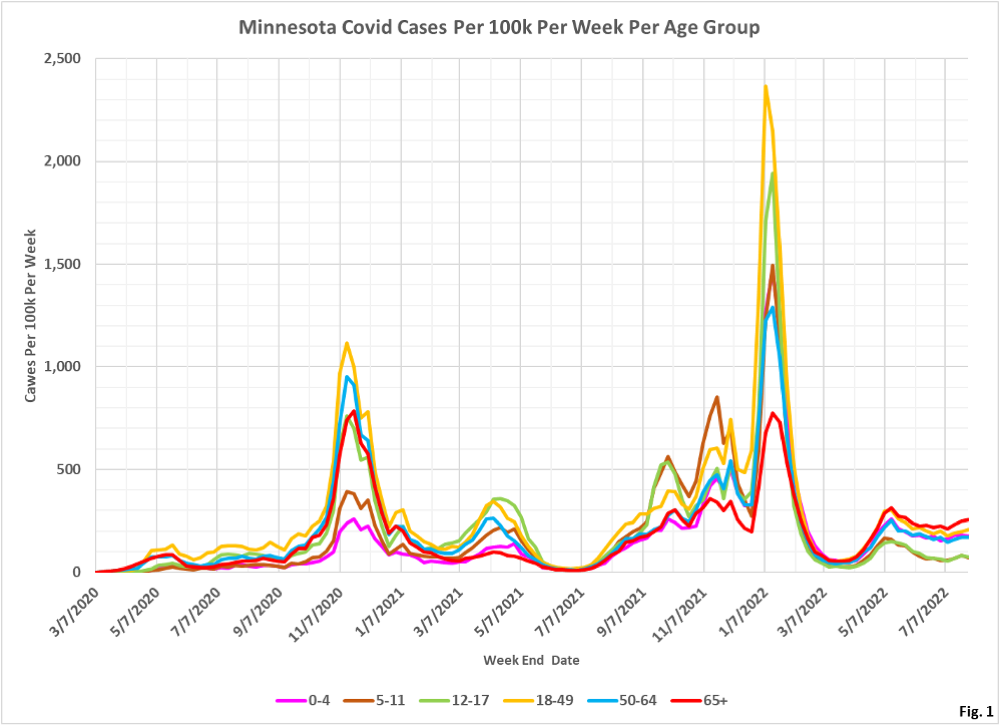
- These age structure charts display the rates per 100k of Covid cases, ICU hospital admissions, non-ICU hospital admissions, and deaths in Minnesota. These charts quantify the risk to an individual in each age group, in contrast to our other age structure charts sets which shows the overall numbers of cases, admissions, and deaths in total for each age group for each week. These charts are an update of the population rate charts posted last week here: https://healthy-skeptic.com/
2022/07/30/age-structure- charts-july-28-population- rates/. - The data for the charts on cases comes from the data file “cage.csv”, Case Rate by Age Group, published by the Minnesota Department of Health (MDH) here: https://www.health.state.mn.
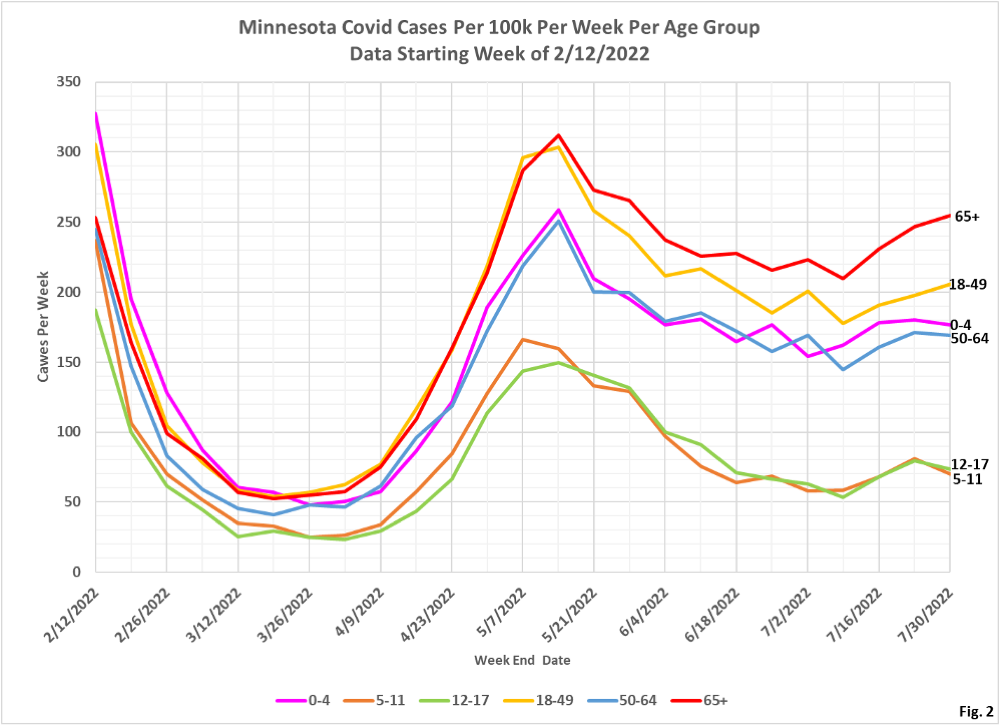
us/diseases/coronavirus/stats/ case.html. The link to the data file is located in the notes under the graphic “Case Rate by Age Group”. Similarly, the data for hospital admissions is taken from the data file “hage.csv”, Hospitalization Rate by Age Group available here: https://www.health.state.mn. us/diseases/coronavirus/stats/ hosp.html . The data in this data file is plotted without modification except that we are taking the difference between total hospital admissions and ICU admissions in order to display non-ICU admissions. Finally, the data for deaths is taken from the data file “dage.csv”, Mortality Rate by Age Group, available here” https://www.health.state.mn. us/diseases/coronavirus/stats/ death.html. - Fig. 1 and 2: Covid Cases Per 100k Per Week. For the week ending 7/30/2022, the 18-49 and 65+ age groups have a slight increase in case rates per 100k for the third week in a row, with the other age groups declining slightly.
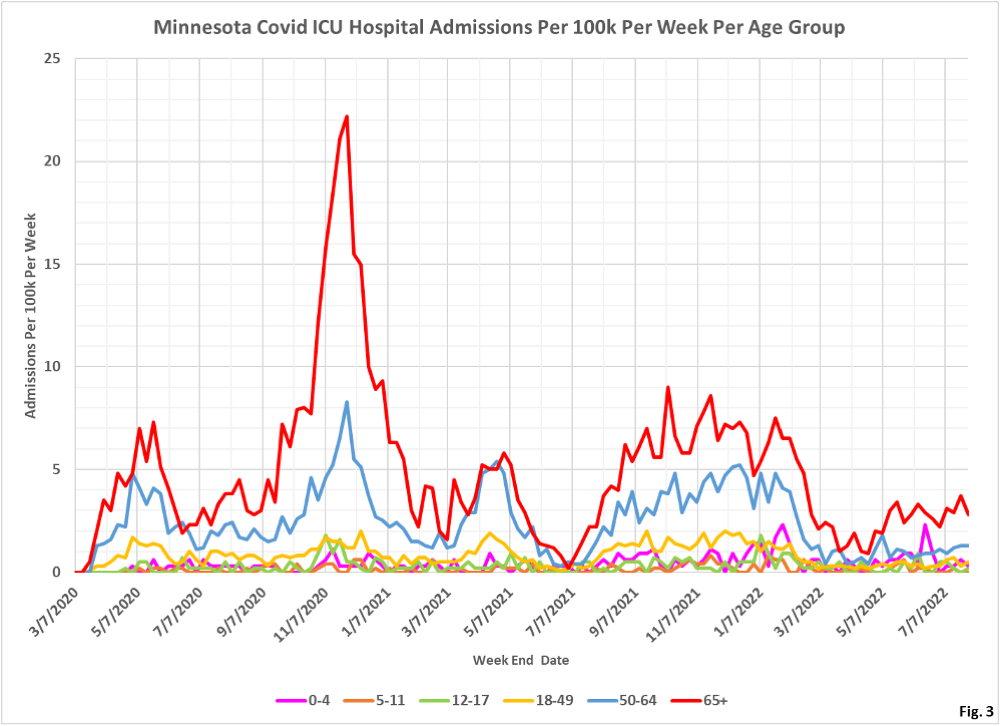
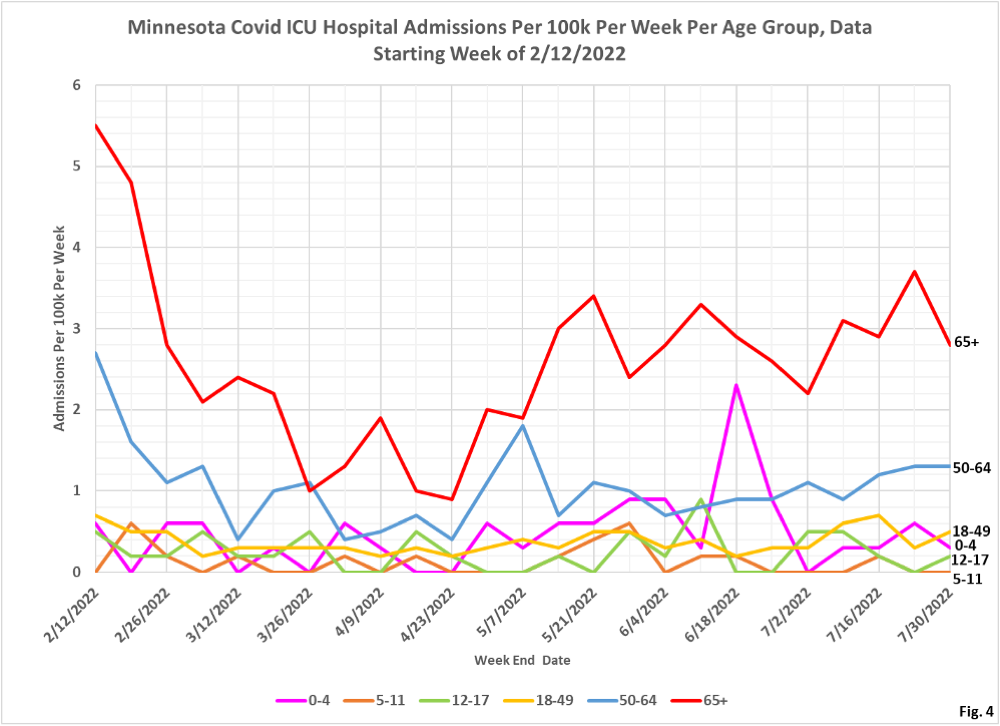
- Fig. 3 and 4: ICU Covid Admissions Per Week. There appears to be a slight upward trend in admissions for the 65+ and 50-64 age groups over the last 2 months.
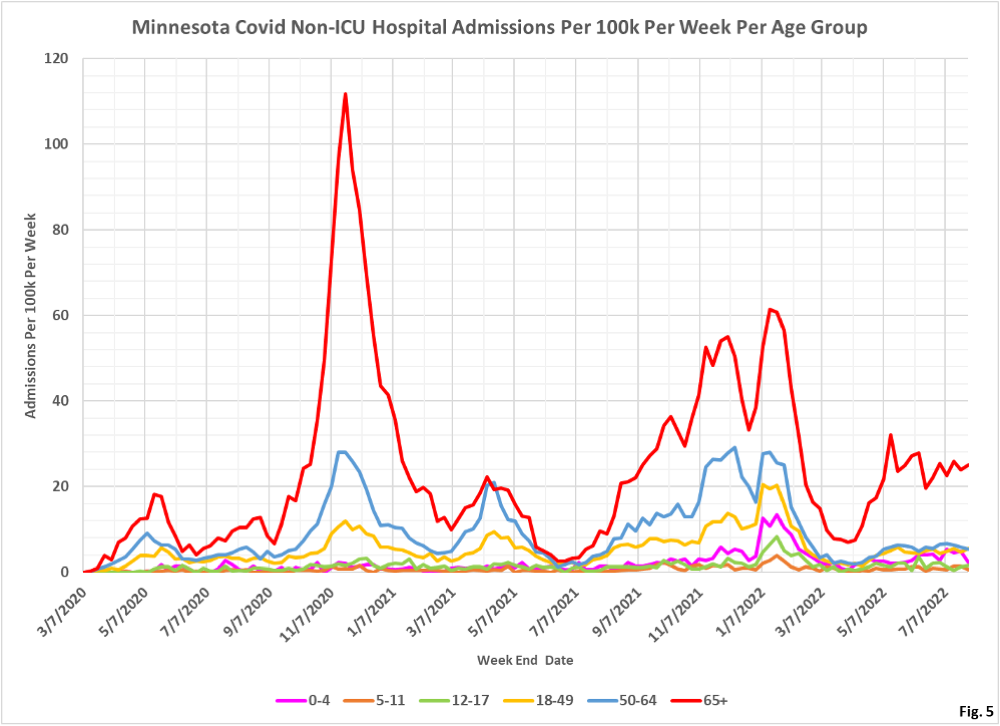
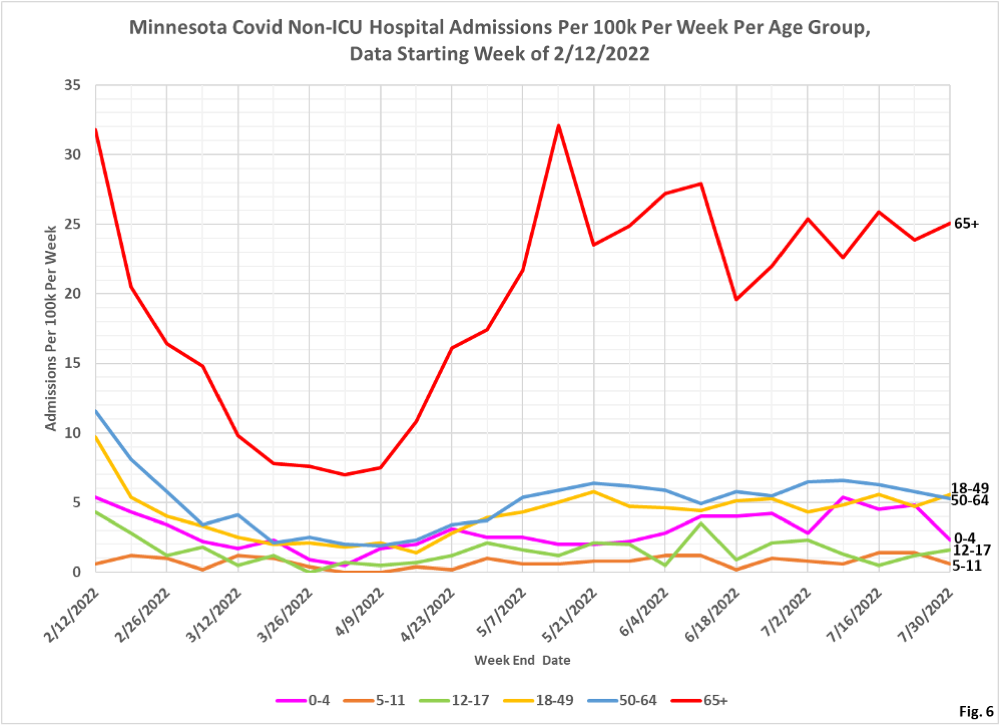
- Fig. 5 and 6: Non-ICU Covid Admissions Per Week. Non-ICU admission rates per 100k remain very level.
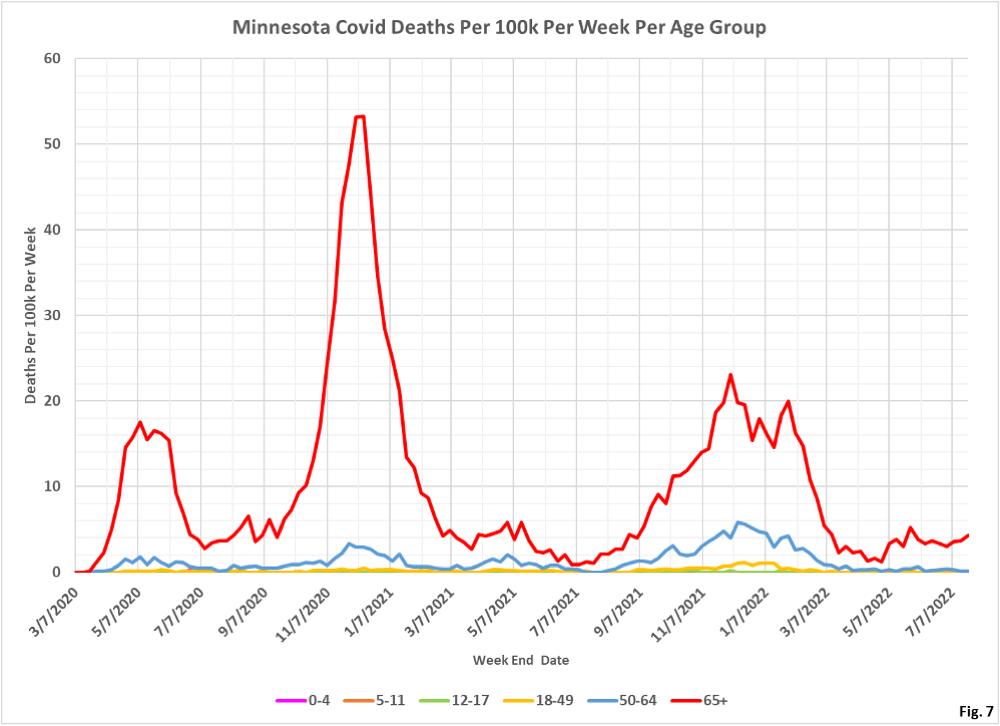
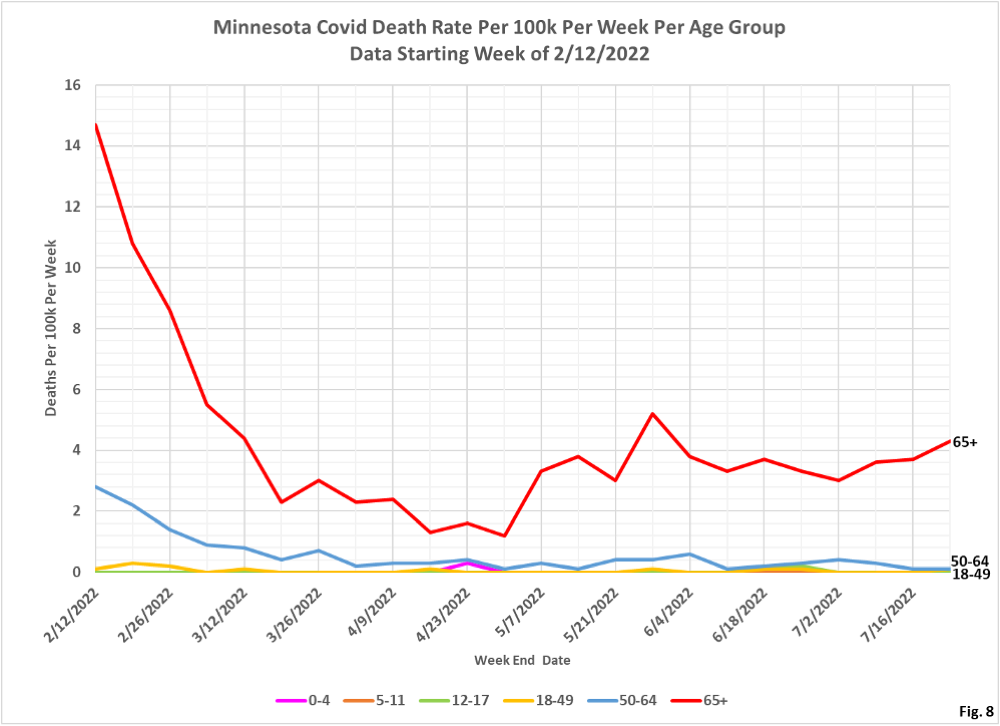
- Fig. 7 and 8: Covid Deaths Per Week. Reported Covid deaths continue the recent slight increasin trend in the 65+ age group, with virtually no reported deaths in the other age group. The last week of data is not displayed due to MDH reporting lags.
