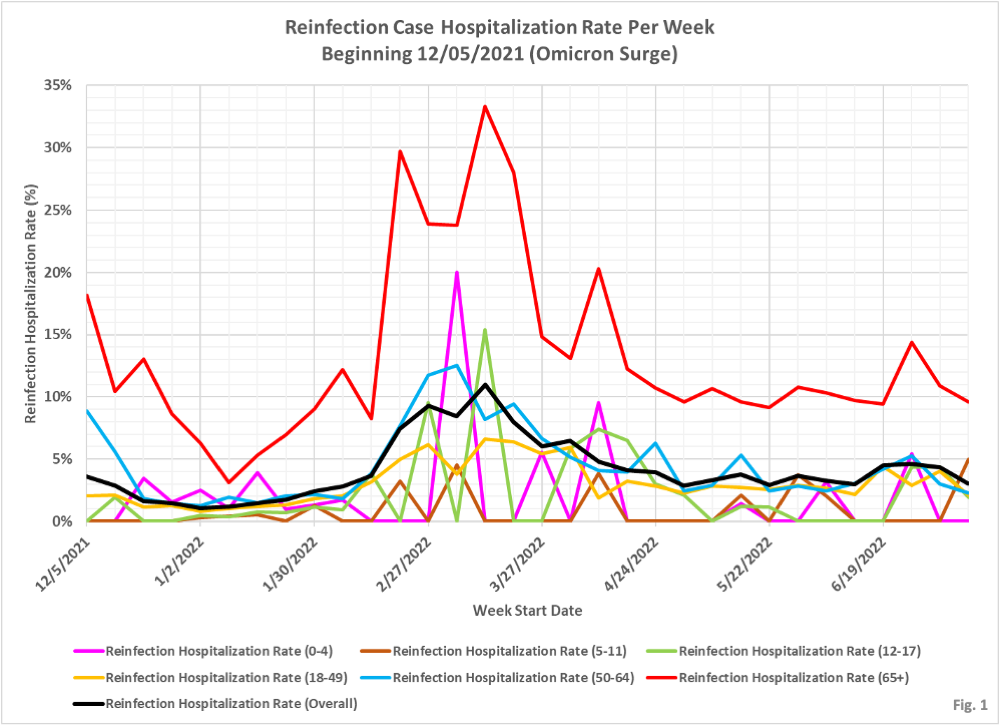
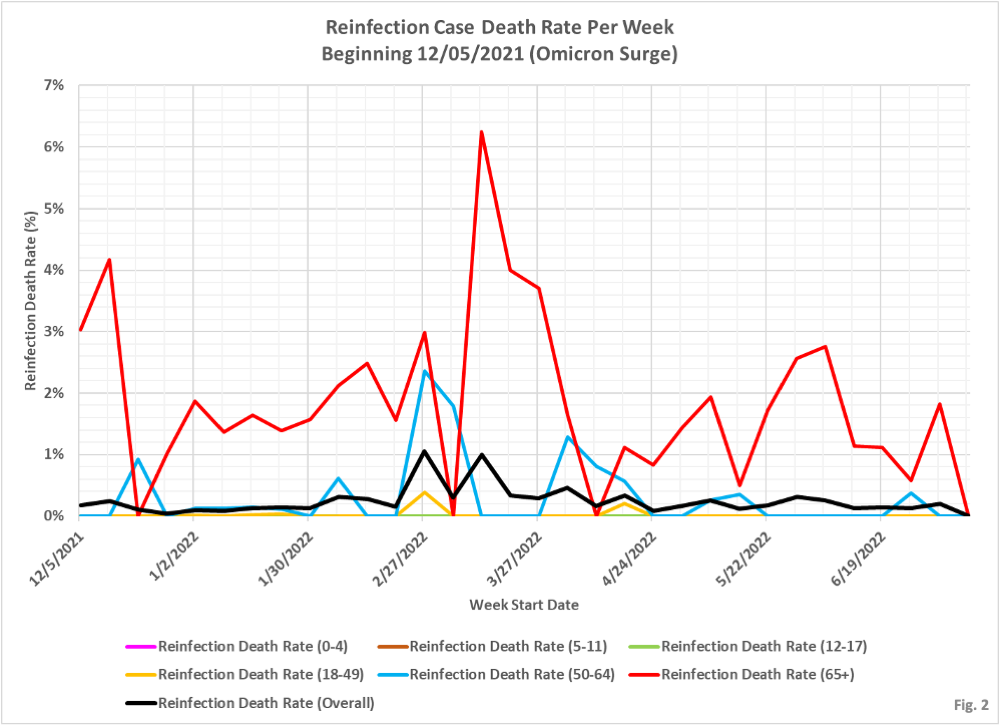
Just as with breakthrough infections, people with a prior infection can have serious reinfections. These charts show the rates of hospitalizations and deaths among people with reinfections since around the start of the Omicron wave. The black line is the overall rate and the others are for age groups. Just as with other cases, the oldest groups have the most serious disease. If you ignore the overlap with vaccination issue, which you shouldn’t, a case comparison with breakthroughs would be interesting. In the most recent week’s report, 4.9% of breakthrough cases were hospitalized and .12% died. The re-infection hospitalization rate is somewhat lower than that for breakthroughs and the deaths are so low for each that comparisons are iffy, but the re-infection one is at least as low as the re-infection one.
 Dave’s notes:
- We recently published charts showing the proportion of Minnesota’s daily Covid cases that are reinfections, here: https://healthy-skeptic.com/
2022/08/01/reinfection-data/ . These charts were based on a data set we obtained from the Minnesota Department of Health (MDH) through a Minnesota Government Data Practices Act request. This data set contains a list of all reinfections cases, along with a Yes/No data flag for whether each reinfection case was hospitalized or had died. This data allows us to calculate the proportion of reinfections detected in any given week who are hospitalized or die. - Our 8/01/2022 charts show that the proportion of reinfection cases accelerated greatly in early December 2021 when the Omicron variant spread in Minnesota. Prior to 12/5/2021 there were a relatively low proportion of reinfection cases, and therefore the reinfection hospitalization rate and hospitalization death rate were quite variable. For this reason we chose 12/05/2021 as the start date for these new charts. We have stopped the charts on the week starting 7/10/2022, to avoid displaying incomplete data.
- Note that, despite requesting vaccination data, MDH has not provided us with the vaccination status of these reinfection cases. We assume that a sizeable fraction of these reinfection cases are also vaccinated.
- Fig. 1 shows the proportion on weekly reinfection cases who went on to be hospitalized. This chart peaks at approximately 33.5 % for the week 3/13/2022, for the 65+ age group. Note that, as seen in the reinfection charts here https://healthy-skeptic.com/
2022/08/01/reinfection-data/, that around this time Covid cases were at a low point, as well as reinfection cases. It is unclear why a higher percentage of reinfection cases would be hospitalized when case levels were low. - Fig. 2 shows the proportion of weekly reinfection cases who went on to die. The 65+ age group peaks on 3/13/2022 at 6.3%, the same week that the hospitalization rate peaked for this age group. Not surprisingly, the 65+ age group account for the vast majority of the reinfection deaths, along with a relatively small number of individuals in the 50-64 age group.
