Through sheer persistence, Dave finally got reinfection data out of the state. And it has more data elements than the previous reinfection data did. Just as breakthroughs have continued to rise, reinfections also have climbed. And we have a lot of combo platter–infections in people who are vaxed and had a prior infection, but DOH denies having this data, but they do and for some bizarre reason won’t share it. Welcome to the world of respiratory viruses. We hope to calculate case rates for hospitalizations and deaths as well, based on the new data.
 Dave’s notes:
- We last published reinfection case data on 6/14/2022 here: https://healthy-skeptic.com/2022/06/14/reinfections-are-increasing-too/ . However, the Minnesota Department of Health (MDH) stopped publishing reinfection data on 6/30/2022, along with major reporting changes to their Situation Update for COVID-19 web page here: https://www.health.state.mn.us/diseases/coronavirus/stats/index.html. Since then we have filed a request under the Minnesota Government Data Practices Act for reinfection data, and on 7/28/2022 MDH fulfilled our request. The data MDH provided is a list of all reinfection cases by specimen collection date, along with the age of the individual, a Yes/No flag for whether or not the individual was hospitalized, and a Yes/No flag for whether or not the individual died.
- It is important to note that MDH did not provide several other pieces of information that we have requested. We have asked repeatedly over the course of the pandemic for vaccination information for individuals who were reinfected, but MDH has said that it is not possible for them to provide this data. This means that we have no knowledge of how many of these reinfection cases were also vaccinated or boosted. We have also asked for the date of initial infection along with the date of the reinfection, but this has also not been provided.
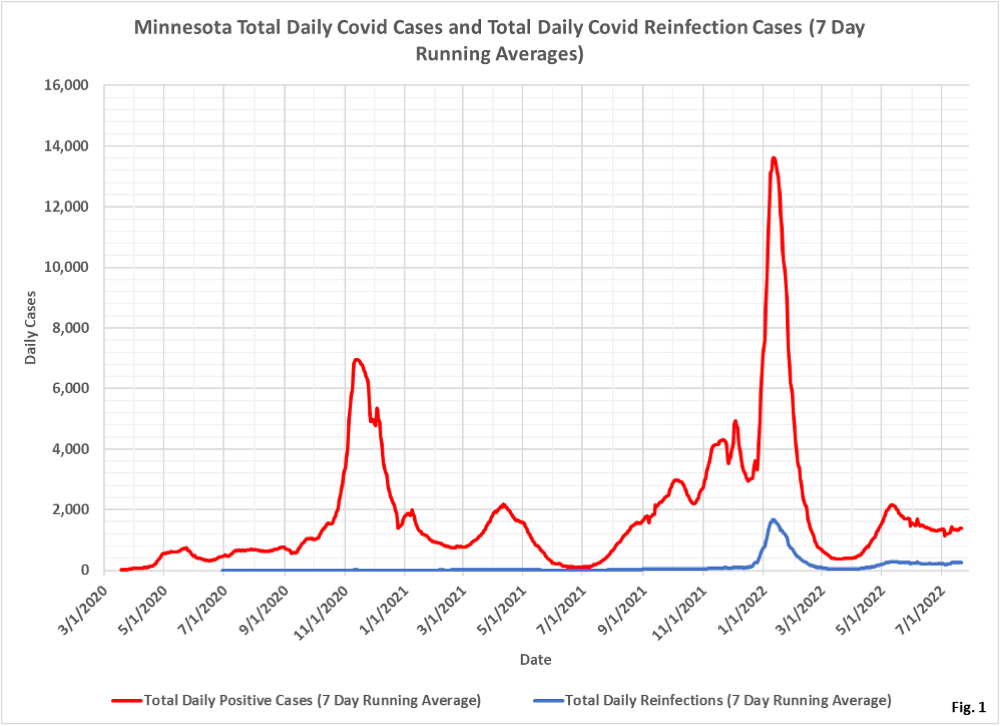
- Fig. 1 displays the total daily Covid cases in Minnesota and the total daily reinfection cases. The cases per day by date are found in a data named “c7day.csv”, available on the MDH Case and Variant subpage https://www.health.state.mn.us/diseases/coronavirus/stats/case.html, in the notes under the graphic “Cases Over Time (7-Day Moving Average)”. The reinfection cases per day are found in the reinfection data provided under the Data Practices Act request, as stated in Note 1 above. Both of these curves are plotted as 7 day running averages. In order to minimize incomplete reporting the last 7 days of data are excluded, with the charts ending on 7/21/2022.
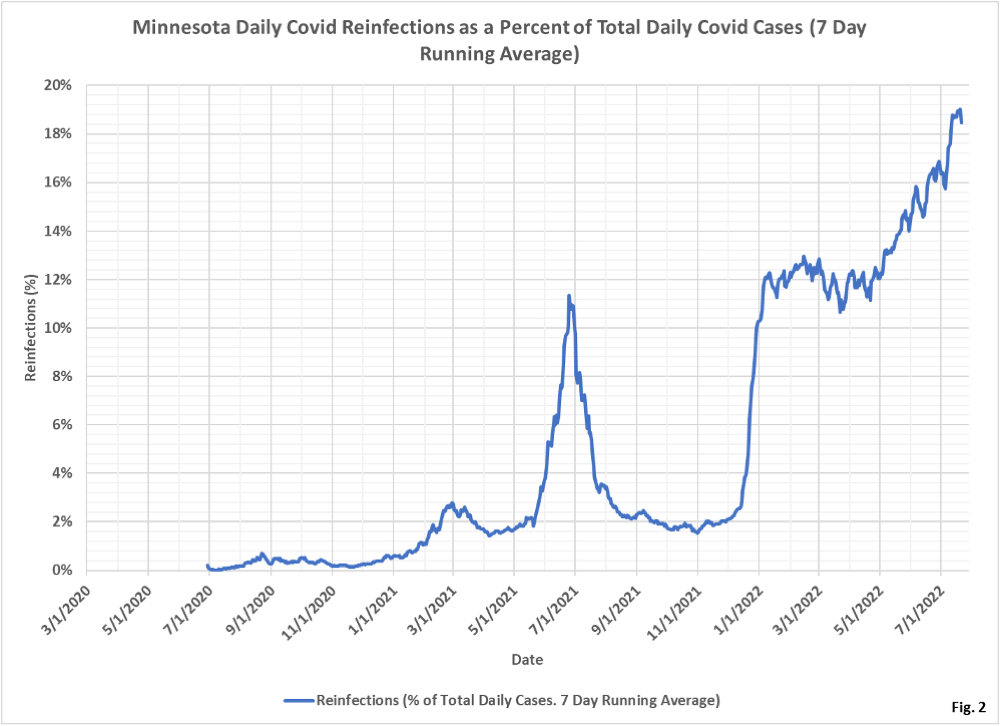
- Fig. 2 displays the proportion of daily reinfections to daily total cases, taking the ratio of the 7 day running averages. We can see that the proportion of reinfection cases surged in January 2022 with the Omicron variant, and has recently risen to a peak of 19% on 7/20/2022.

Chart #2 is a great chart with the % reinfections.
would like to see the
1) % breakthrough of total cases
2) % breakthrough & reinfection of total cases.
3) % reinfections (as is shown in the chart above)
Those three would provide much broader insight into current state of the covid pandemic and understanding of the future trajectory
again thanks