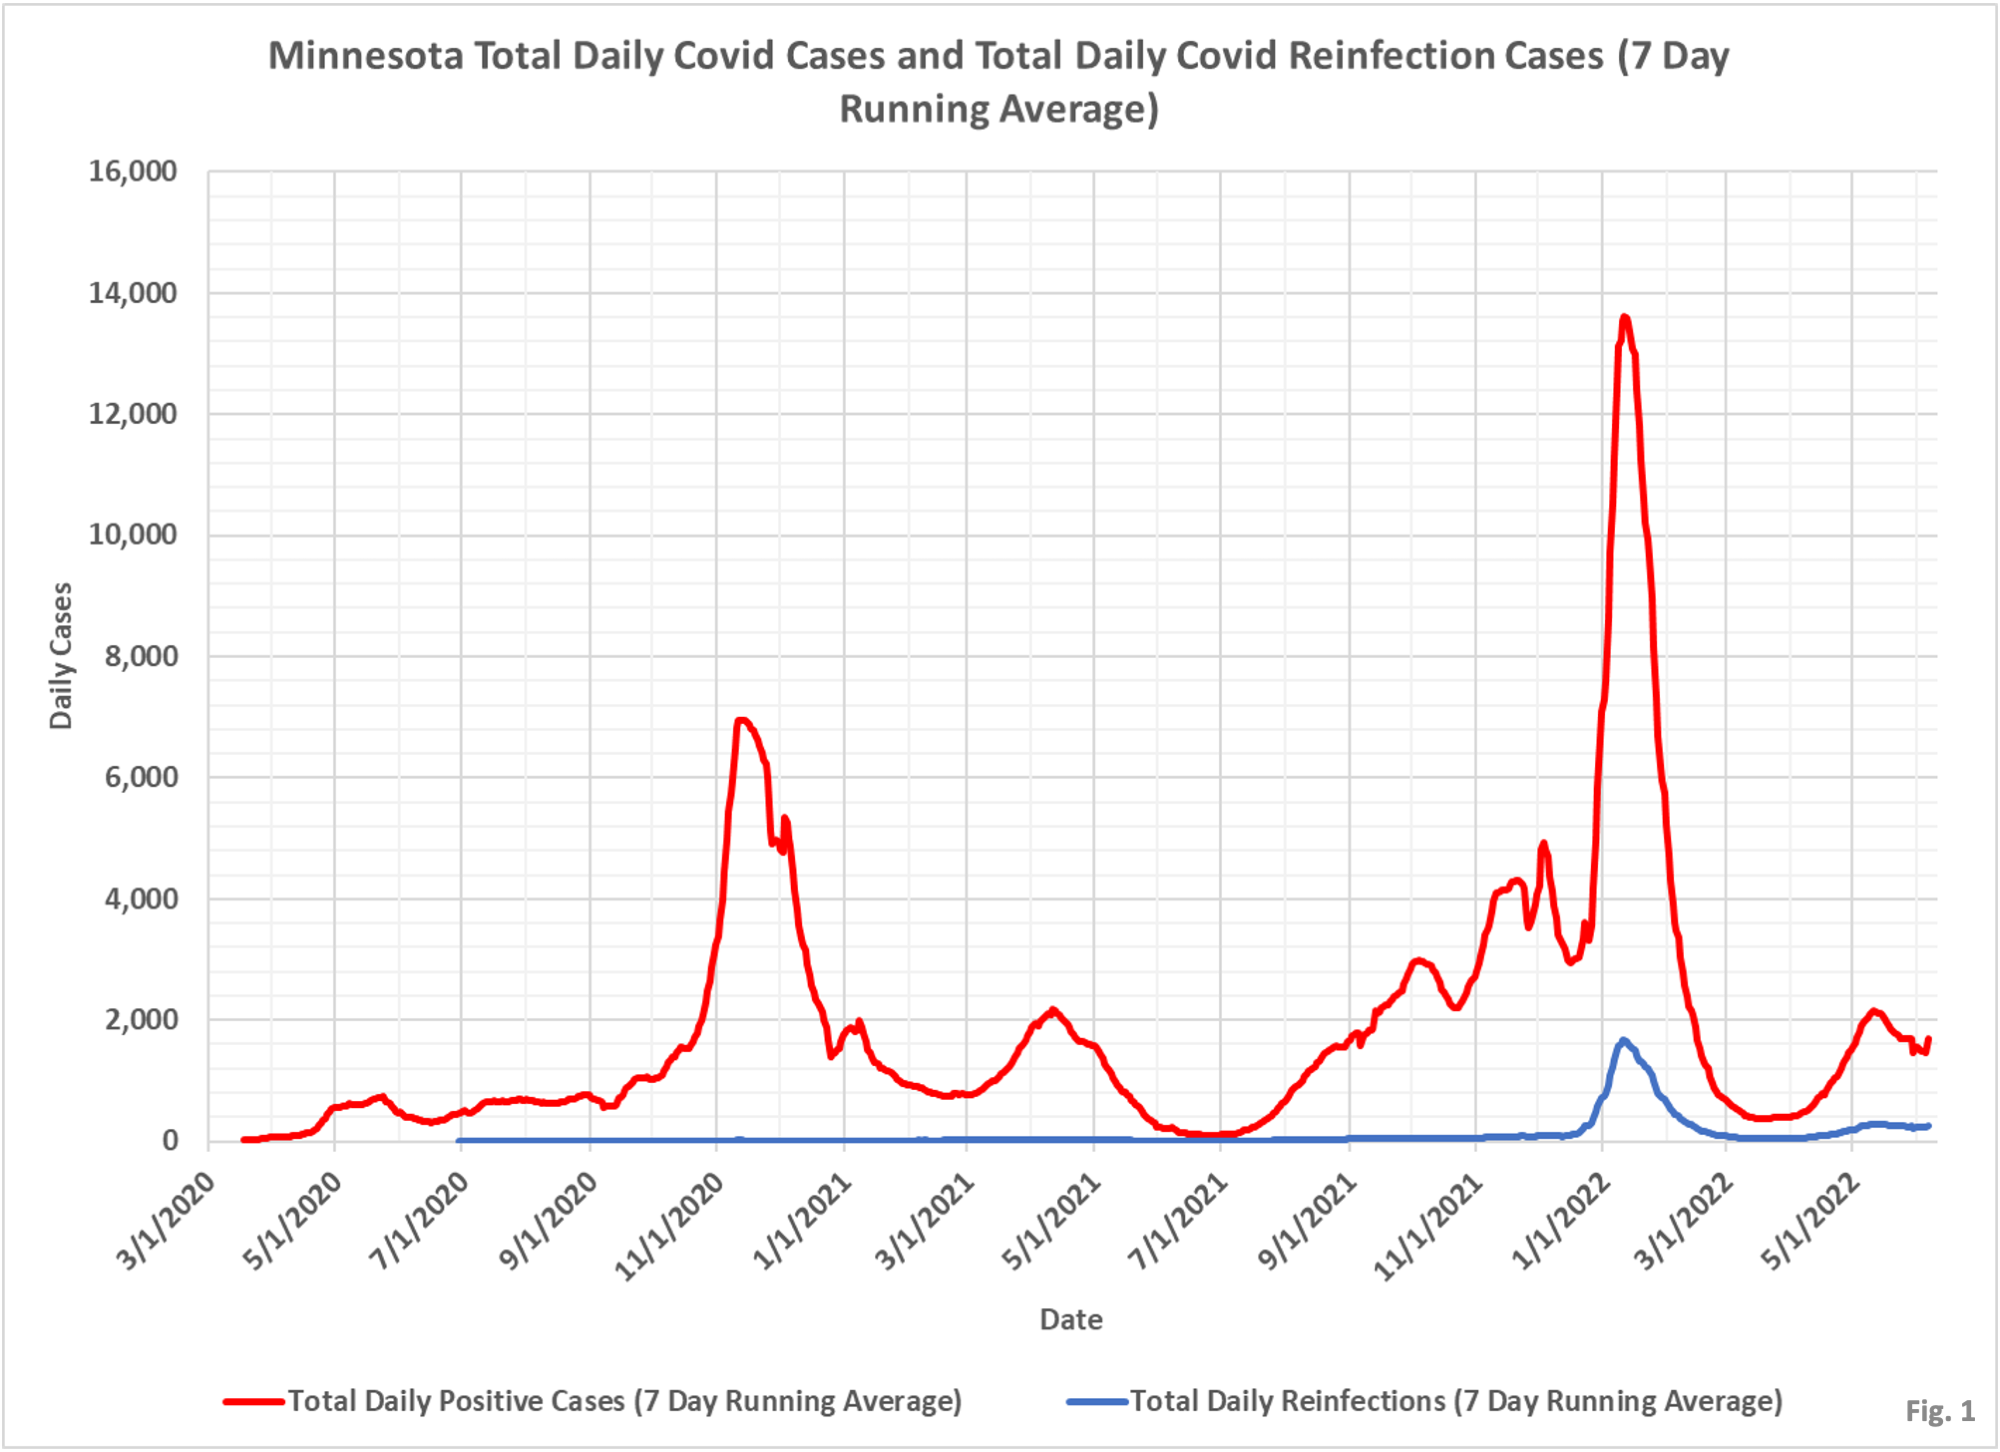
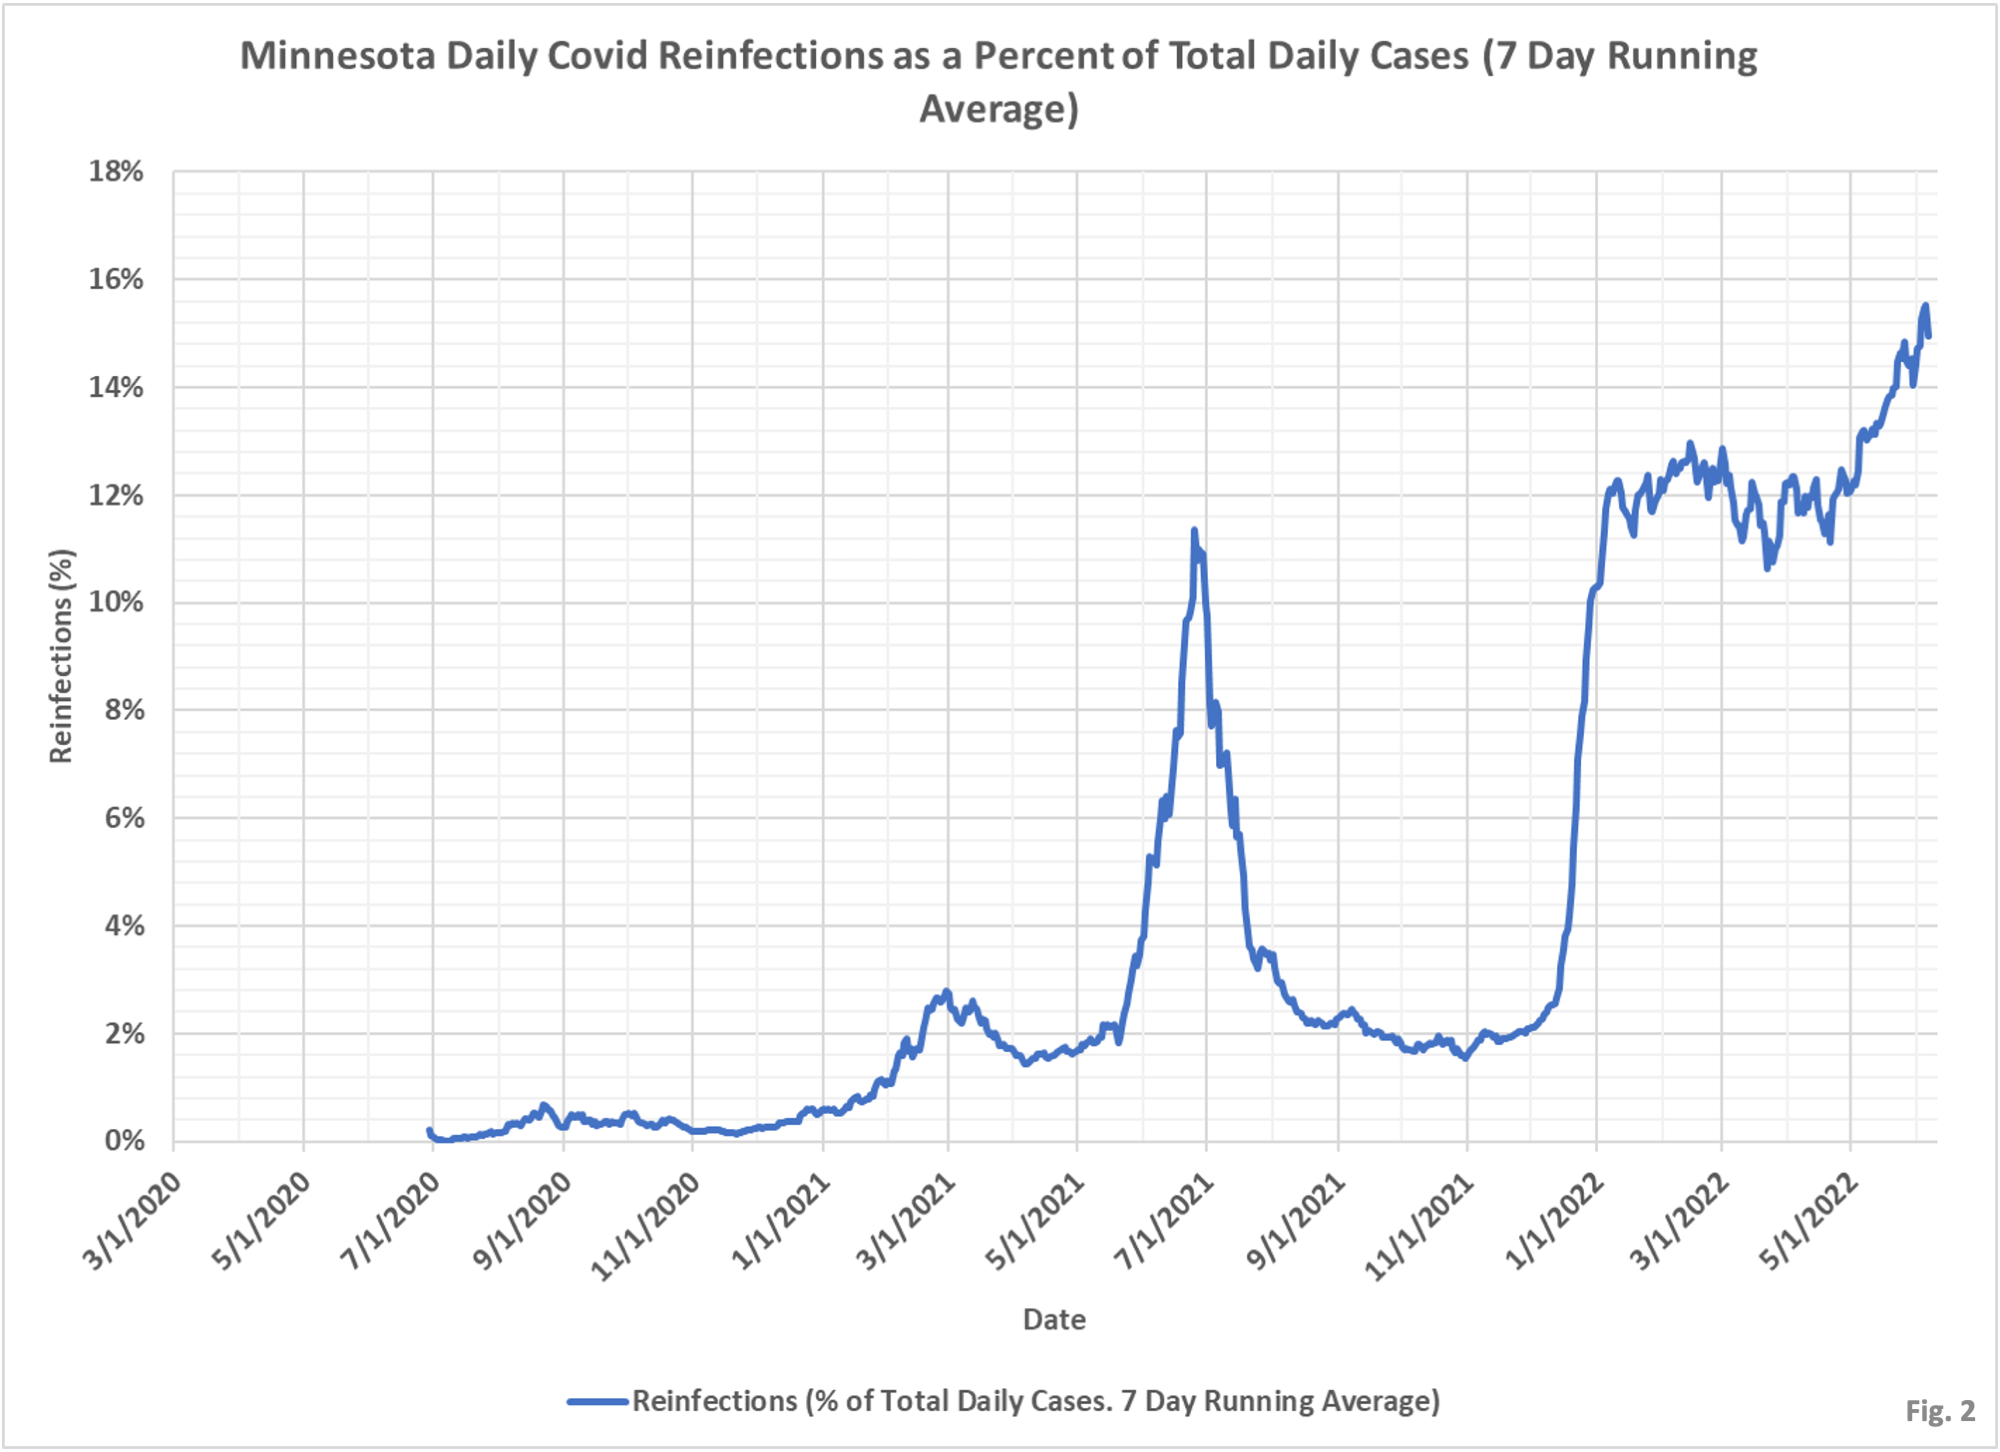
Not only are the vax worthless after a few months in terms of preventing infection, but a prior infection also seems to have waning effectiveness. The chart below indicates that reinfections are becoming an increasing percent of all cases. Now DOH won’t give out the data but a lot of these reinfections are in people who are also vaxed. Be very interesting to track all of that together.

 Dave’s notes:
- Fig. 1 displays the total daily Covid cases in Minnesota and the total daily reinfections. This data is published by date of positive test on the Minnesota Department of Health (MDH) Situation Update for COVID-19 web page: https://www.health.state.mn.
us/diseases/coronavirus/ situation.html . Both of these curves are plotted as 7 day running averages. In order to minimize incomplete reporting the last 7 days of data are excluded. Despite this, note that the daily total cases curve is quite choppy for the last week, possibly meaning that MDH is lagging behind on their reporting again. - Fig. 2 displays the proportion of daily reinfections to daily total cases, taking the ratio of the 7 day running averages. In the summer of 2021, when overall cases were extremely low, reinfections made up a significant proportion of the daily total cases. As the Delta variant accelerated in the Fall of 2021 the proportion of reinfections fell below 2%. Then, when the Omicron variant took off in the Winter of 2021/2022 reinfections rose again, and are continuing to increase as overall case activity wanes.


Kevin – Speaking of reinfections was curious if you saw this paper from Science and what you thought. https://www.science.org/doi/10.1126/science.abq1841