People are excited about this metric as a way to track the epidemic but I am not sure how useful it is, as Dave notes below. I had hoped it might be a way to ascertain true case levels in an era of home testing, but I don’t know that it does that. And it needs to be adjusted for average viral load, which changes during the epidemic and we don’t have information to do that adjustment, although DOH does. In any event, according to the wastewater, there is still a lot of CV-19 around.
 Dave’s notes:
- We last looked at correlations between wastewater and Covid case levels in Minnesota on June 1 here: https://healthy-skeptic.com/2022/06/20/wastewater-charts-june-17/. Recently, on 7/16/22, Jeremy Olson in the Star-Tribune has touted the effectiveness of wastewater monitoring for tracking Covid and other pathogens (https://www.startribune.com/how-wastewater-works-to-detect-covid-other-viruses-in-minnesota/600190785/) in an article that also gives some background on wastewater testing, and in an earlier article on 7/15/22 (https://www.startribune.com/coronavirus-variant-ba-5-makes-up-64-of-viral-load-in-twin-cities-wastewater/600190526/). In an article on 7/14/2022 he quotes Dr. Osterholm regarding the importance of wastewater sampling for determining the Covid virus levels in the population. It seems likely that the health authorities will use wastewater testing in the future for various purposes.
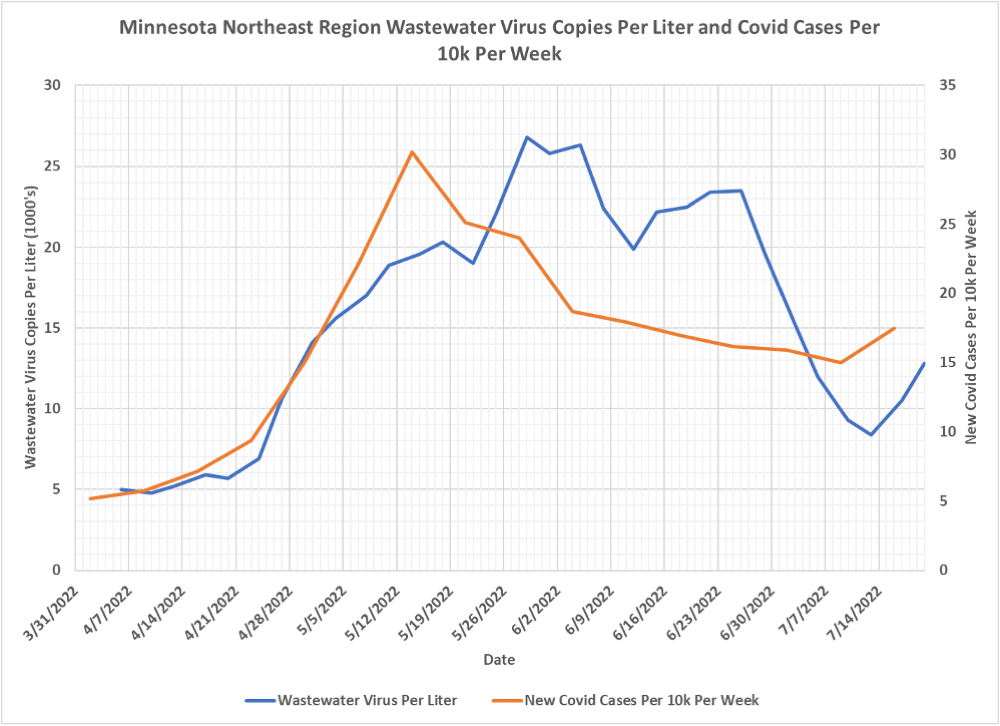
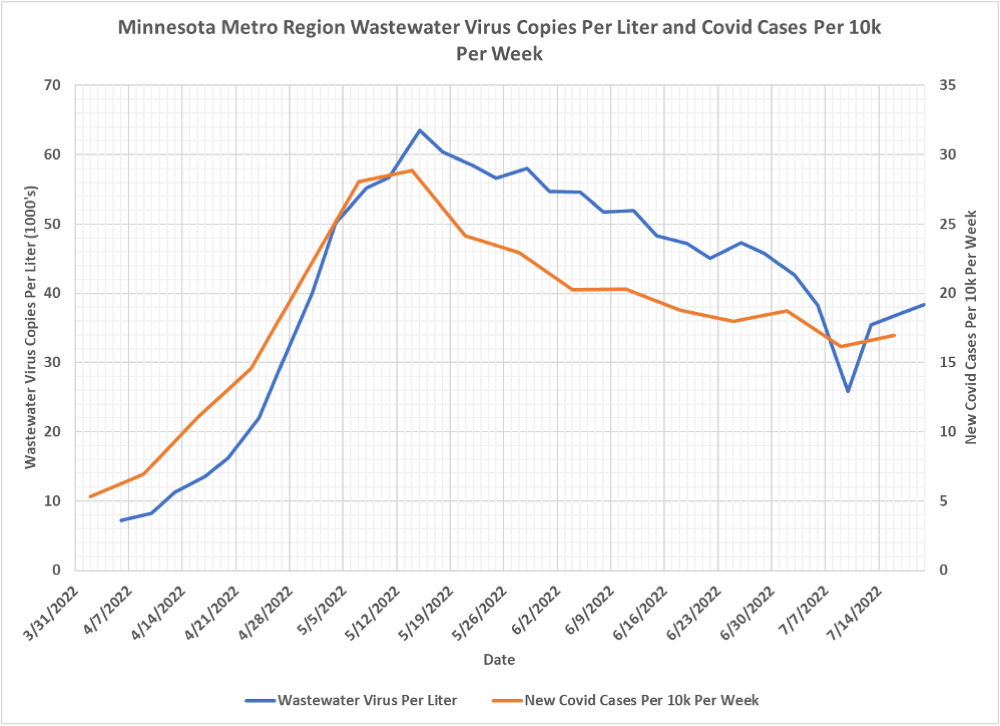
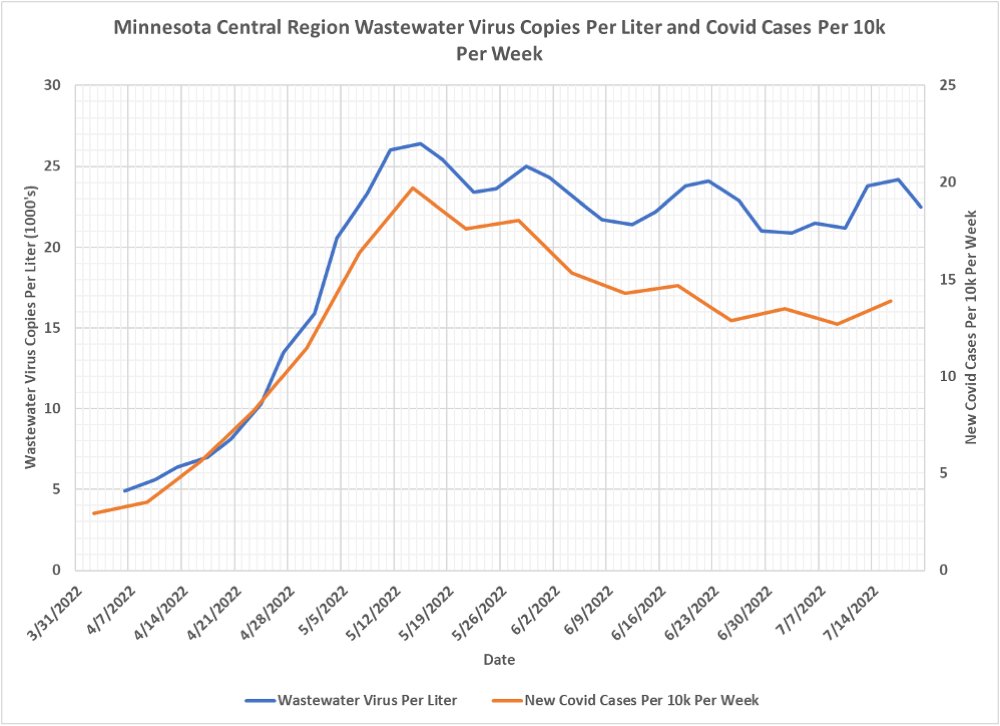
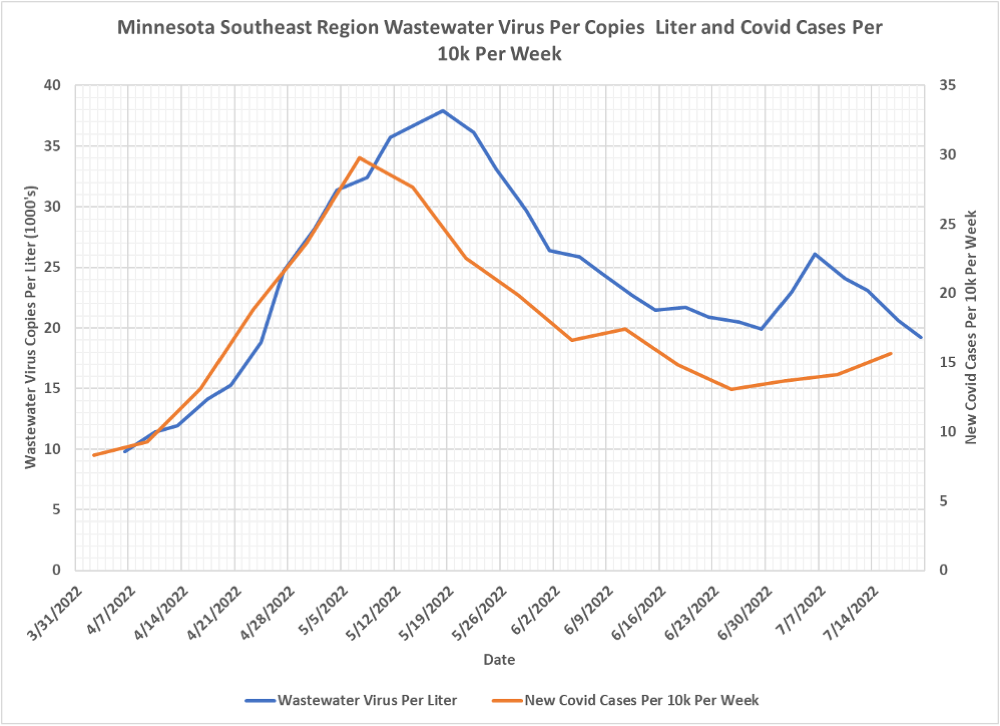
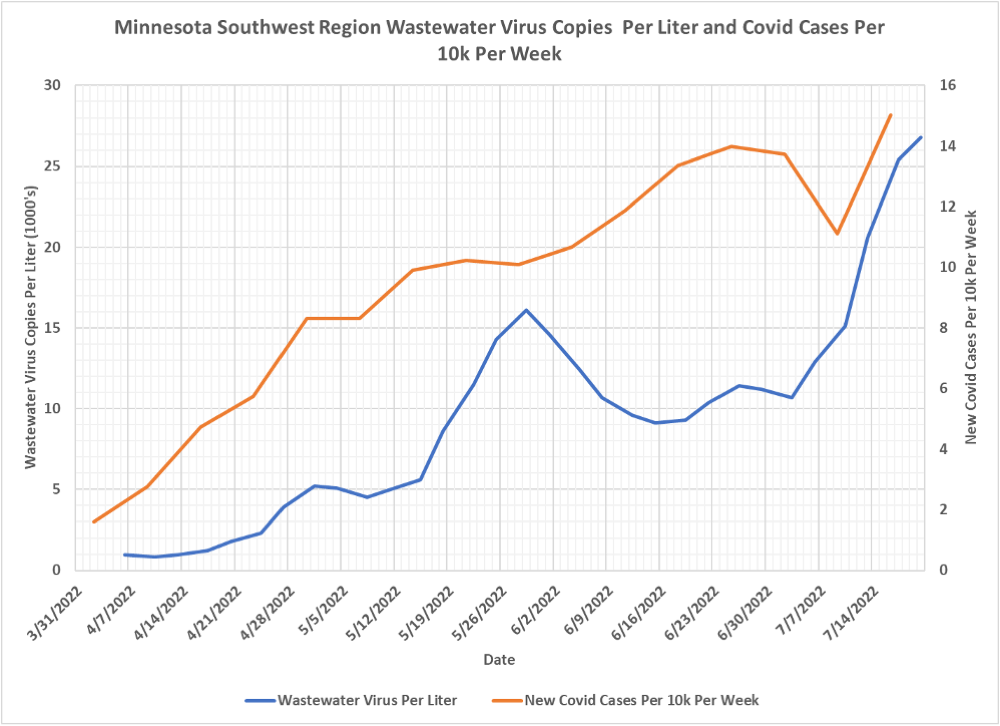
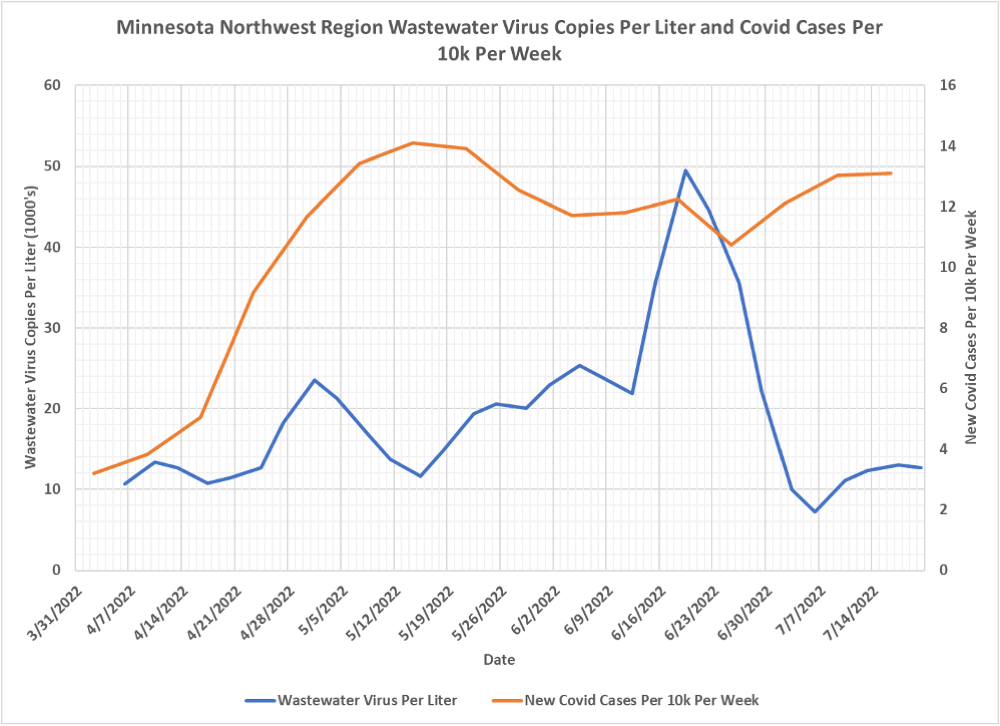
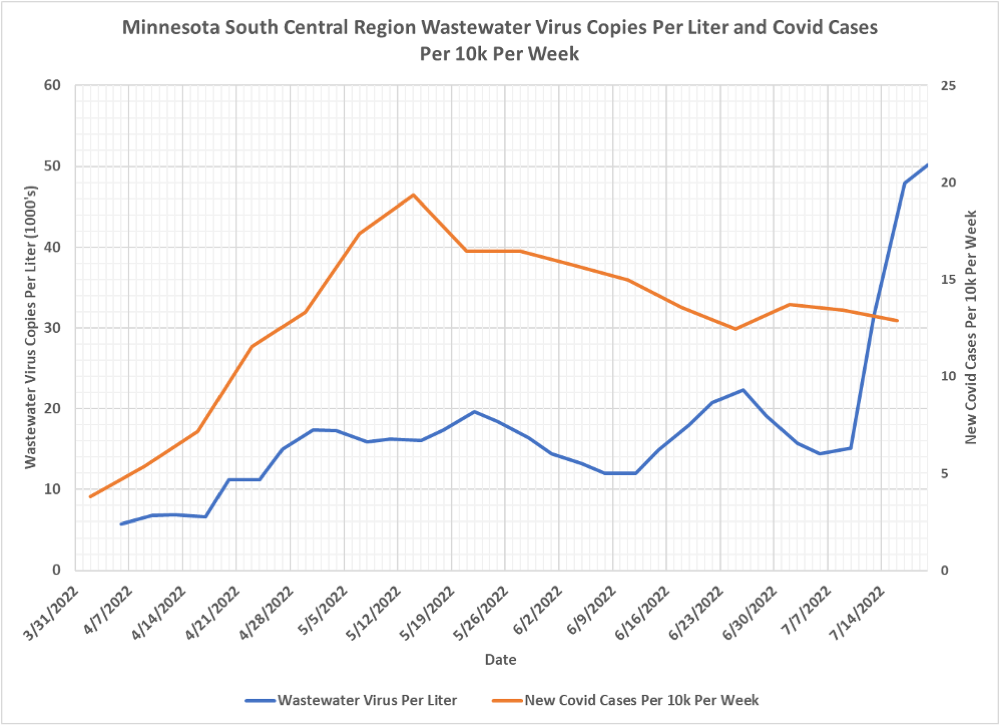
- It is not clear from charts how well wastewater analysis of Covid particles actually works. The first 5 of our regional charts appear to be fairly well correlated, but the last 2 charts for the Northwest and South Central regions do not appear correlated. On balance it does seem that there may be some validity to this approach.
- The University of Minnesota publishes summary data of Covid sampling of wastewater in Minnesota here: https://experience.arcgis.com/experience/a8d269bd670a421e9fd45f967f23f13c?data_id=dataSource_1-17ed5c83cca-layer-5%3A2 The U of M is monitoring wastewater plants for the presence of Covid indicators. They state that the amount of Covid detected in wastewater is predictive of clinical cases of Covid 1 to 2 weeks later. They also state that they are studying whether their metrics also correlate to hospitalizations.
- In the following charts we are plotting the U of M metric “Mean Weighted Average (N and O genes)” of virus copies per liter (blue curves) along with the newly reported covid cases per 10,000 residents in each region (red curves). We have yet to find any documentation describing exactly what the mean weighted average represents. For the purposes of this post it is assumed that the weighting process accounts for the differing populations in each region. For this reason we have chosen to plot Covid cases as the cases per 10k residents, rather than simply number of Covid cases per region.
- It is important to note that the U of M states that they changed their methodology on 3/15/2022. This means that the older data they publish, from 1/1/2021 to 3/15/2022, is not directly equivalent with the post-3/15/2022 data. We are only publishing the newer data in these charts. Also, the mean weighted metric we are displaying only starts on 4/6/2022. Some of the 4/3/2022 data points available last time have been deleted by the U of M, so they have been removed from the charts as well.
- The cases per 10,000 plotted in the charts are not the cases published by the U of M. Rather, we are taking cases per week per county from the Minnesota Department of Health Situation Update, https://www.health.state.mn.us/diseases/coronavirus/stats/case.html, from the data file “county.csv”, available in the notes under the graphic for Case Rate by County of Residence. This data file includes cases per week in each county, which we use to calculate the cases per 10,000 per week in each county, and then aggregated into the regional case rates.
