A reminder that the reason for the focus on age structure is that from the start it was apparent that CV-19 poses a serious risk only to those who are in poor health, who tend to be clustered in the elderly. So we saw and continue to see large numbers of cases in the young, but hospitalizations and deaths are largely in the older age groups. Minnesota’s data quality has deteriorated and it is harder to figure out the issues, but Dave continues to do his best. Case numbers are vastly understated due to home testing and people returning to the wise practice of ignoring colds. Hospitalizations are vastly overstated, due to the incidental issue. And deaths have always been over-attributed using the goofy method applied only to CV-19.
 Dave’s notes:
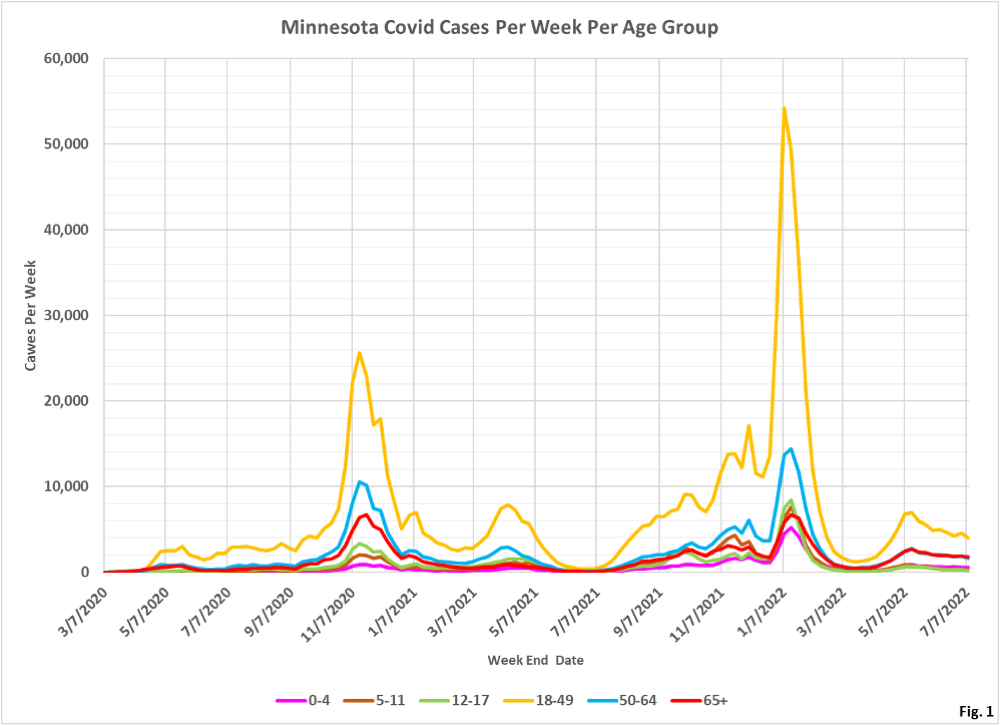
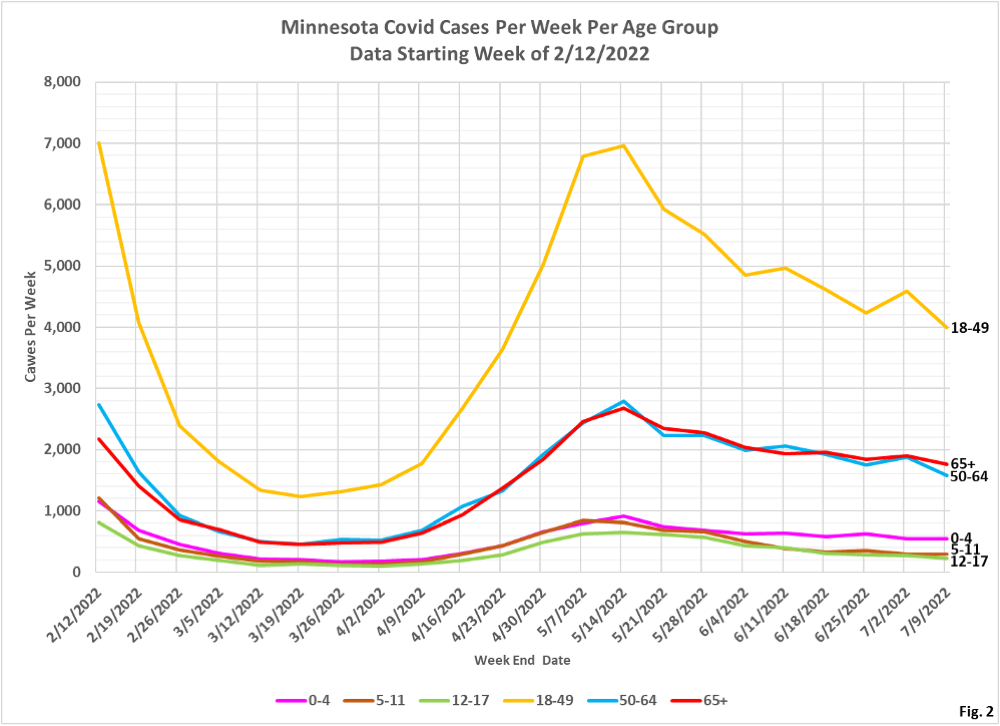
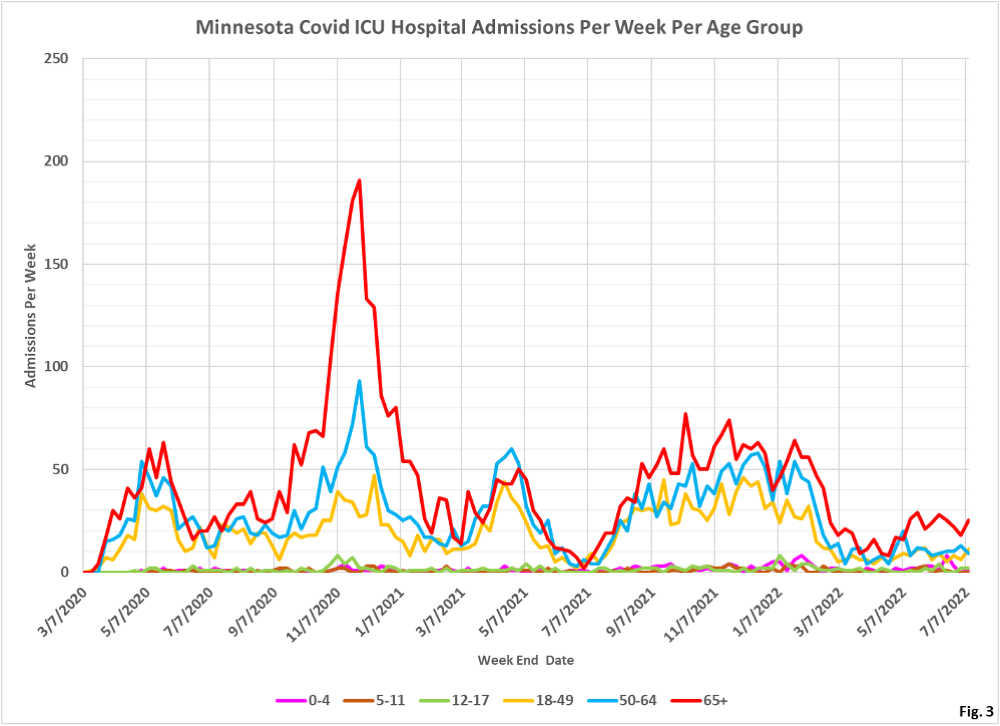
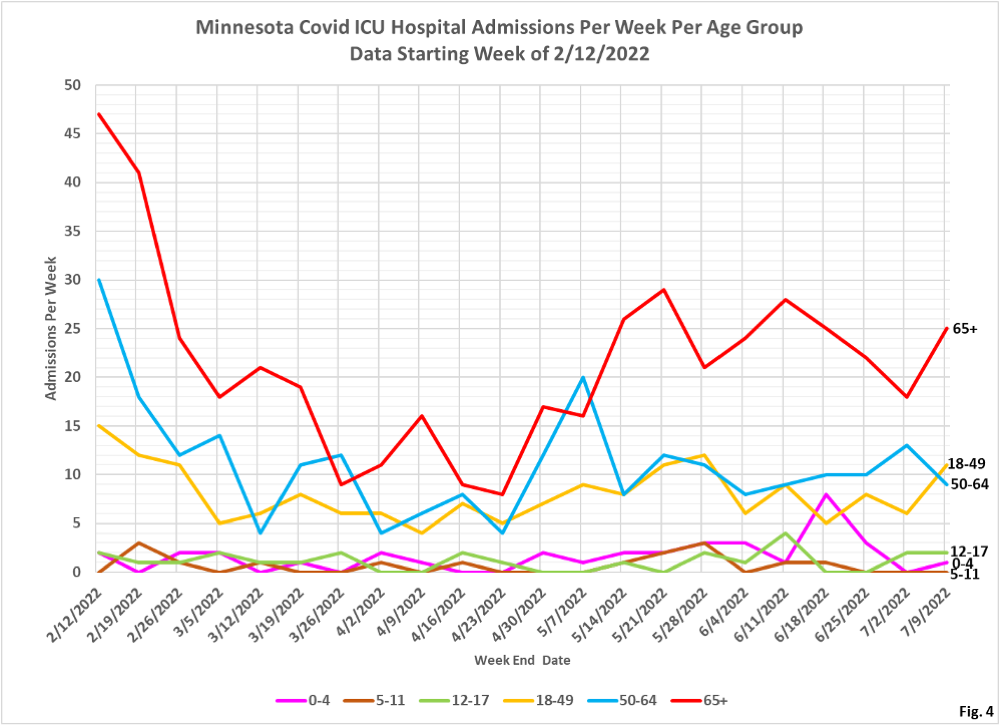
- These age structure charts display the number of Covid cases, ICU hospital admissions, non-ICU hospital admissions, and deaths in Minnesota each week, sorted by age group. These are an update of last week’s charts published here: https://healthy-skeptic.com/2022/07/12/age-structure-charts-raw-numbers-july-11/
- The data for the charts on cases comes from the data file “cage.csv”, Case Rate by Age Group, available here: https://www.health.state.mn.us/diseases/coronavirus/stats/case.html. The link to the data file is located in the notes under the graphic “Case Rate by Age Group”. Similarly, the data for hospital admissions is taken from the data file “hage.csv”, Hospitalization Rate by Age Group available here: https://www.health.state.mn.us/diseases/coronavirus/stats/hosp.html . The data in this data file is plotted without modification except that we are taking the difference between total hospital admissions and ICU admissions in order to display non-ICU admissions. Finally, the data for deaths is taken from the data file “dage.csv”, Mortality Rate by Age Group, available here” https://www.health.state.mn.us/diseases/coronavirus/stats/death.html.
- Fig. 1 and 2: Covid Cases Per Week. The reported Covid cases this week are continuing the gradual declining trend. Last week’s slight increase in cases for the 18-49 age group has reversed this week. Compared to prior surges, the rate of decrease from the most recent surge continues to be extremely gradual.
- Fig. 3 and 4: ICU Covid Admissions Per Week. Last week we noted sharp decreases in the number of ICU admissions for the 18-49 and 65+ age groups, for the week ending 7/2/2022. These decreases have been revised away this week. For example, for 7/2/2022, last week there were 12 reported admissions for the 65+ age group. This week MDH reported 18 admissions for the 65+ age group, and 25 admissions for the week ending 7/9/2022.Similar revisions occurred in the admissions for the 18-49 age group. It is possible that the Fourth of July holiday caused a delay in reporting. The switch from daily to weekly reporting of data by MDH several weeks ago severely limits our ability to detect and quantify delays in reporting.
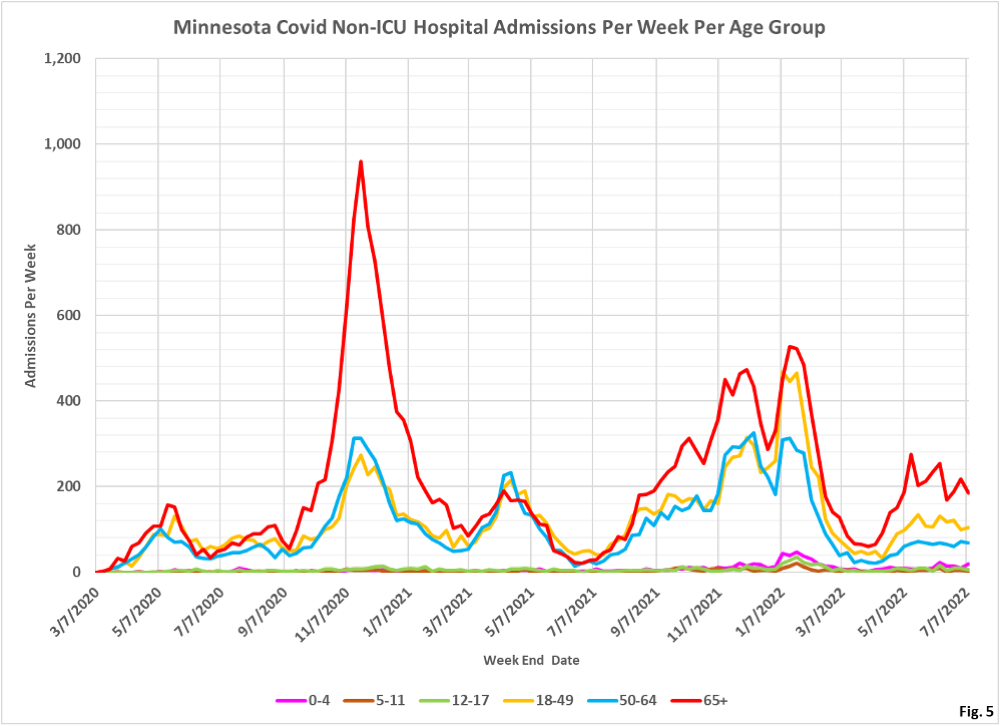
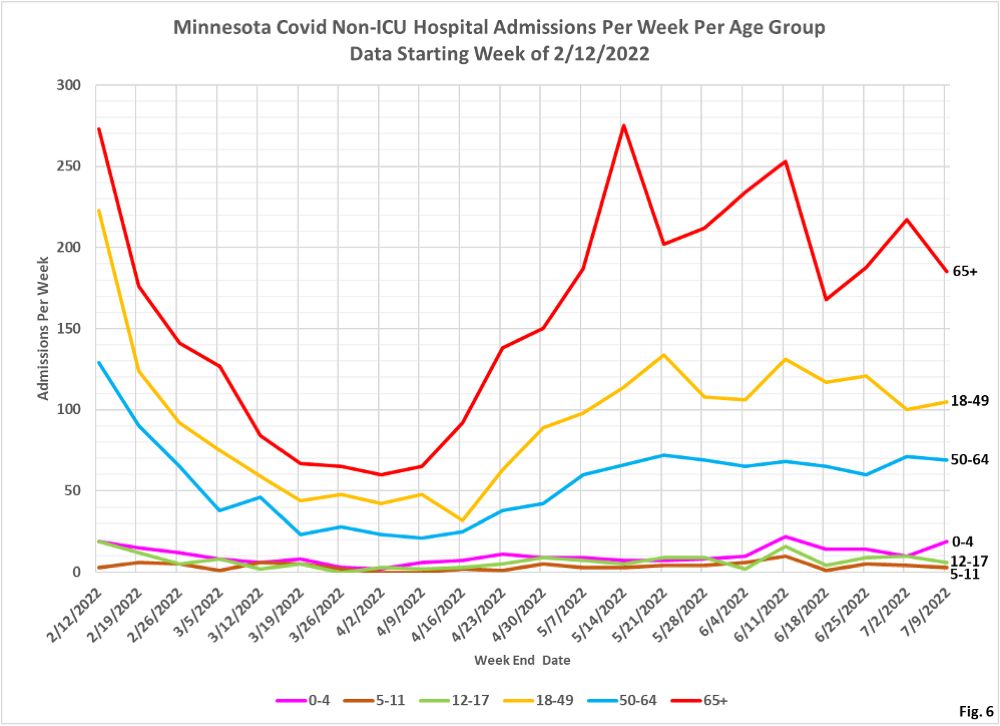
- Fig. 5 and 6: Non-ICU Covid Admissions Per Week. Similar to the situation for ICU admissions, the sharp decreases in non-ICU admissions for the week of 7/2/2022 for the 18-49 and 65+ age groups were revised significantly higher this week.
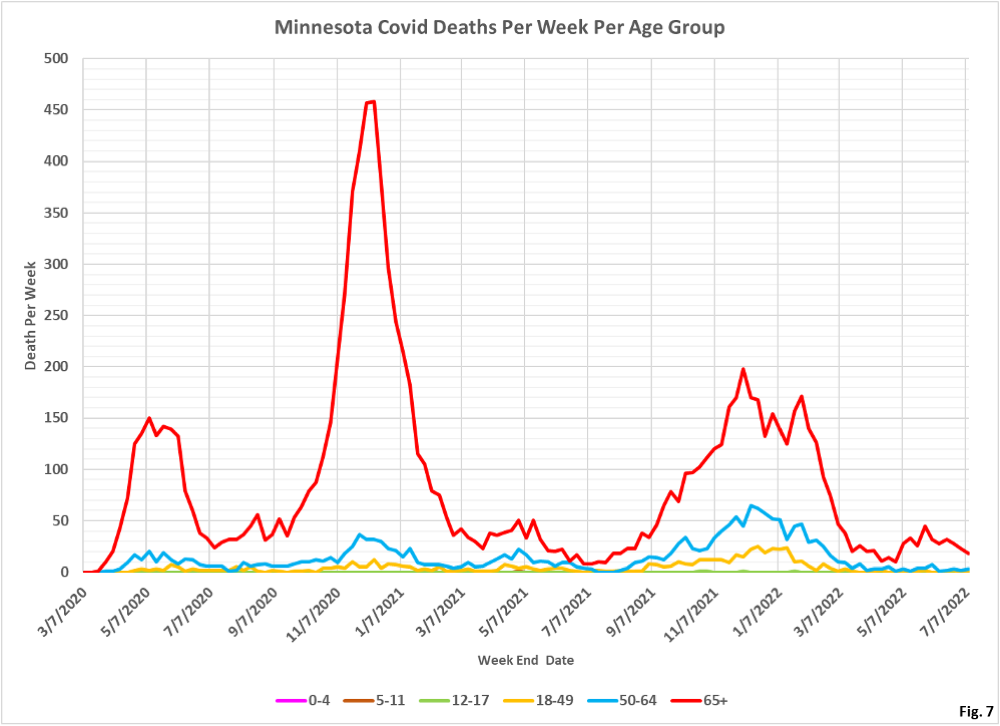
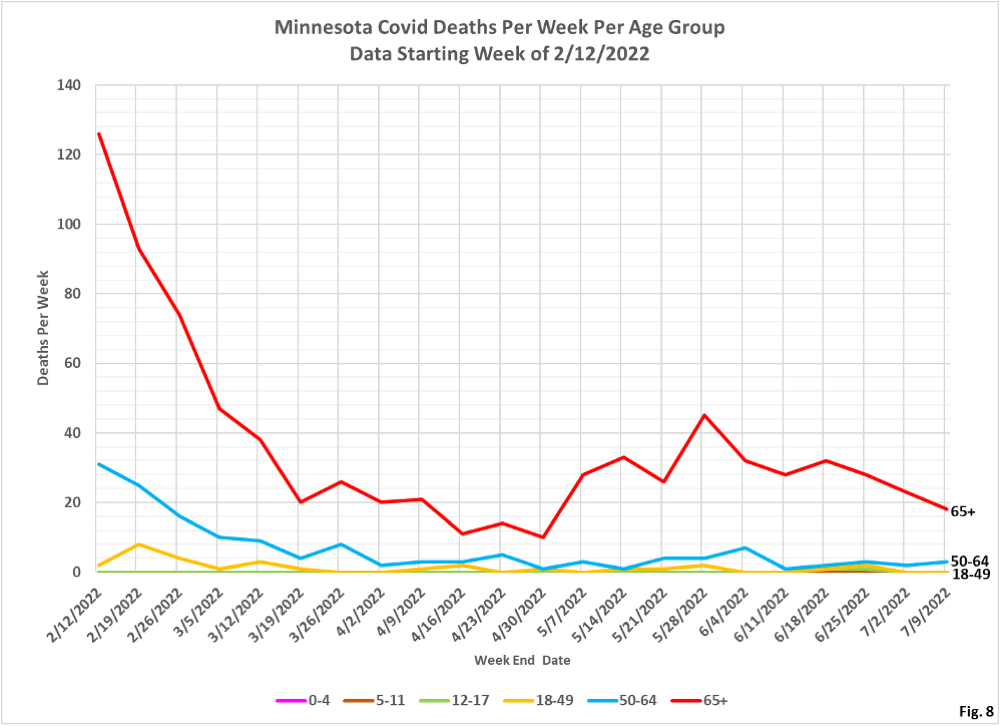
- Fig. 7 and 8: Covid Deaths Per Week. Deaths continue to gradually decline, with only relatively minor revisions to last week’s data.
