Events by age group allows better comparison of the impacts of the epidemic by age.
 Dave’s notes:
- These age structure charts display the number of Covid cases, ICU hospital admissions, non-ICU hospital admissions, and deaths in Minnesota. These are an update of last week’s charts published here: https://healthy-skeptic.com/2022/07/08/new-age-structure-charts-raw-numbers/.
- The data for the charts on cases, hospital admissions, and deaths comes from the data file “cage.csv”, Case Rate by Age Group, available here: https://www.health.state.mn.us/diseases/coronavirus/stats/case.html. The link to the data file is located in the notes under the graphic “Case Rate by Age Group”. The data in the data file is plotted without modification except that we are taking the difference between total hospital admissions and ICU admissions in order to display non-ICU admissions.
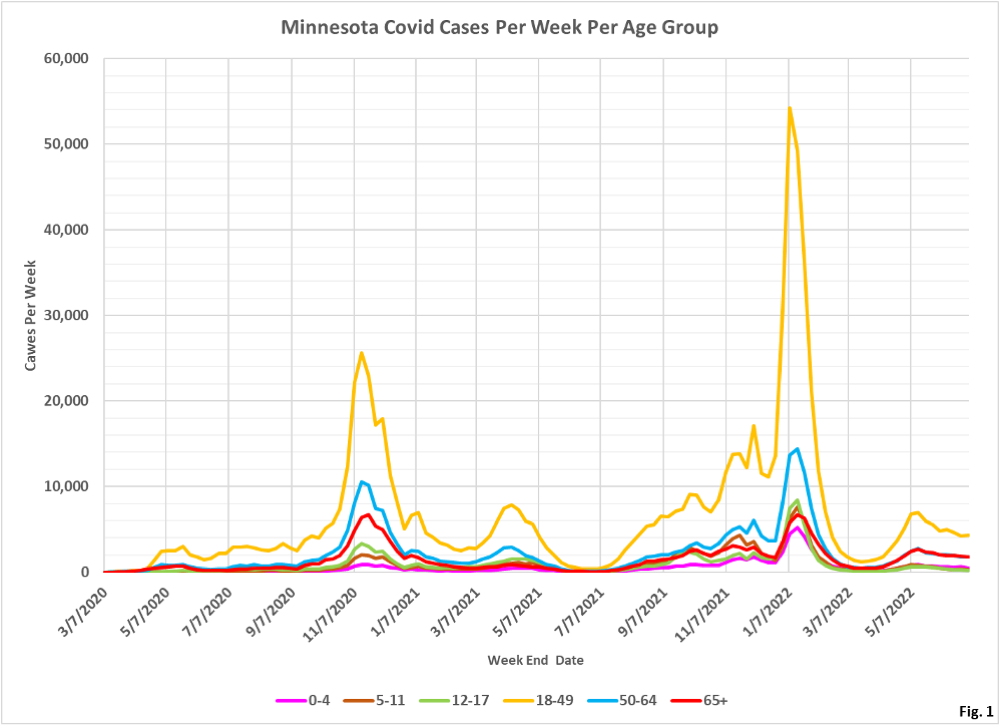
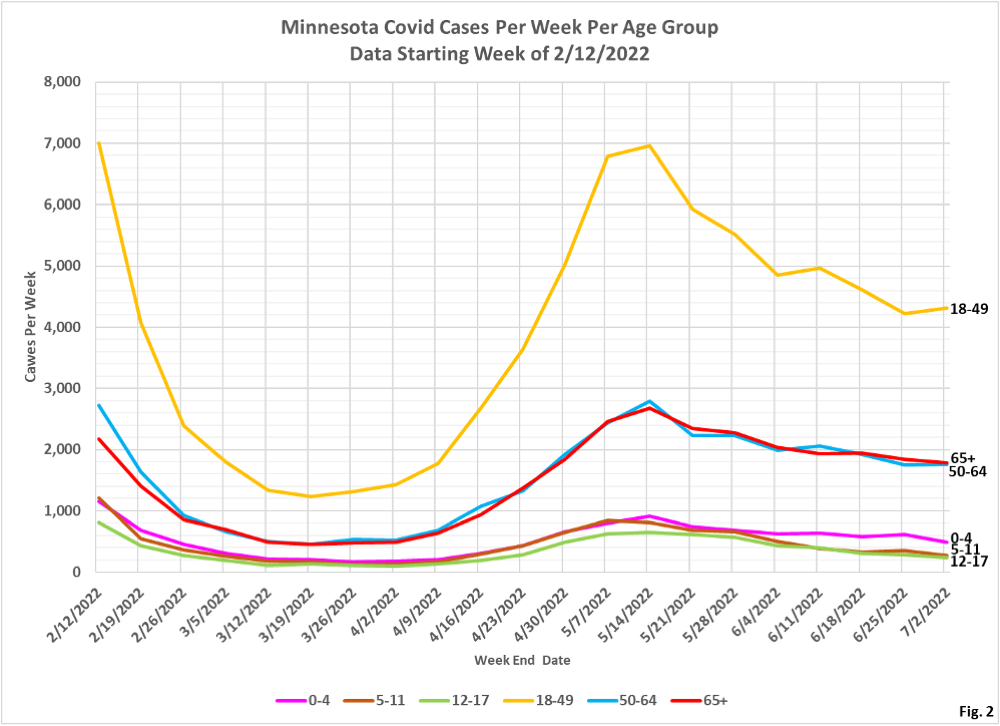
- Fig. 1 and 2: Covid Cases Per Week. The reported Covid cases this week are continuing the gradual declining trend. The 18-49 age group had a slight increase, as seen Fig. 2, but this may be just noise in the data..
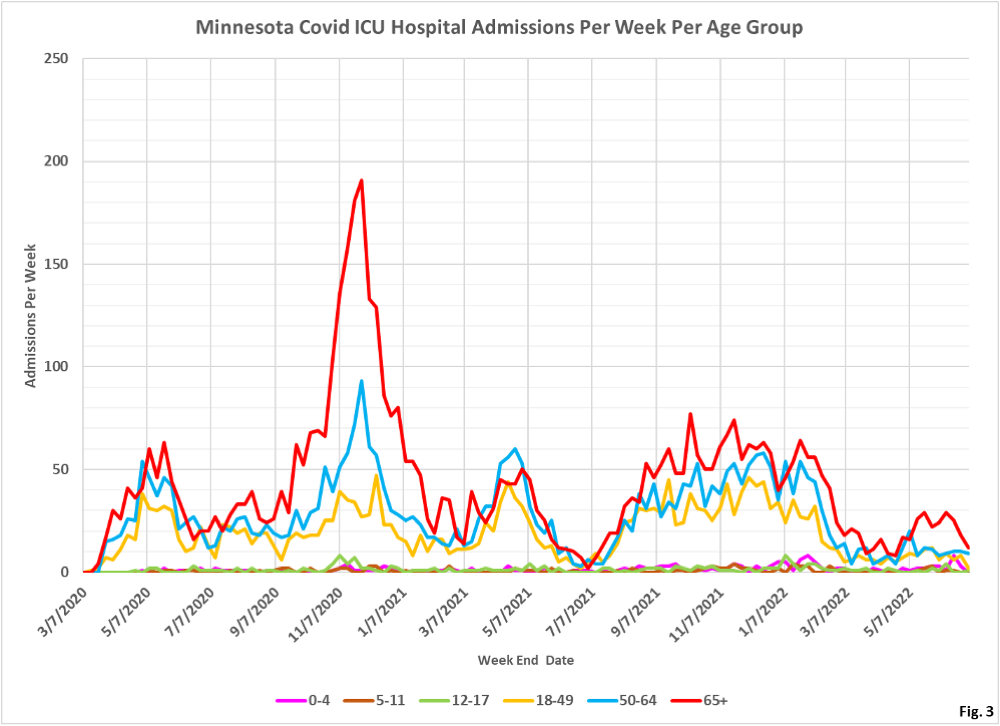
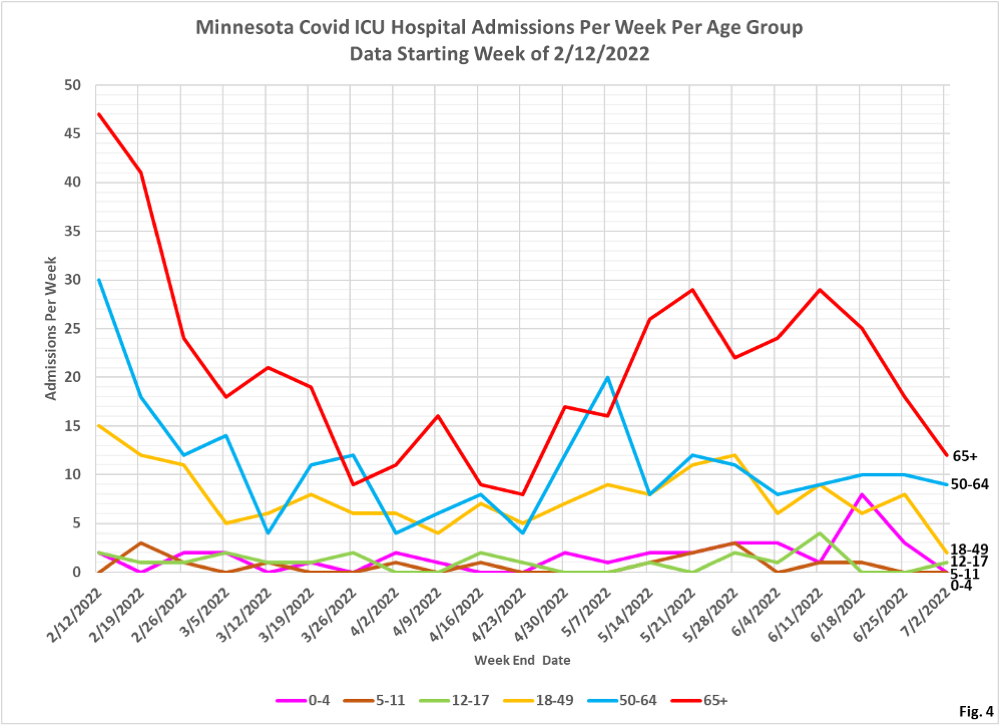
- Fig. 3 and 4: ICU Covid Admissions Per Week. ICU admissions declined sharply this week, especially the 18-49 and 65+ age groups.
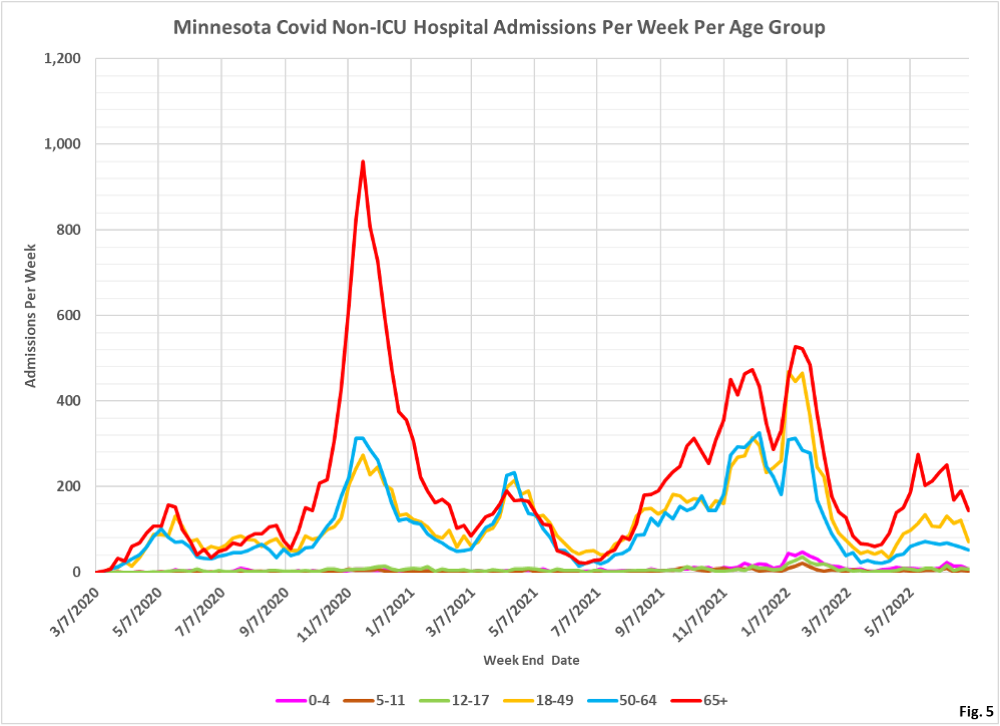
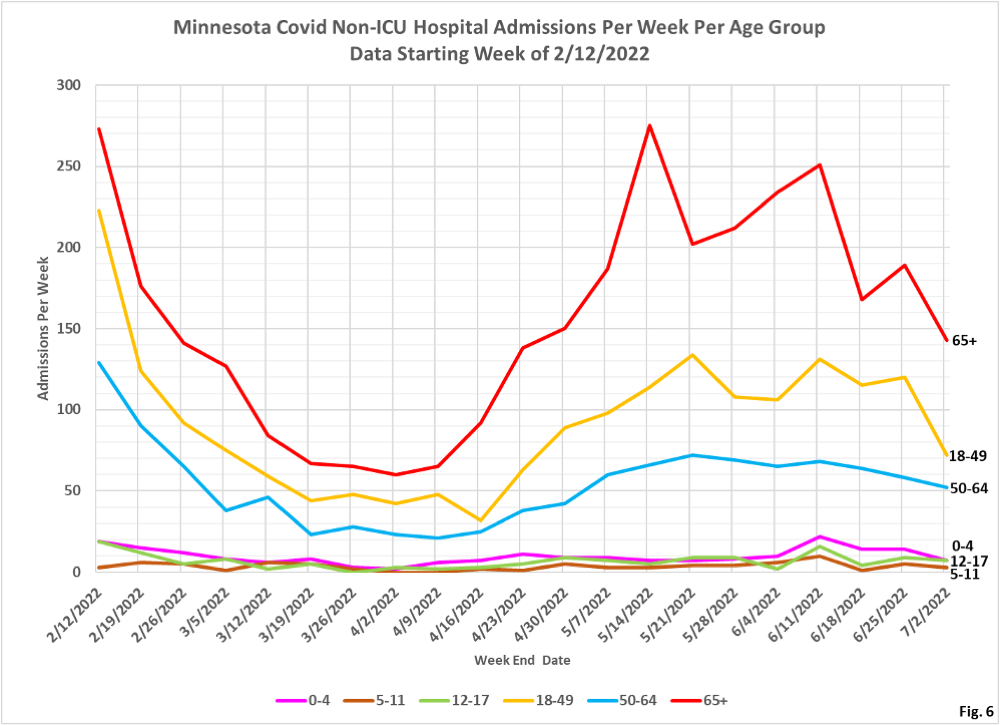
- Fig. 5 and 6: Non-ICU Covid Admissions Per Week. Non-ICU admissions also declined sharply, lead by the 18-49 and 65+ age groups.
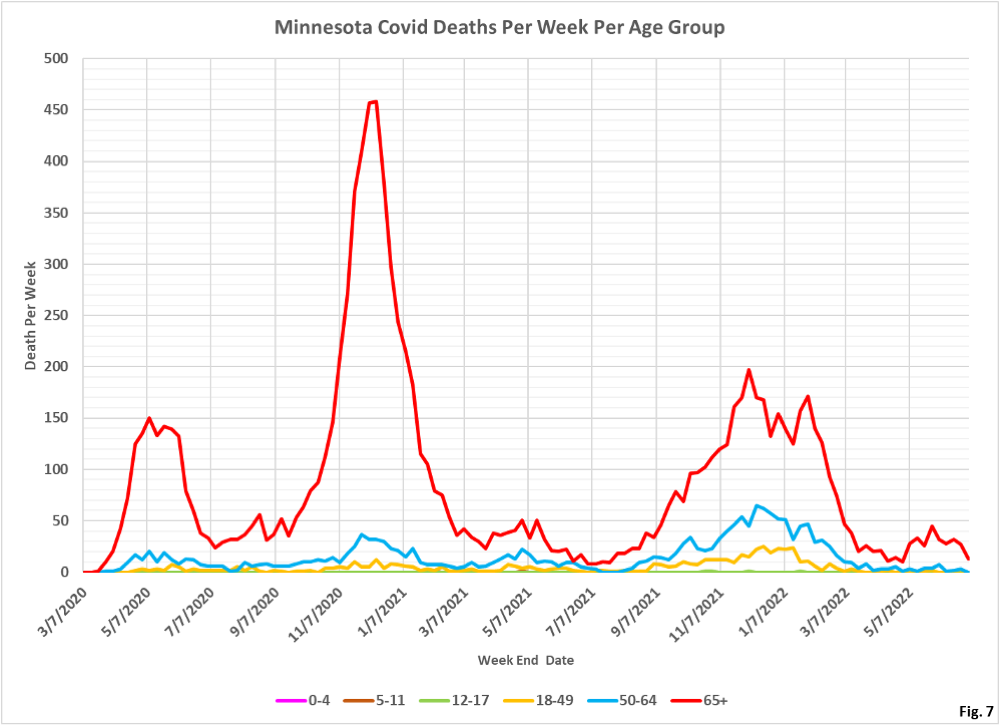
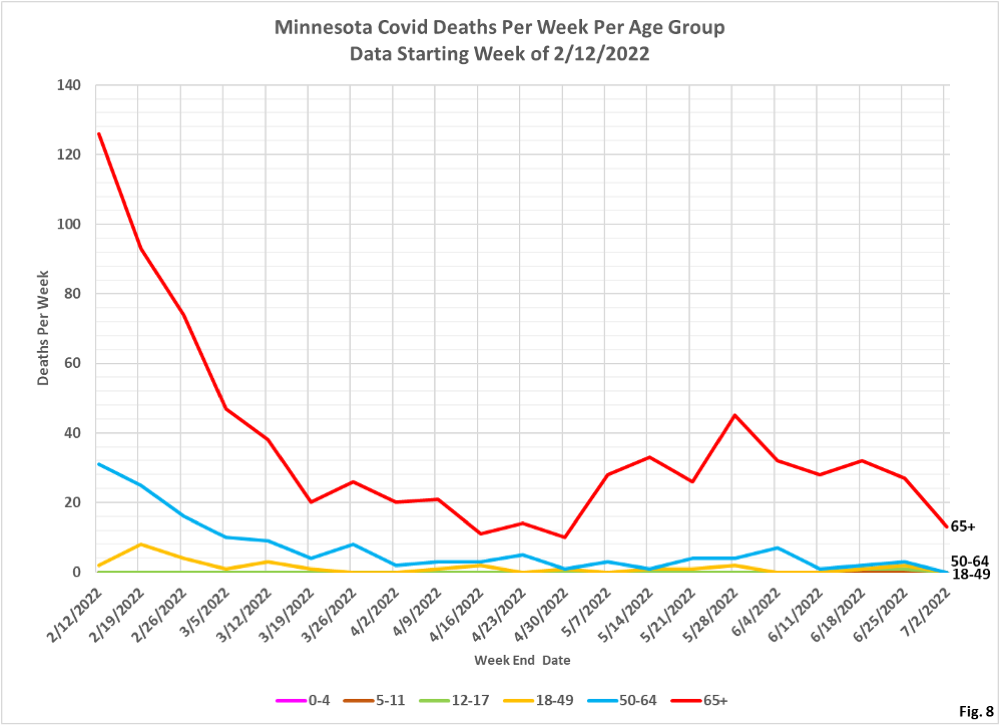
- Fig. 7 and 8: Covid Deaths Per Week. Deaths in the 65+ age group are declining sharply, but reporting lags may contribute to the apparent reductions in deaths.
