Dave was able to put together the usual charts even with the new data set. As Dave notes, there is something odd going on with DOH processing. We see a rise in unvaxed cases in older groups. I am assuming this is slow processing. Remember that identification of vaxed cases is just bucket shifting. The case may initially be reported as unvaxed, but DOH is supposedly checking everything against the list of those vaxed and then cases get moved. With the holiday weekend and less resources in general being devoted to CV-19, it is likely that we are seeing some delay in the vax identification process. Or DOH is experiencing its usual competence issues.
 Dave’s notes:
- The noteworthy artifact seen in this week’s breakthrough data is the sharp increases in Covid cases among the unvaccinated, while cases in the vaccinated and in the boosted continue a gradual decline. This uptick can be seen in Fig. 1 through Fig. 4. The increase is seen in the raw data published by MDH, but at this time it is not known if there is a data problem at MDH or if this represents an actual increase in cases. It is possible that the change in data reporting that MDH implemented on 6/27/2022 may have caused a discontinuity in the data, which will reverse next week as everything gets updated.
- This is an update of overall population breakthrough data that the Minnesota Department of Health (MDH) first published on 5/23/2022 and updated each week since. Starting on 7/07/2022 the weekly data files were published on Thursday rather than Monday, however the week start and end dates in the data files did not change. The breakthrough data is available here: https://www.health.state.mn.us/diseases/coronavirus/stats/vbt.html.
- We last published data tables and charts for the overall age group on 6/28/2022, for the data released by MDH on 6/27/2022, here: https://healthy-skeptic.com/2022/06/28/breakthrough-events-june-27/.
- The charts in Fig. 2 through 10 continue 3 charts for each type of event (cases, admissions, or deaths). The first chart for each type is the number of events each week. This chart helps illustrate the overall trend on the pandemic for the overall population, and what the impact is on society. The second chart is the rate of events per 100k each week. This chart displays the risk to an individual of the each category at different times during the pandemic. The third chart for each type of event is the proportions of event compared to the proportion of the population type (unvaccinated, vaccinated, or boosted). This chart helps show whether or not vaccination or boosting is effective in reducing the impact of the pandemic, by comparing the proportion of events to the proportion of the population.
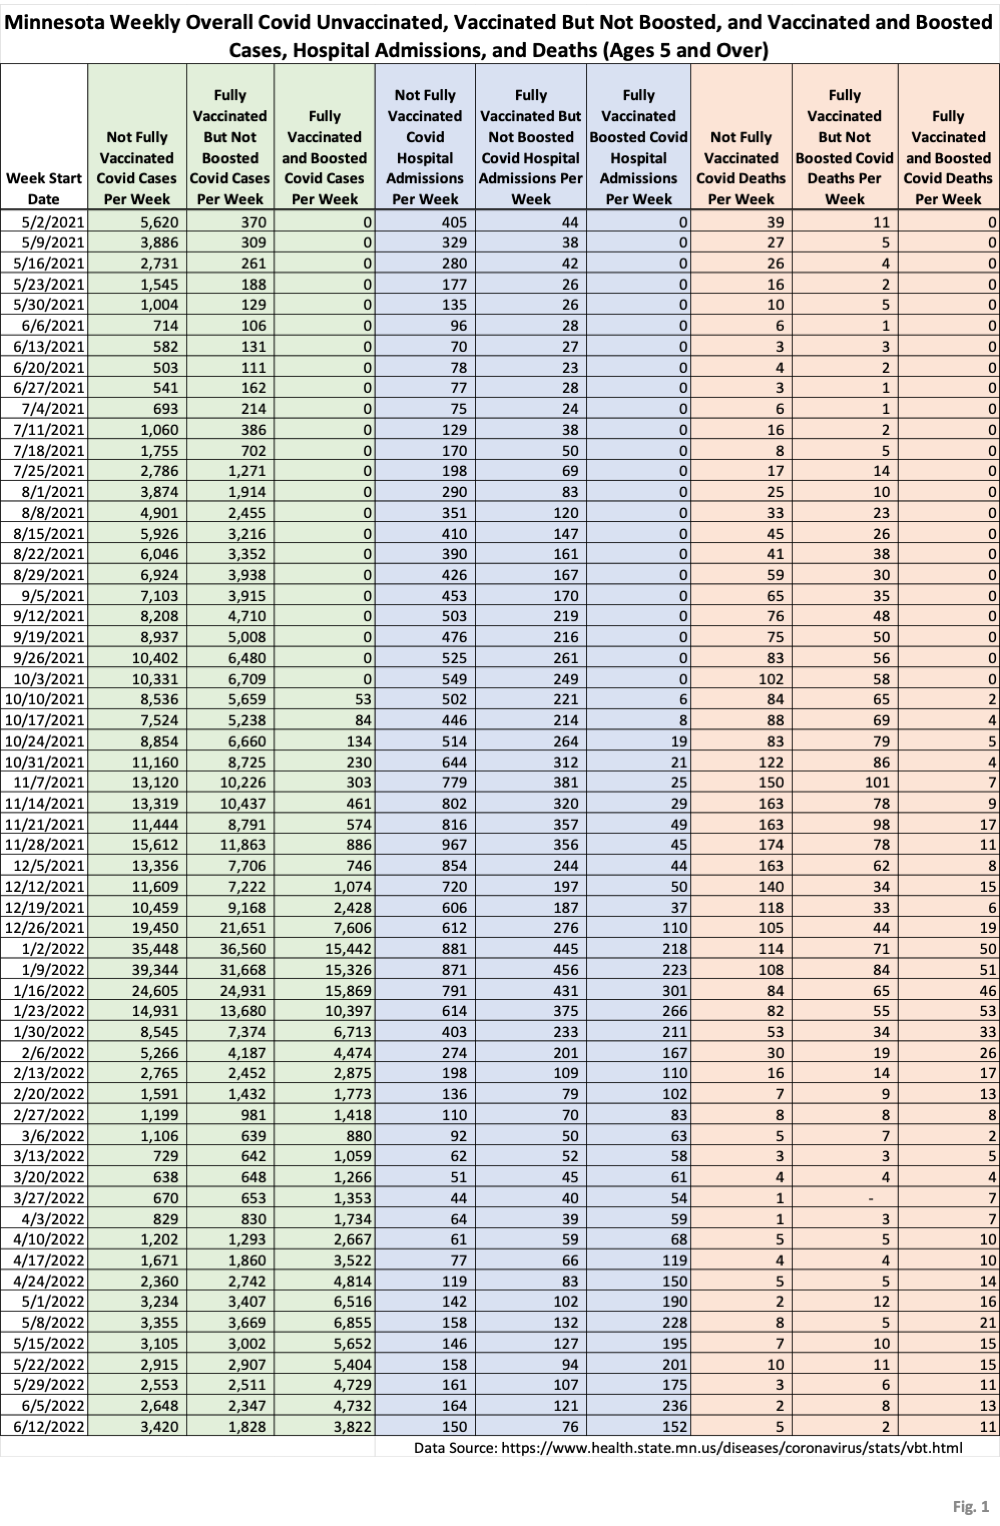
- Fig. 1: This table displays the total cases, hospital admissions, and deaths that occurred each week among the unvaccinated, vaccinated but not boosted, and vaccinated and boosted populations, with the latest week of 6/12/2022, one additional week compared to last week’s publication. This data is obtained from the data files vbtadultcirates.xlsx and vbtpedocirates.xlsx, available in the notes under the graphics on the MDH Vaccinate Breakthrough Weekly Update web page https://www.health.state.mn.us/diseases/coronavirus/stats/vbt.html. The week of 6/12/2022, last row of data shows, that unvaccinated cases had an increase for the week, while vaccinated cases, boosted cases, hospital admissions, and deaths continue to slowly decline. The approximately 30% increase in unvaccinated cases does not make sense, compared to the decline in vaccinated and boosted cases which continued on the previous trend.
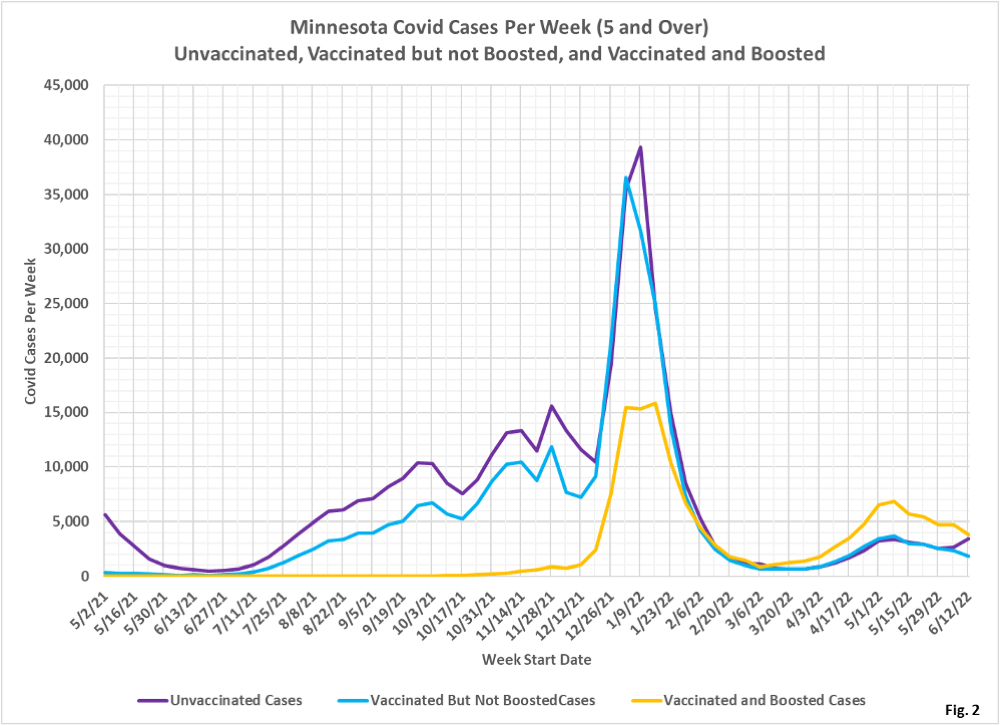
- Fig. 2: This chart simply plots the cases among the unvaccinated, vaccinated but not boosted, and vaccinated and boosted populations each week, as found in Fig. 1. Note that the greatest number of cases continue to be among the boosted in the most recent weeks, in contrast to earlier in the pandemic when the unvaccinated and the unboosted had the largest number of cases.
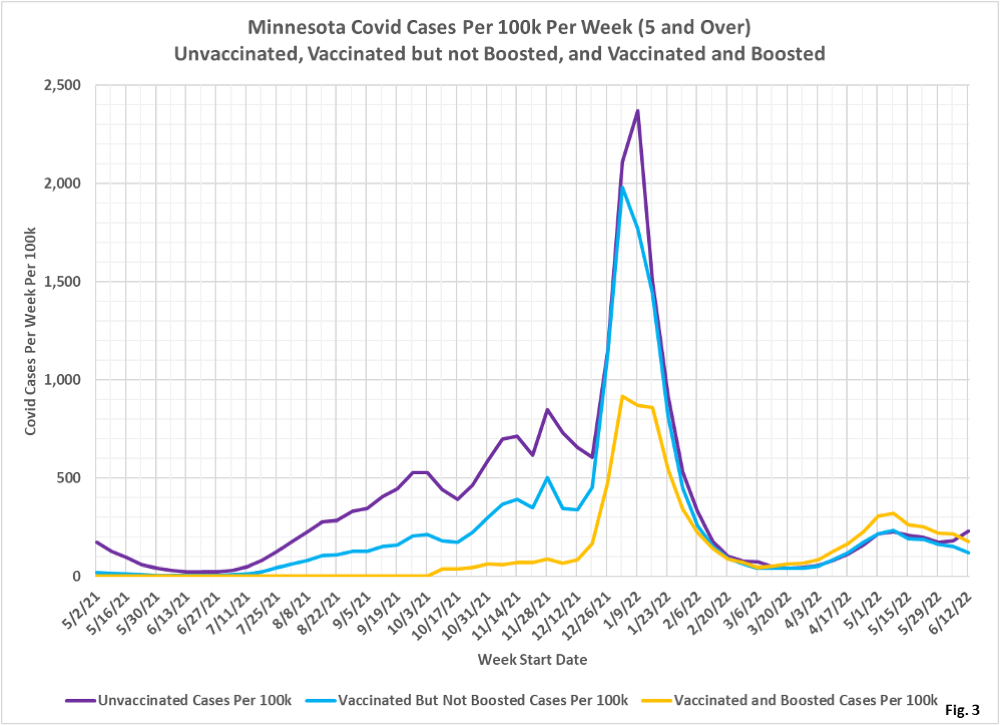
- Fig. 3: This chart displays the case rates per 100k for each group. Note that since March 2022 the highest case rates continue to be among the boosted, while the case rates among the unvaccinated and unboosted are almost identical since 1/23/2022. The case rate per 100k for the unvaccinated for 6/12/2022 shows a similar increase to the cases in Fig. 2.
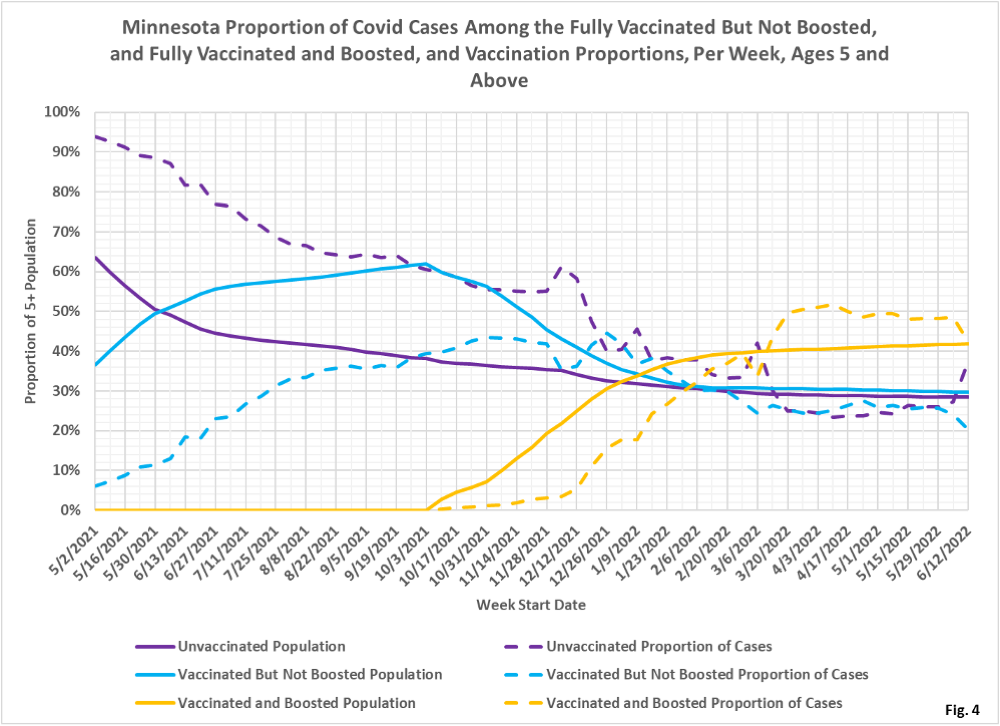
- Fig. 4: This chart displays the proportion of the 5 and over population who are unvaccinated (solid purple), vaccinated but not boosted (solid blue), and vaccinated and boosted (solid gold). For each population group we also display the proportion of cases each week (dashed lines of same color). The way to interpret this chart is to compare the proportion of breakthroughs to the proportion of vaccinations for each group. Whenever the dashed breakthrough proportion line is below the solid vaccination line of the same color, then that category is underrepresented for population, and when the dashed line is above the solid line of the same color then that category is overrepresented. For the week of 6/12/2022 we can see a sharp increase in the proportion of unvaccinated cases (dashed purple line) that is caused by the increase in cases, while the proportion of vaccinated cases (dashed blue line) and proportion of boosted cases (dashed gold line) declines.
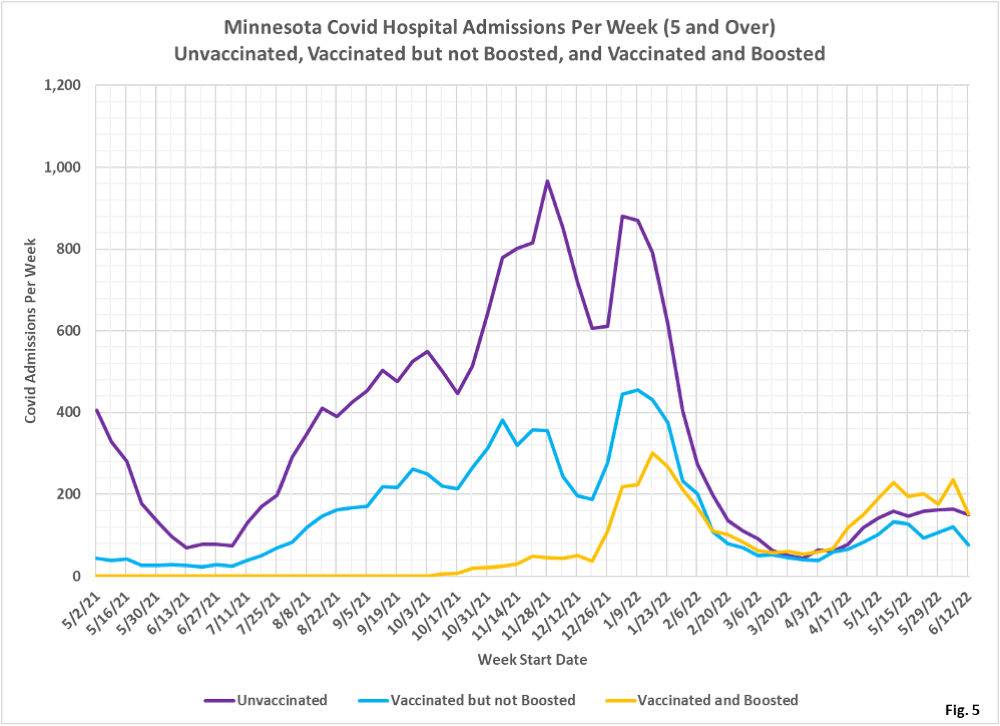
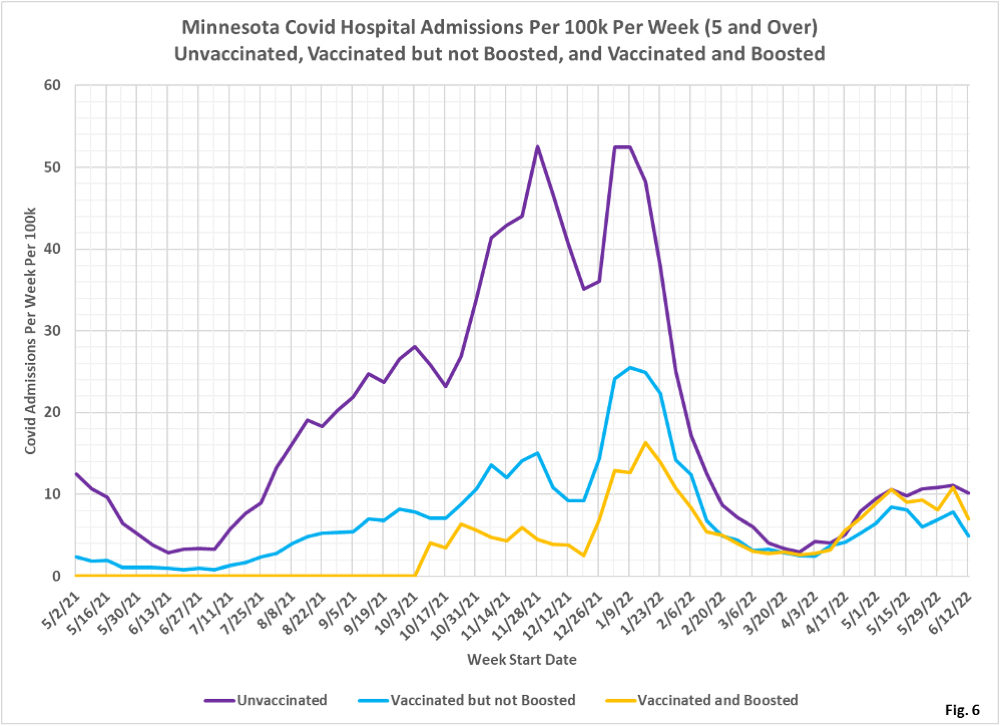
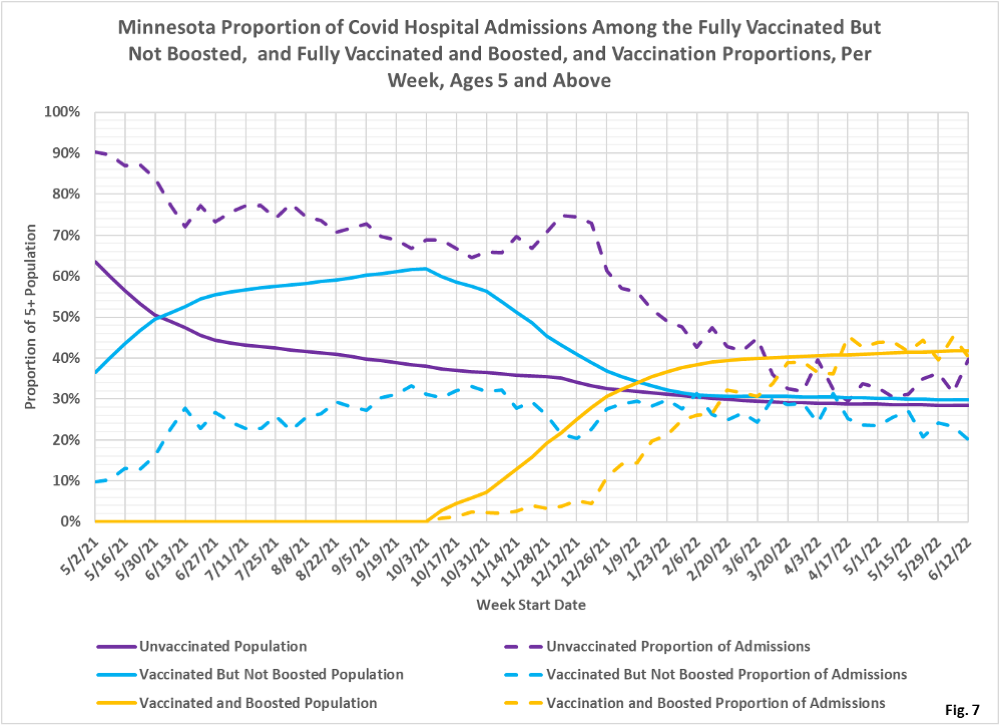
- Fig. 5-7: These charts display the hospital admissions, hospital admission rates per 100k, and hospital admissions proportions for the 5+ age group, in an identical format to the case charts in Fig. 2 through Fig. 4. While unvaccinated cases rose substantially for the week of 6/12/2022, hospital admissions for the unvaccinated were slightly lower (Fig. 5 and 6). However, because the admissions for the vaccinated and boosted dropped a fair amount the week of 6/12/2022 the net result is that the proportion of unvaccinated admissions rose for the week of 6/12/2022.
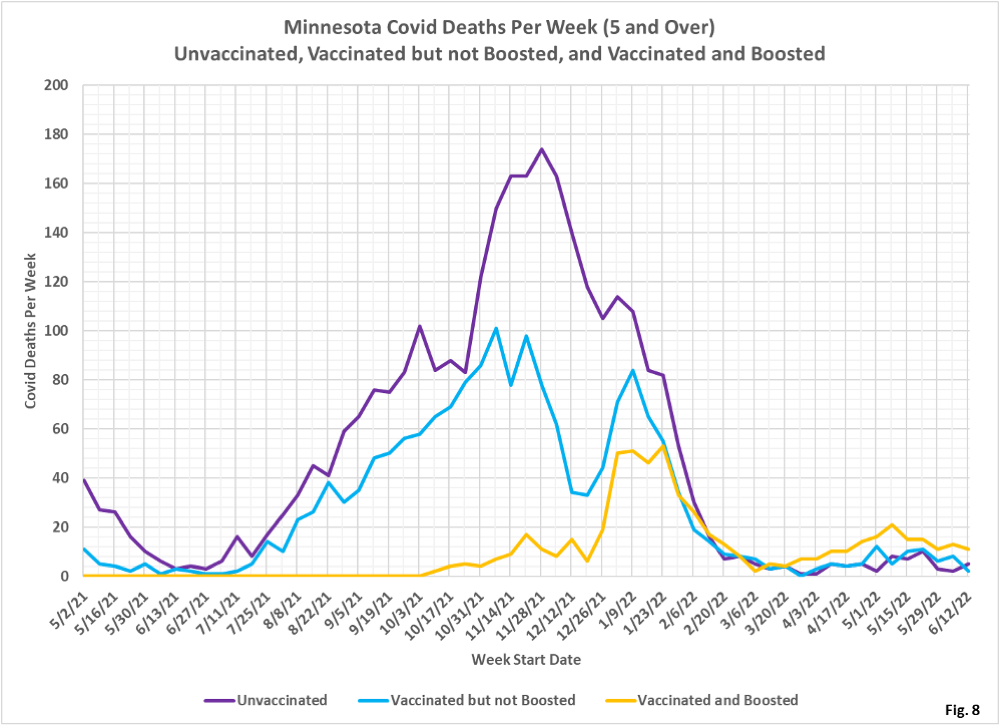
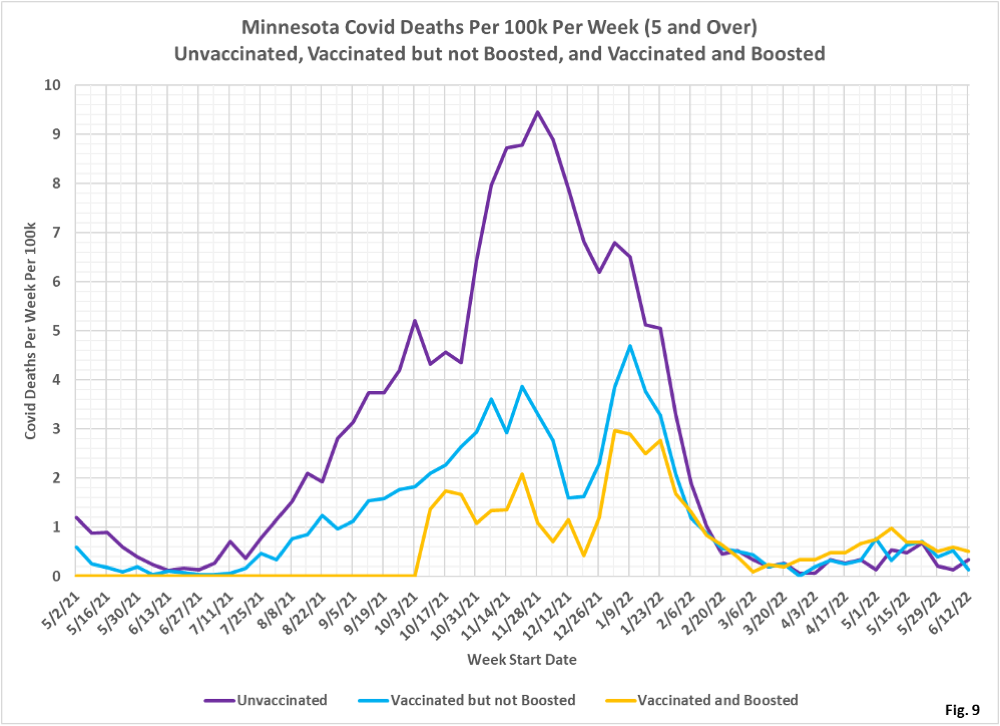
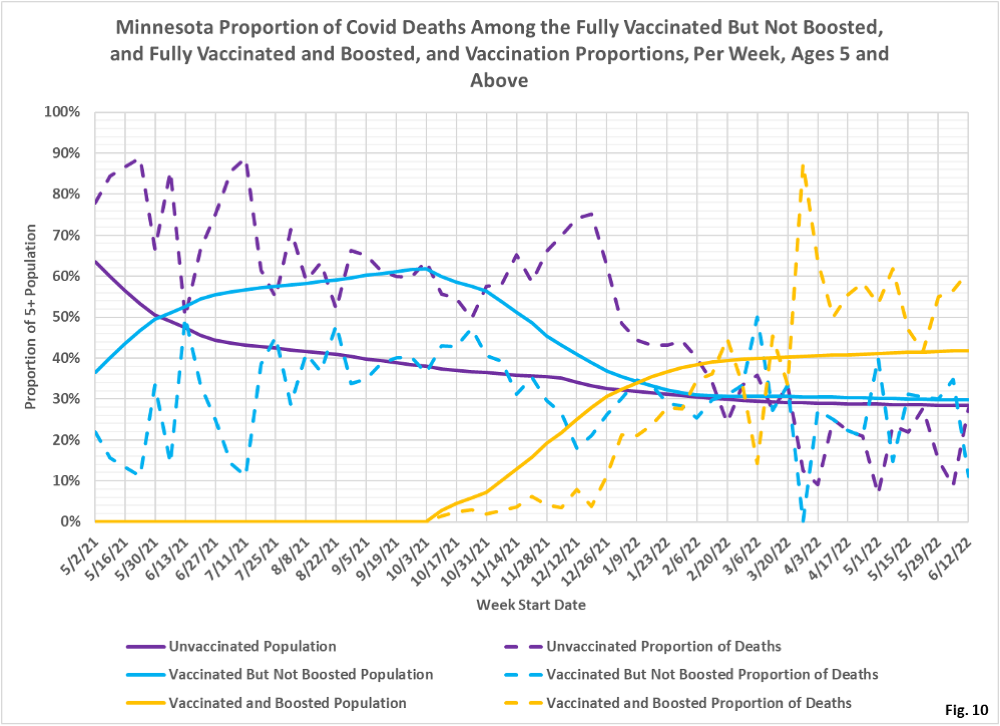
- Fig. 8-10: These charts display the deaths, deaths rates per 100k, and deaths proportions for the 5+ age group, in an identical format to the case charts in Fig. 2 through Fig. 4. Similar to cases and admissions, for the week of 6/12/2022 there was an increase in unvaccinated deaths, albeit small, and a decrease in deaths among the vaccinated and among the boosted.
- MDH defines the fully vaccinated (what we have termed vaccinated but not boosted) as those who have not received a booster after completing their primary vaccination series, and had been vaccinated at least 14 days prior to testing positive.
- MDH defines the boosted as those who have received any additional vaccination shots after completing their primary vaccination series, and also received the booster at least 14 days prior to testing positive. In addition, booster doses were only counted after 8/13/2021, the date the CDC first began recommending booster shots.
