A reminder that due to the holiday, breakthrough reporting was late this week and we are only doing the aggregate reporting. The age groups will be done again next week. At an aggregate level we see continuing evidence of falling effectiveness of vax and boosters against any event. And when the aggregate is like that, even if for one age group there appears to be better effectiveness, that only means that in other age groups there is worse effectiveness than that for the overall population. And don’t buy the DOH cap of trying to sell effectiveness over the whole vaccination period or saying small numbers of events in recent weeks skew the results. The trend is absolutely clear.
 Dave’s notes:
- This is an update of overall population breakthrough data that the Minnesota Department of Health (MDH) first published on 5/23/2022 and updated each Monday since. The breakthrough data is available here: https://www.health.state.mn.
us/diseases/coronavirus/stats/ vbt.html. - We last published data tables and charts for the overall age group on 6/13/2022 here, for the data released by MDH on 6/13/2022: https://healthy-skeptic.com/
2022/06/13/breakthrough- events-june-13/ . Compared to that set of charts the notable differences this week are a decline in boosted hospital admissions and an increase in boosted deaths. - The charts in Fig. 2 through 10 continue 3 charts for each type of event (cases, admissions, or deaths). The first chart for each type is the number of events each week. This chart helps illustrate the overall trend on the pandemic for the overall population, and what the impact is on society. The second chart is the rate of events per 100k each week. This chart displays the risk to an individual of the each category at different times during the pandemic. The third chart for each type of event is the proportions of event compared to the proportion of the population type (unvaccinated, vaccinated, or boosted). This chart helps show whether or not vaccination or boosting is effective in reducing the impact of the pandemic, by comparing the proportion of events to the proportion of the population.
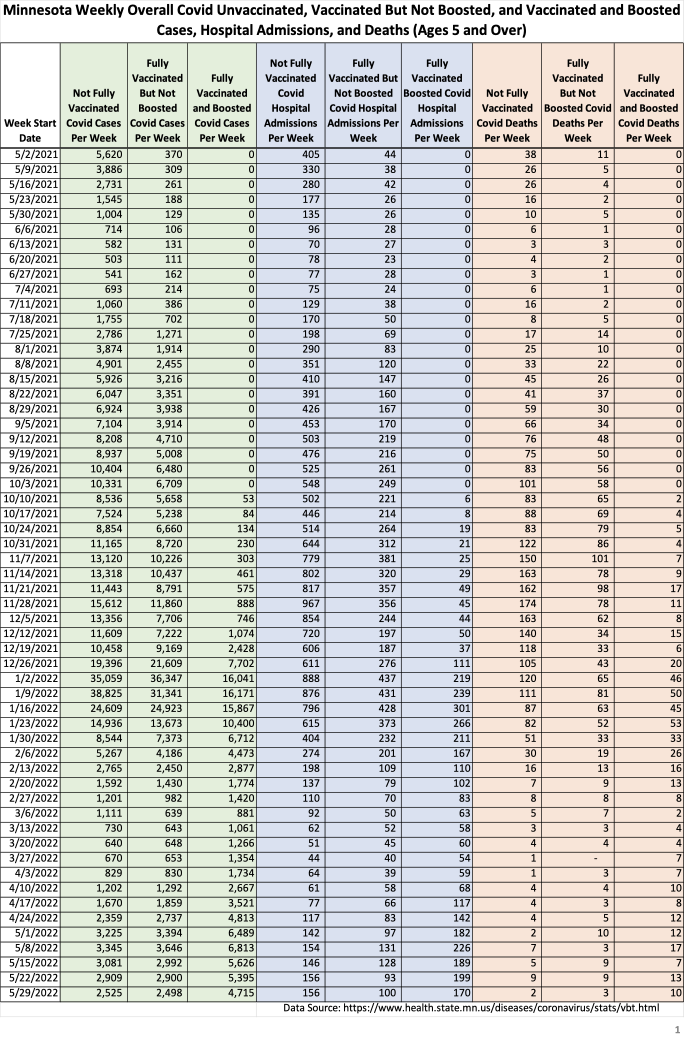
- Fig. 1: This table displays the total cases, hospital admissions, and deaths that occurred each week among the unvaccinated, vaccinated but not boosted, and vaccinated and boosted populations, with the latest week of 5/29/2022, one additional week compared to last week’s publication. This data is obtained from the data files vbtadultcirates.xlsx and vbtpedocirates.xlsx, available in the notes under the graphics on the MDH Vaccinate Breakthrough Weekly Update web page https://www.health.state.mn.
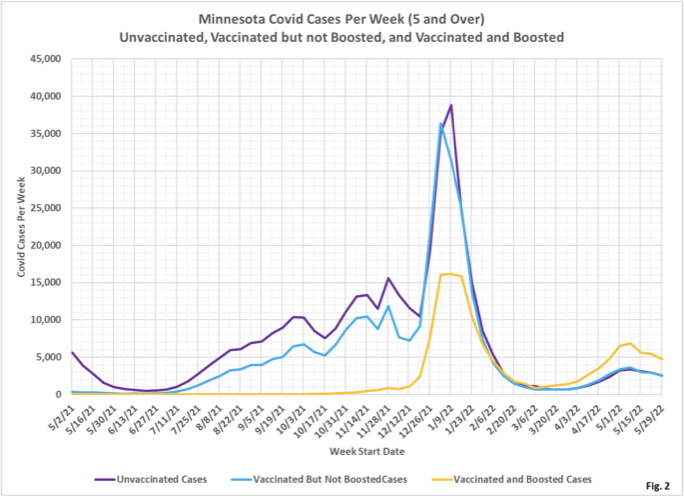
us/diseases/coronavirus/stats/ vbt.html. The week of 5/29/2022, last row of data shows that cases, hospital admissions, and deaths continue to slowly decline. - Fig. 2: This chart simply plots the cases among the unvaccinated, vaccinated but not boosted, and vaccinated and boosted populations each week, as found in Fig. 1. Note that the greatest number of cases continue to be among the boosted in the most recent weeks, in contrast to earlier in the pandemic when the unvaccinated and the unboosted had the largest number of cases.
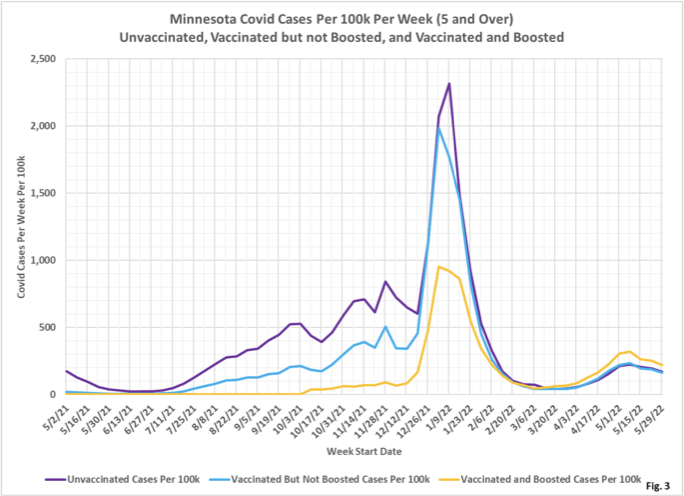
- Fig. 3: This chart displays the case rates per 100k for each group. Note that since March 2022 the highest case rates continue to be among the boosted, while the case rates among the unvaccinated and unboosted are almost identical, since 1/23/2022.
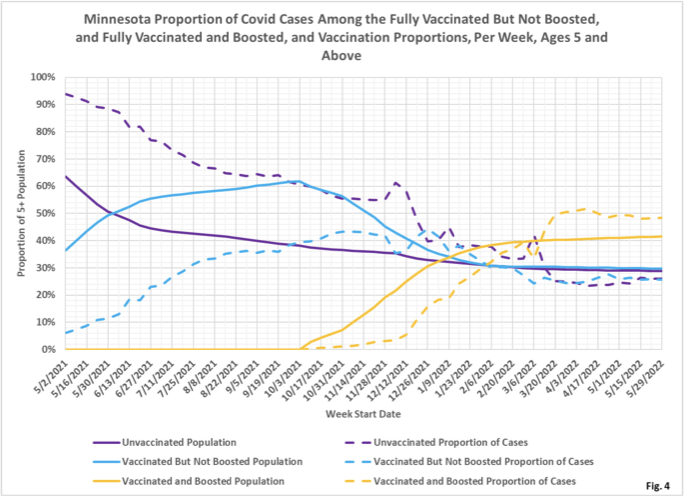
- Fig. 4: This chart displays the proportion of the 5 and over population who are unvaccinated (solid purple), vaccinated but not boosted (solid blue), and vaccinated and boosted (solid gold). For each population group we also display the proportion of cases each week (dashed lines of same color). The way to interpret this chart is to compare the proportion of breakthroughs to the proportion of vaccinations for each group. Whenever the dashed breakthrough proportion line is below the solid vaccination line of the same color, then that category is underrepresented for population, and when the dashed line is above the solid line of the same color then that category is overrepresented. For the week of 5/29/2022, 42% of the population was vaccinated and boosted (solid gold line) while this group accounted for 48% of the cases (dashed gold line). We would interpret this to show that being boosted did not reduce an individual’s chances of testing positive for Covid for that week, when considering the overall population. This matches the case rates per 100k seen in Fig. 3, where the boosted have the highest rates of testing positive.
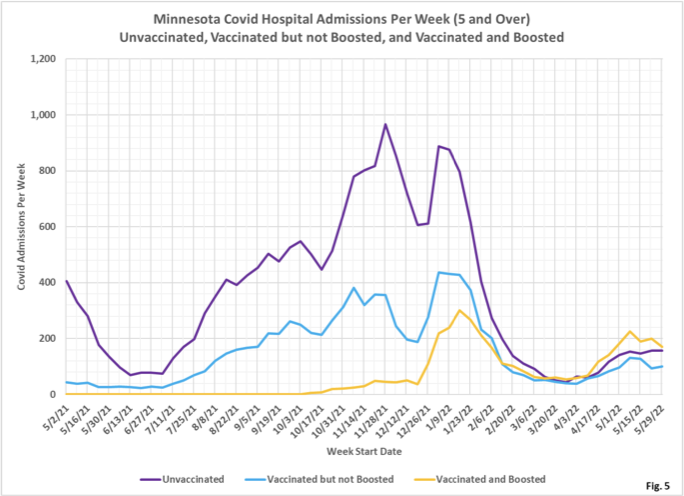
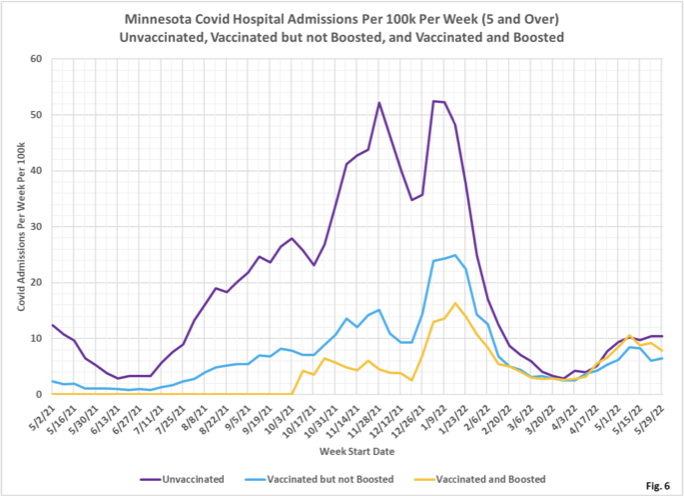
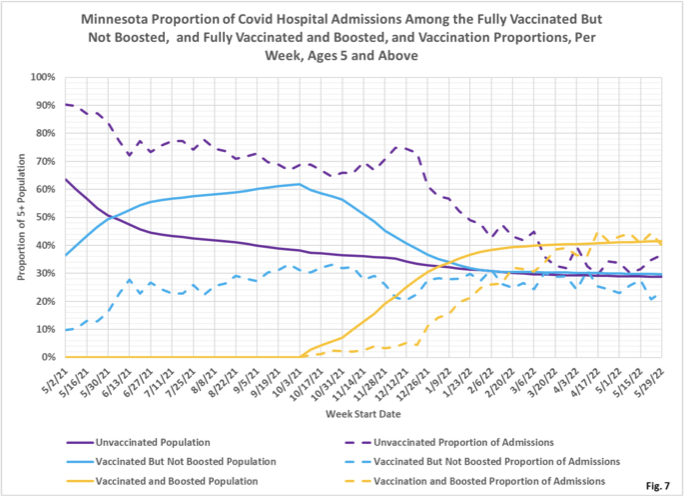
- Fig. 5-7: These charts display the hospital admissions, hospital admission rates per 100k, and hospital admissions proportions for the 5+ age group, in an identical format to the case charts in Fig. 2 through Fig. 4. Similar to cases, the boosted have a majority of the admissions, although they are declining almost to the level of unvaccinated admissions (Fig. 5). However the admissions per 100k for the unvaccinated are higher than the admissions per 100k of the boosted, while the vaccinated but not boosted have the lowest admission rates (Fig. 6). Fig. 7 shows that admissions among the unvaccinated are somewhat disproportionately high currently, with the unvaccinated making up 30% of the population but accounting for 37% of the admissions.
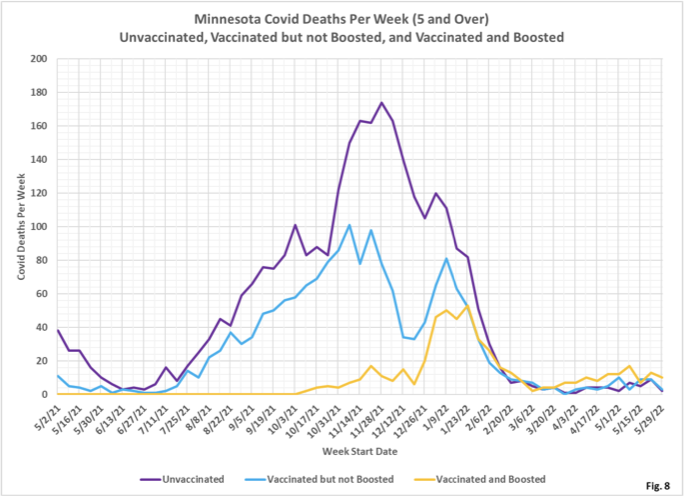
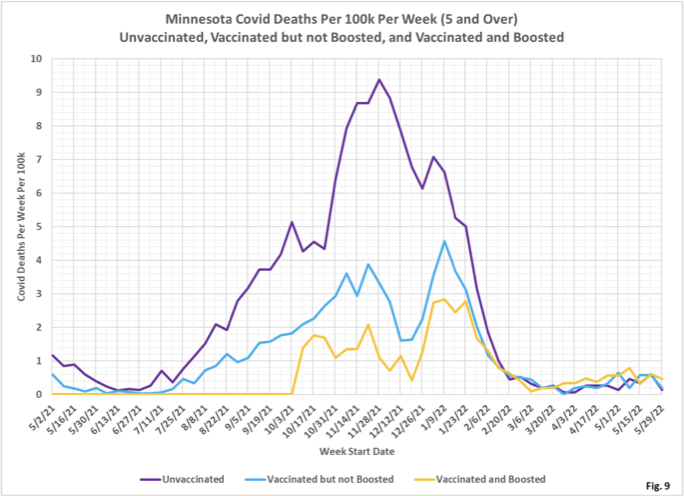
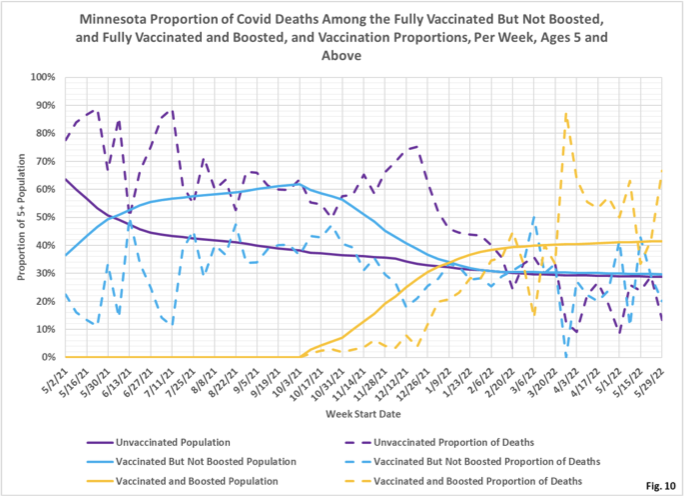
- Fig. 8-10: These charts display the deaths, deaths rates per 100k, and deaths proportions for the 5+ age group, in an identical format to the case charts in Fig. 2 through Fig. 4. Deaths are decreasing, but the boosted have generally had the highest the number of deaths in recent weeks (Fig. 8). Fig. 9 shows that the boosted have the highest rate of deaths per 100k for the week of 5/29/2022. Fig. 10 shows that deaths proportion are highly variable, especially in recent weeks when there are relatively few deaths.
- MDH defines the fully vaccinated (what we have termed vaccinated but not boosted) as those who have not received a booster after completing their primary vaccination series, and had been vaccinated at least 14 days prior to testing positive.
- MDH defines the boosted as those who have received any additional vaccination shots after completing their primary vaccination series, and also received the booster at least 14 days prior to testing positive. In addition, booster doses were only counted after 8/13/2021, the date the CDC first began recommending booster shots.

“It’s an Epidemic of the Vaxed….and Boosted”
I am in 100 % agreement with the above statement, but I am pretty sure most of my local health care providers would not agree with the statement. Recently I noticed on my FORMER healthcare provider’s website, the section on promoting the vaccine the provider stated getting Covid after taking the vaccine is extremely rare.
On December of 2021 Matthew J. Memoli, (Director, LID Clinical Studies Unit, National Institutes of Health) hosted a live seminar on the NIH website on the subject of the ethics of the vaccine mandate. It was apparent listening to the seminar, at least some at the NIH were aware of the drop off the efficacy of the vaccine over time.
I had Covid in November of 2020, tested positive for antibodies. At the time I struggled to understand how the body would react when getting vaccinated after acquiring some sort of immune response from an infection. Numerous studies were linked on this site that indicated this combination enhanced the immune response. I just had trouble with accepting those findings at the time.
Back to your heading on the post “It’s an Epidemic of the Vaxed….and Boosted” The question is why? I know you think he is crazy but is Geert Vanden Bossche of Belgium correct on this point, the vaccine antibodies out compete our innate antibodies and or acquired antibodies, attach to the virus but can no longer neutralize it due to the mutations.
Or does the vaccine effectiveness just fade away and people reach a state like they were never vaccinated, no memory B or T cell response from the vaccination?