Easier to see recent trends here, on this set of charts which begins in December with the Omicron wave and after many Minnesotans had been vaxed and boosted. And the trends here look as bad for boosters as the longer term picture did. Again the way to read these is by comparing the dashed and solid lines of the same color. If a group’s dashed line is above the solid one, that is quite suggestive of zero effectiveness. All you need to do is look at the trend over time and in recent weeks and then try to understand how DOH can in good conscience say that boosters are beneficial at this point. The age group charts suggest they may be for the very oldest, but that just means that performance is worse in all the other age groups. I will once more point out that DOH has data on potential confounders like testing rates and prior infection, but chooses not to include that. Draw your own conclusions from that failure.
 Dave’s notes:
- This is our second post showing the proportions of the overall population who are unvaccinated, vaccinated but not boosted, and vaccinated and boosted, along with the corresponding proportions of cases, hospital admissions, and deaths for each subgroup during the Omicron wave. This post on 5/25/2022 is here: https://healthy-skeptic.com/
2022/05/25/breakthrough- events-shorter-term-chart/ - Compared to the last version, this set of charts shows the same data, along with the data for the week of 5/08/2022 which was just published by MDH. The only other changes to the charts were to change the color scheme to match the colors used on the MDH Vaccine Breakthrough web page here: https://www.health.state.mn.
us/diseases/coronavirus/stats/ vbt.html - To recap, on Monday, 5/23/2022, the Minnesota Department of Health (MDH) made some fairly significant changes to their vaccine breakthrough reporting. The biggest change was the addition of booster information to the breakthrough data. They now report cases, hospital admissions, and deaths for those vaccinated but not boosted, and for those who have received at least one booster shot. Also new is the data for the 5-11 age group. Finally, the underlying data files were comprehensively changed, for the positive with the addition of the vaccinated populations, and by providing actual breakthrough cases, admissions, and deaths each week in addition to the rates per 100k.
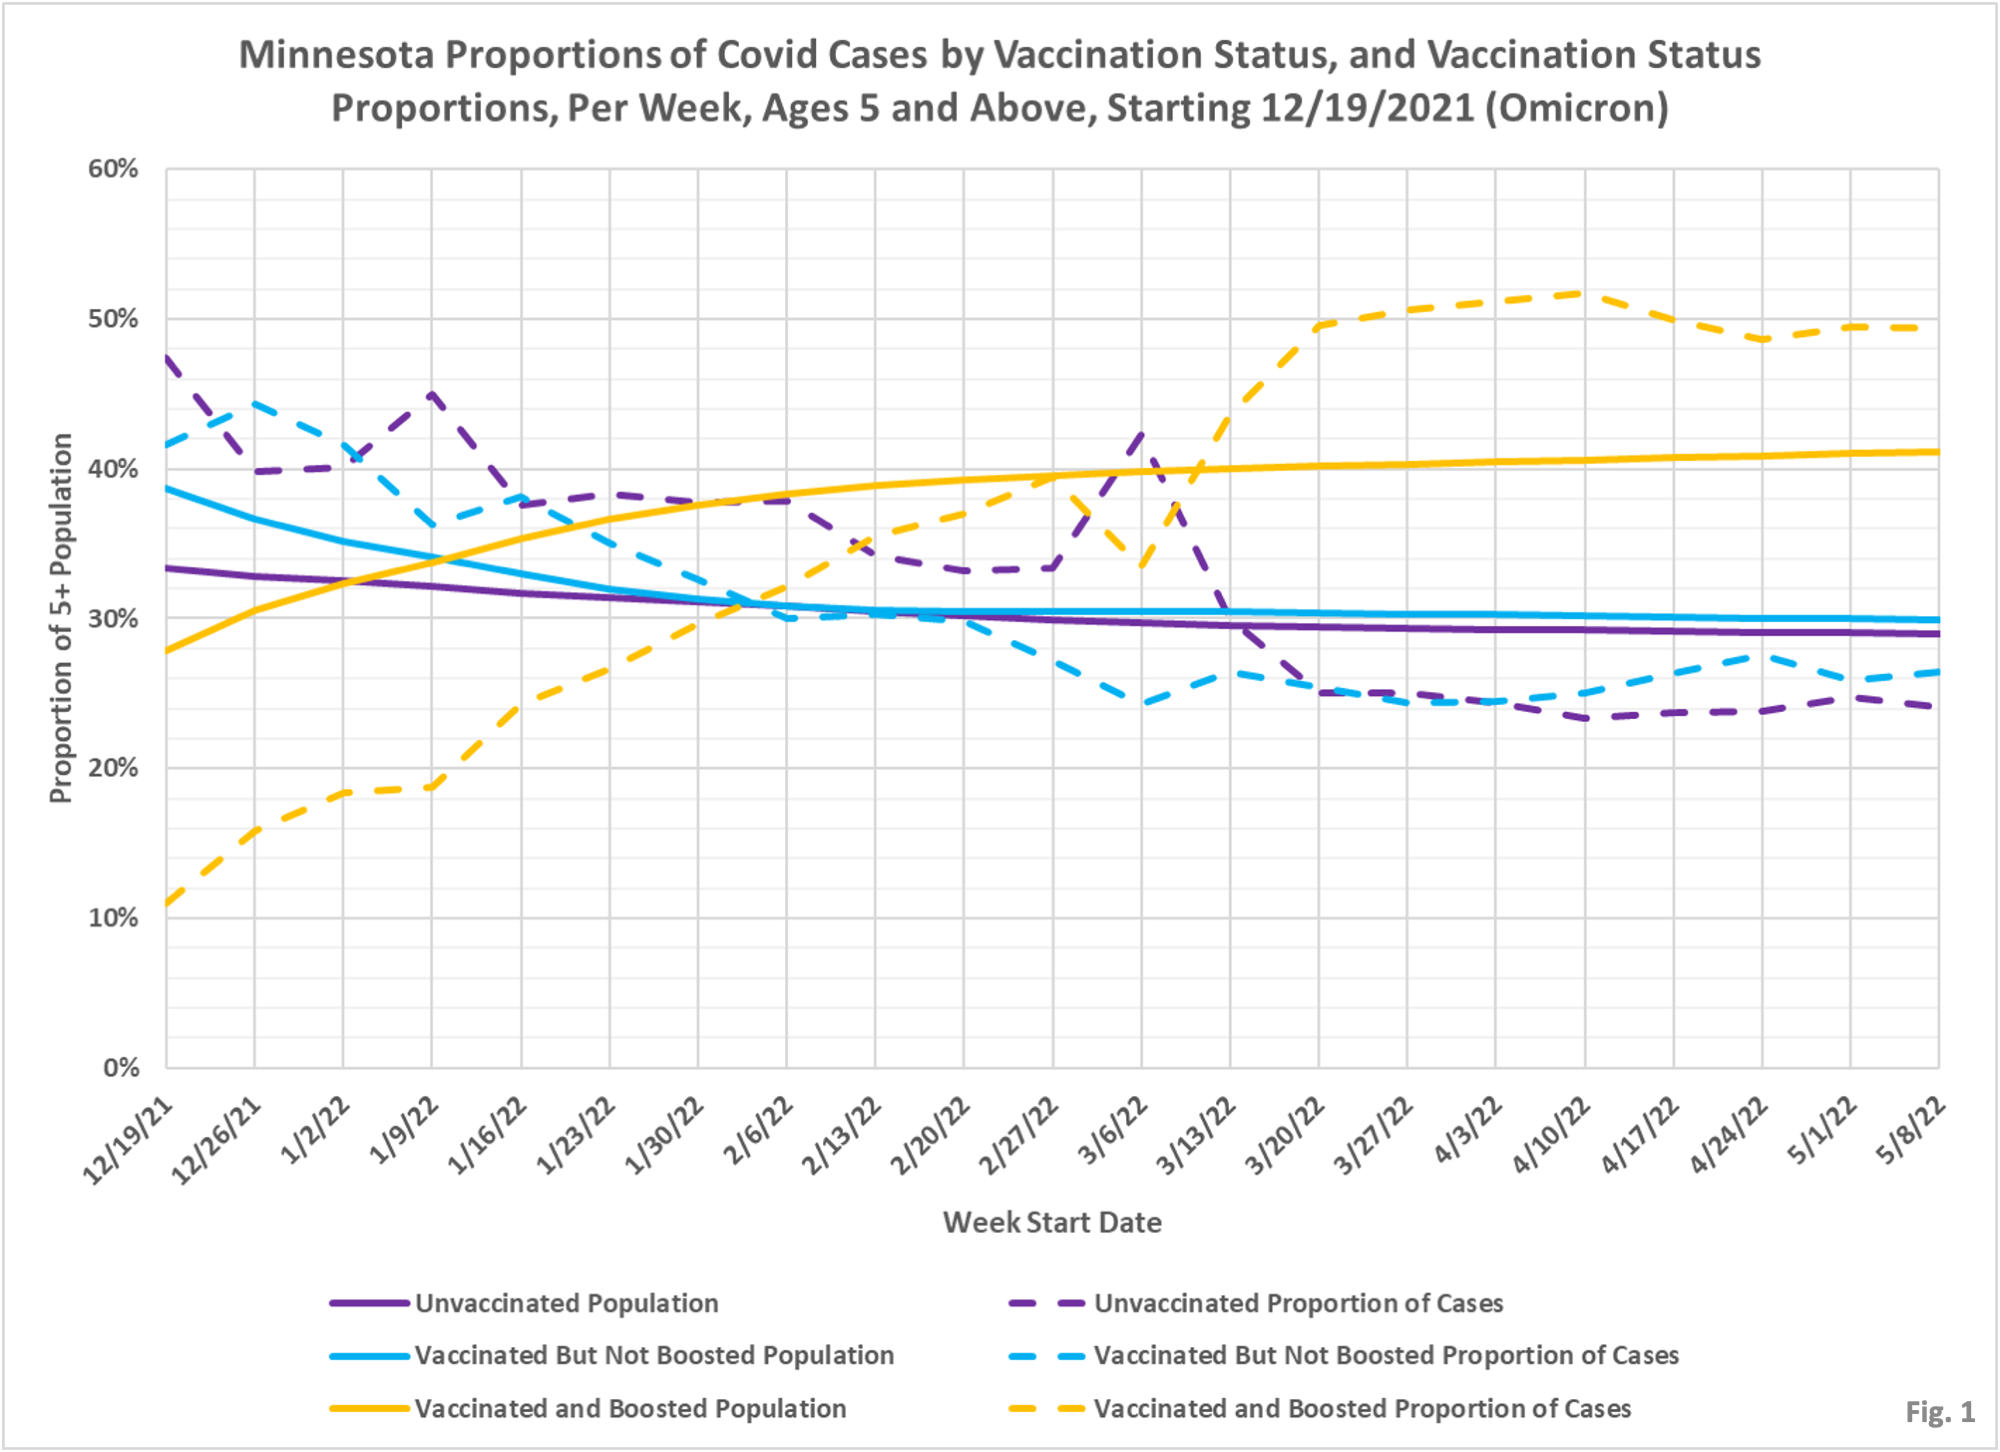
- Fig. 1: This chart displays the proportion of the 5 and over population of Minnesota who are unvaccinated (solid purple), vaccinated but not boosted (solid blue), vaccinated and boosted (solid gold), and the proportion of cases among these 3 groups each week (dashed lines of same color). The way to interpret this chart is to compare the proportion of breakthroughs to the proportion of vaccinations. When the dashed line for the proportion of vaccinated or vaccinated and boosted events is below the solid line for the corresponding proportion of population, then the vaccine or booster could be considered to have reduced the number of cases, admissions, or deaths. If the dashed purple line for the unvaccinated proportion of events is above the solid purple line for the proportion of the population that is unvaccinated, then the unvaccinated have a disproportionately higher risk of testing positive, being admitted, or dying. For the week of 5/8/2022, for example, 41% of the population was vaccinated and boosted (solid gold line) while this group accounted for 49% of the cases (dashed gold line). We would interpret this to show that being boosted did not reduce an individual’s chance of testing positive for Covid for that week. For another example, for the first week on the left side of the chart, 12/19/21, the dashed gold line for the boosted proportion of cases line is at 11%, while the solid gold line for the boosted proportion of the population is 28%. This means for the week of 12/19/21 that being boosted is associated with a proportion of cases lower than the proportion of population that is boosted. For the week of 12/19/21 we can see that the lower proportion of boosted cases show up primarily in the unvaccinated, where the unvaccinated proportion of the population is 33% (solid purple line), but they accounted for 47% of that week’s cases (dashed purple line). In general, it appears that the boosted population is over-represented in Covid cases each week since 3/13/22, while the vaccinated and unvaccinated subgroups are under-represented. For this reason we would argue that the booster is underperforming expectations in terms of preventing people from testing positive for Covid.
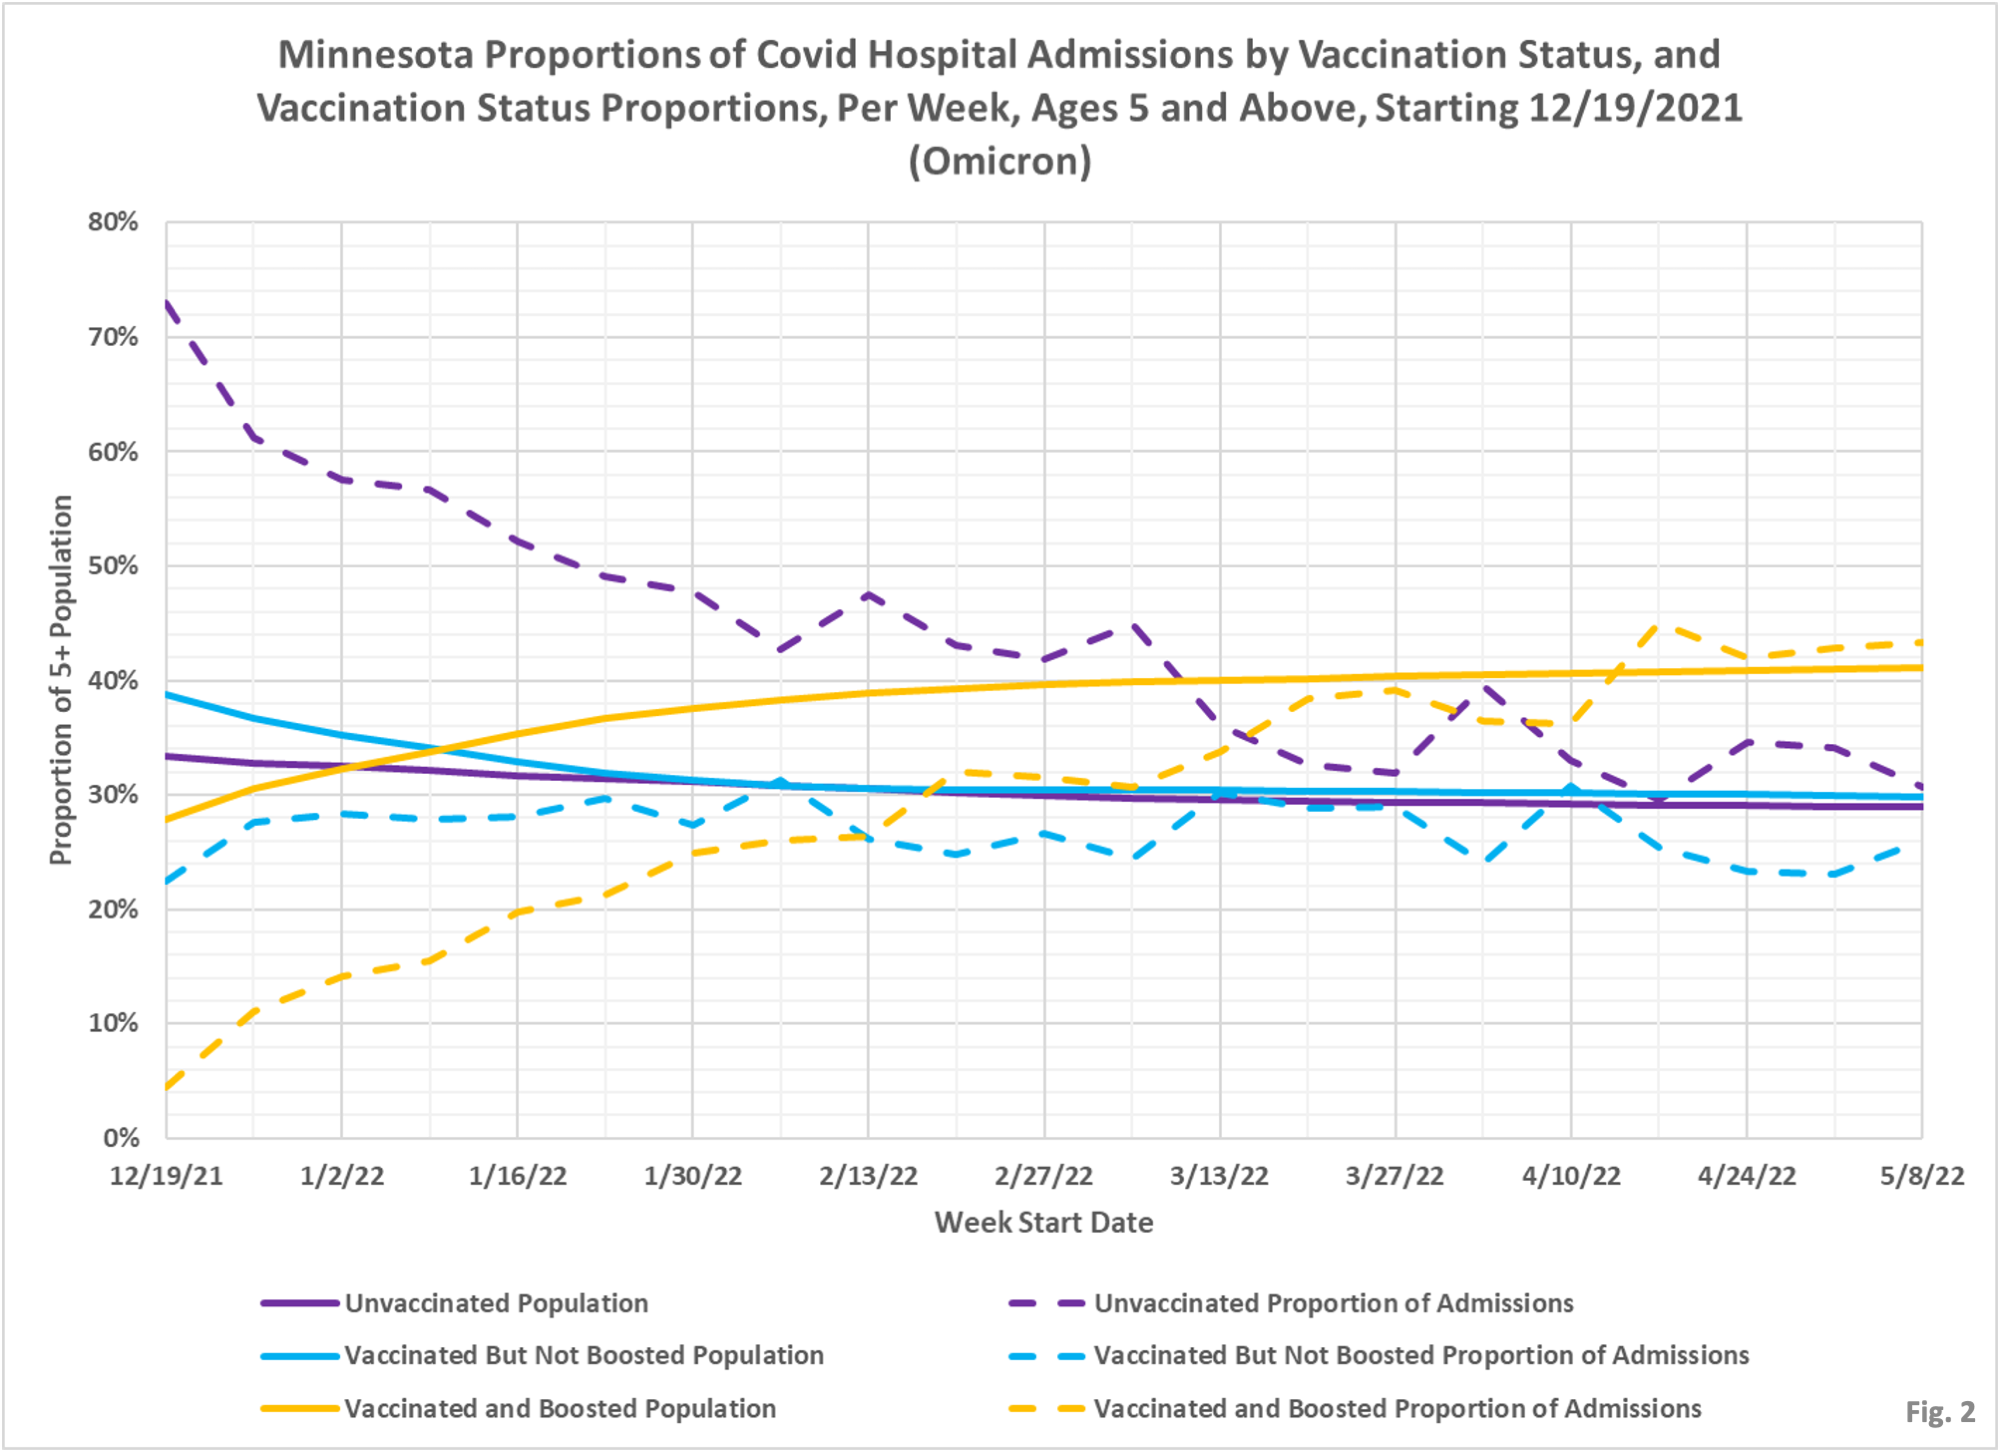
- Fig. 2: Similar to the case proportion chart in Fig. 1, this chart shows the proportion of hospital admissions among the unvaccinated (dashed purple line), the vaccinated but not boosted (dashed blue line) and vaccinated and boosted (dashed gold line) compared to the corresponding proportions of the population (solid lines). We can see that since roughly 3/20/2022 being boosted has had little effect on the odds of an individual being hospitalized, since the proportion of admissions (dashed gold line) is roughly similar to the proportion boosted (solid gold line). Being vaccinated but not boosted has been negligibly helpful since roughly 1/23/2022, comparing the dashed to solid blue lines, but this slight benefit has narrowed for the week of 5/8/2022, the most recent week displayed.
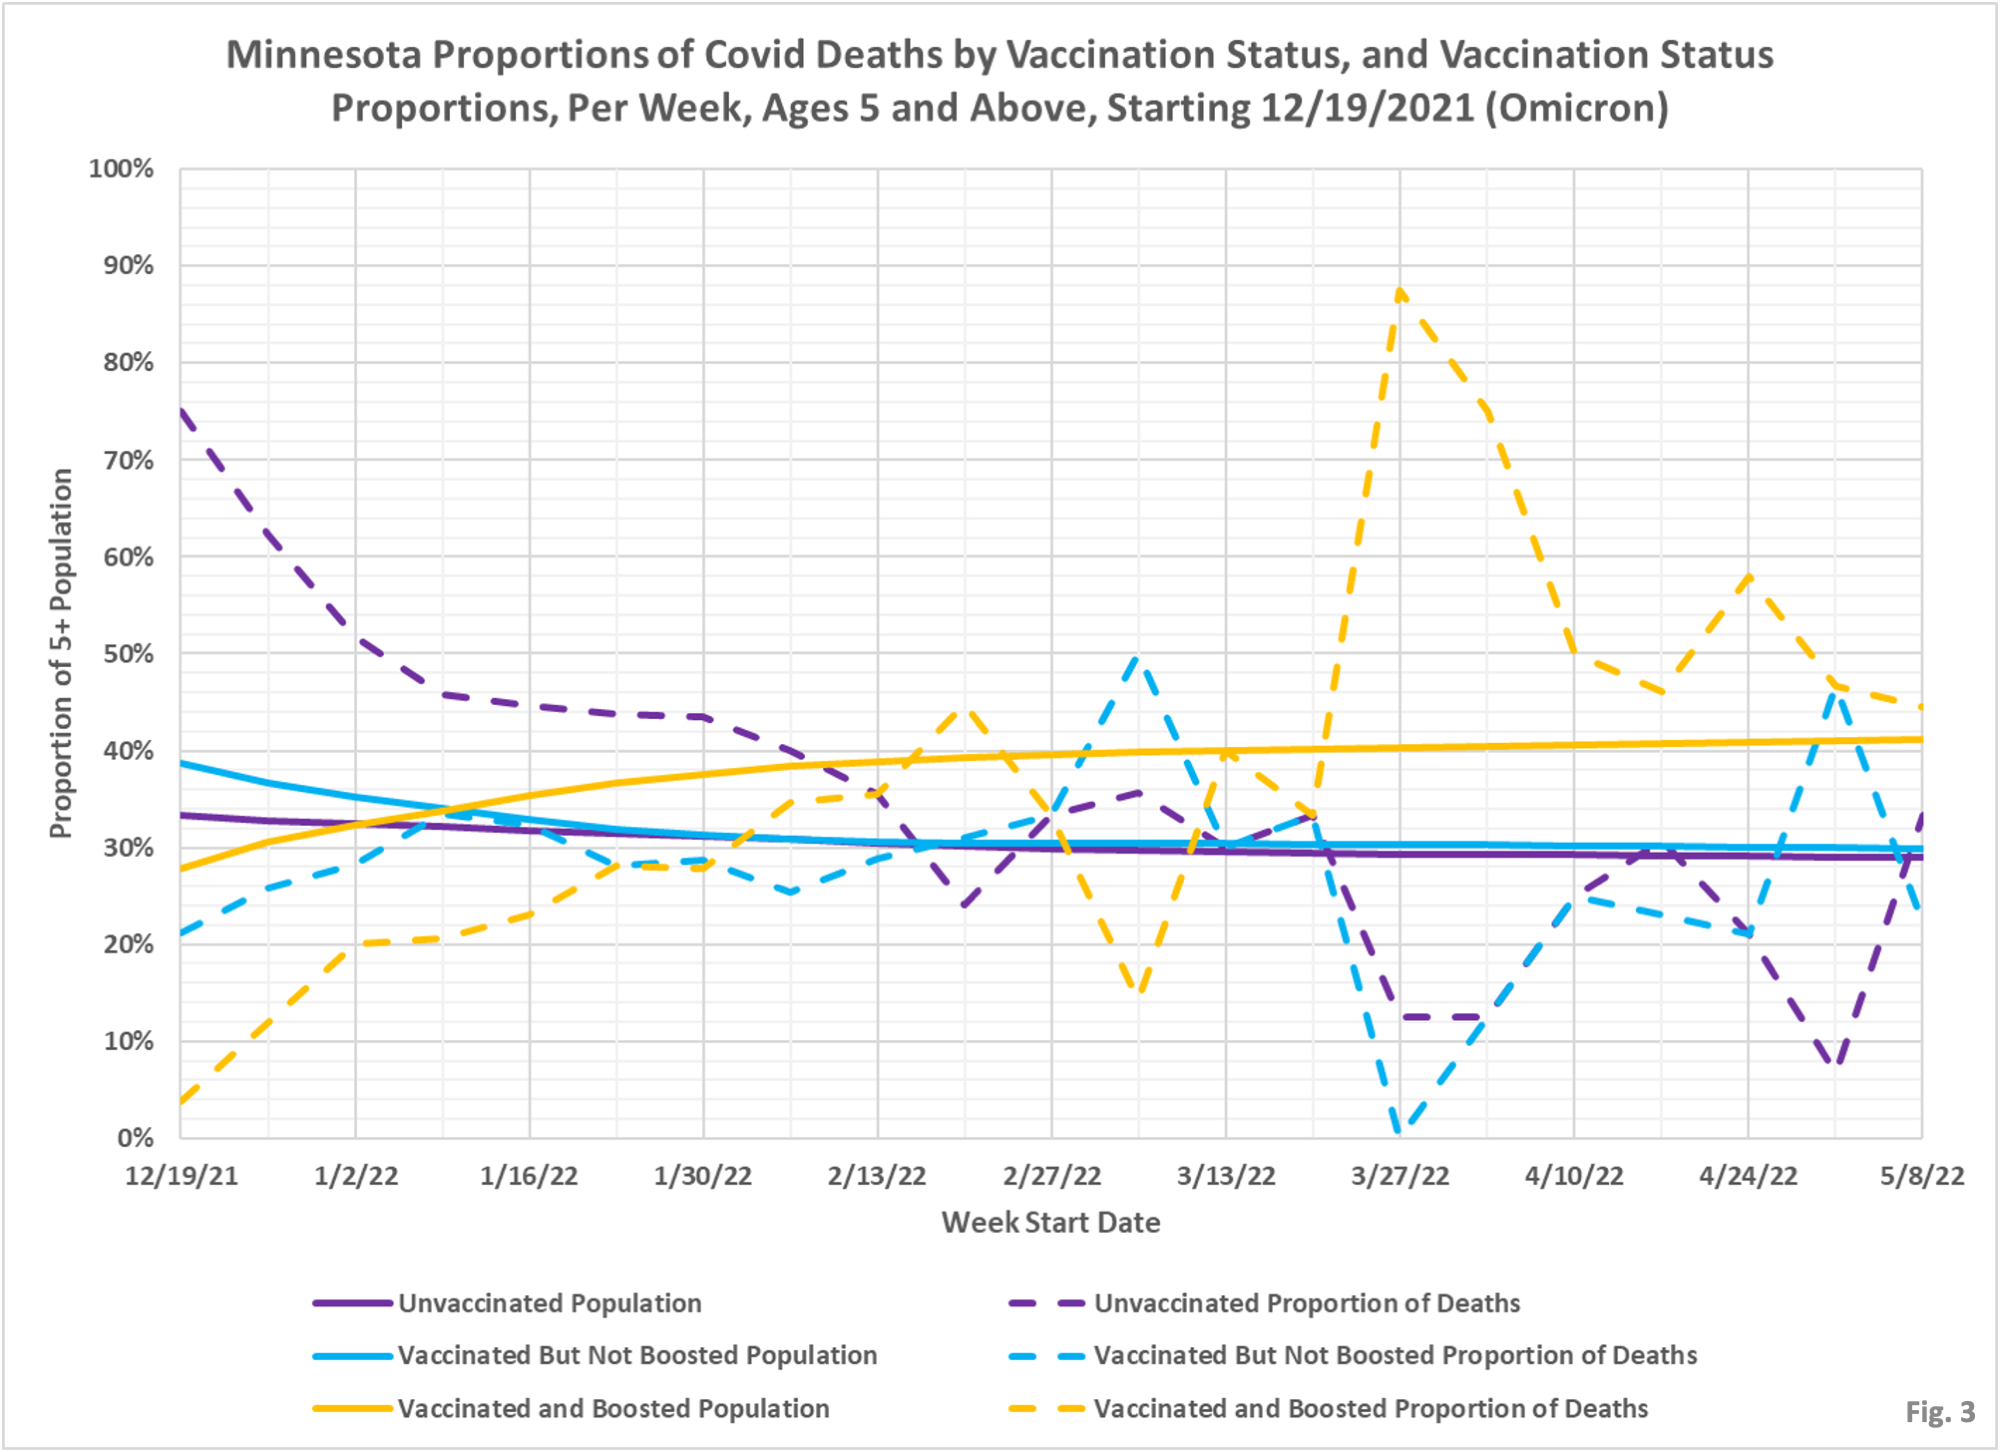
- Fig. 3: Finally this chart displays the proportion of weekly deaths and to the corresponding proportion of the population. As with cases and hospital admissions, whenever the dashed line is higher than the corresponding solid line then that category is over-represented. We can see, for example, that the proportion of deaths among the vaccinated and boosted peaked at 88% on 3/27/2022, while the boosted population was only 40% of the total population. It is likely that data reporting inconsistencies accounts for some of the choppiness of the data, as well as the fact that there are relatively few Covid deaths each week, so a few deaths can swing the proportions to extremes more easily. In the most recent week, 5/8/22 on the far right side of the chart, the boosted had 44% of the weekly deaths (dashed gold line) but comprised only 41% of the total population (solid gold line), and the vaccinated but not boosted had 22% of the weekly deaths (dashed blue line) but made up 30% of the population (solid blue line). Finally, the unvaccinated had 33% of the weekly deaths (dashed purple line) but made up 30% of the total population (solid purple line). Since the proportion of deaths nearly matches the proportion of the population it is not obvious for the week of 5/8/2022 that being vaccinated or boosted made a significant difference when considering the entire population as a whole.
- MDH defines the fully vaccinated (what we have termed vaccinated but not boosted) as those who have not received a booster after completing their primary vaccination series, and had been vaccinated at least 14 days prior to testing positive.
- MDH defines the boosted as those who have received any additional vaccination shots after completing their primary vaccination series, and also received the booster at least 14 days prior to testing positive.

You have advocated for these vaccines for over a year, are you finally ready to admit you have been wrong the entire time? The signal that they are ineffective has been obvious for at least a year, the signal that they are dangerous for closer to a year and a half. In addition, any honest/thinking person could see they were *never* necessary. There is something very wrong with your thought process if you thought these vaccines were necessary after reading PFE’s initial (3 month) pivotal results in NEJM.
Its also been established for a LONG time that these vaccines drive transient immunosuppression in people, hence this: “MDH defines the fully vaccinated (what we have termed vaccinated but not boosted) as those who have not received a booster after completing their primary vaccination series, and had been vaccinated at least 14 days prior to testing positive.” Is used to manipulate numbers and ascribed vaccine-induced infection/injury/death to the unvaccinated. Are you willing to admit that you ignored this for >1 year, and continued to claim the vaccines were effective when this OBVIOUS manipulation in play?
You’ve done much good work but it is completely undone by your continual support for an obviously unsafe and ineffective medical intervention. You need to write a very extensive mea culpa on this.
I report on the data and the research as it evolves. You will see in a series of posts on age group analysis of breakthru events that boosters do have benefit in older age groups. Whether that will wear off as the two-dose series did we will see. There is absolutely zero evidence from any reputable source suggesting any significant number of adverse events of any type. Making up and buying into bullshit about vax safety doesn’t help anyone and hurts some people. Where there is evidence of serious risk, particularly as compared to the benefit, as in myocarditis with younger males I have reported on it. But don’t for one second expect me to buy into the anti-vax bullshit when it has no support.
Explain the vaccinated showing heightened representation to their portion of the population in deaths and hospitalizations in Scotland, the UK, and Canada. Explain the extraordinary Spike in all AEs (and especially deaths) in VAERS. You also refuse to comment on the OBVIOUS increase in AEs in the two week period post vaccination that have been ascribed to the unvaccinated or partially vaccinated. If you label these as “anti vax bullshit” you (1) aren’t particularly bright, because (2) you can’t see beyond clearly twisted presentation of “official” data sources, and (3) you continue to do a stunning disservice to your audience.
I am not getting back into this back and forth with irrational anti-vaxers. I present the data and research as it evolves. I have been on the forefront of identifying the misleading statements in regard to breakthrough events made by government and public health officials and I continue to do that. The safety stuff is largely bullshit. And the vax continue to provide protection against serious illness in older age groups. I find it fascinating that some people can’t tolerate any dissonance from their internal irrational beliefs.