Looking at cumulative epidemic events can be misleading, as it will mask an early or a late trend that is quite different from the cumulative rates. Dave Dixon’s charts below in regard to avoidance of hospitalization and death illustrate this. While the overall rates for hospitalization and death are very low, they are even lower recently. And this does not include adjusting for the issue of incidental hospitalizations or mis-attributed deaths. And if all cases were detected, these rates would be 5 to 10 times lower.
 Dave’s notes:
- Commenter Dell noted some recent media coverage on the deadliness of Covid, and posted some data how skewed the age distribution of deaths is among the old. (https://healthy-skeptic.com/
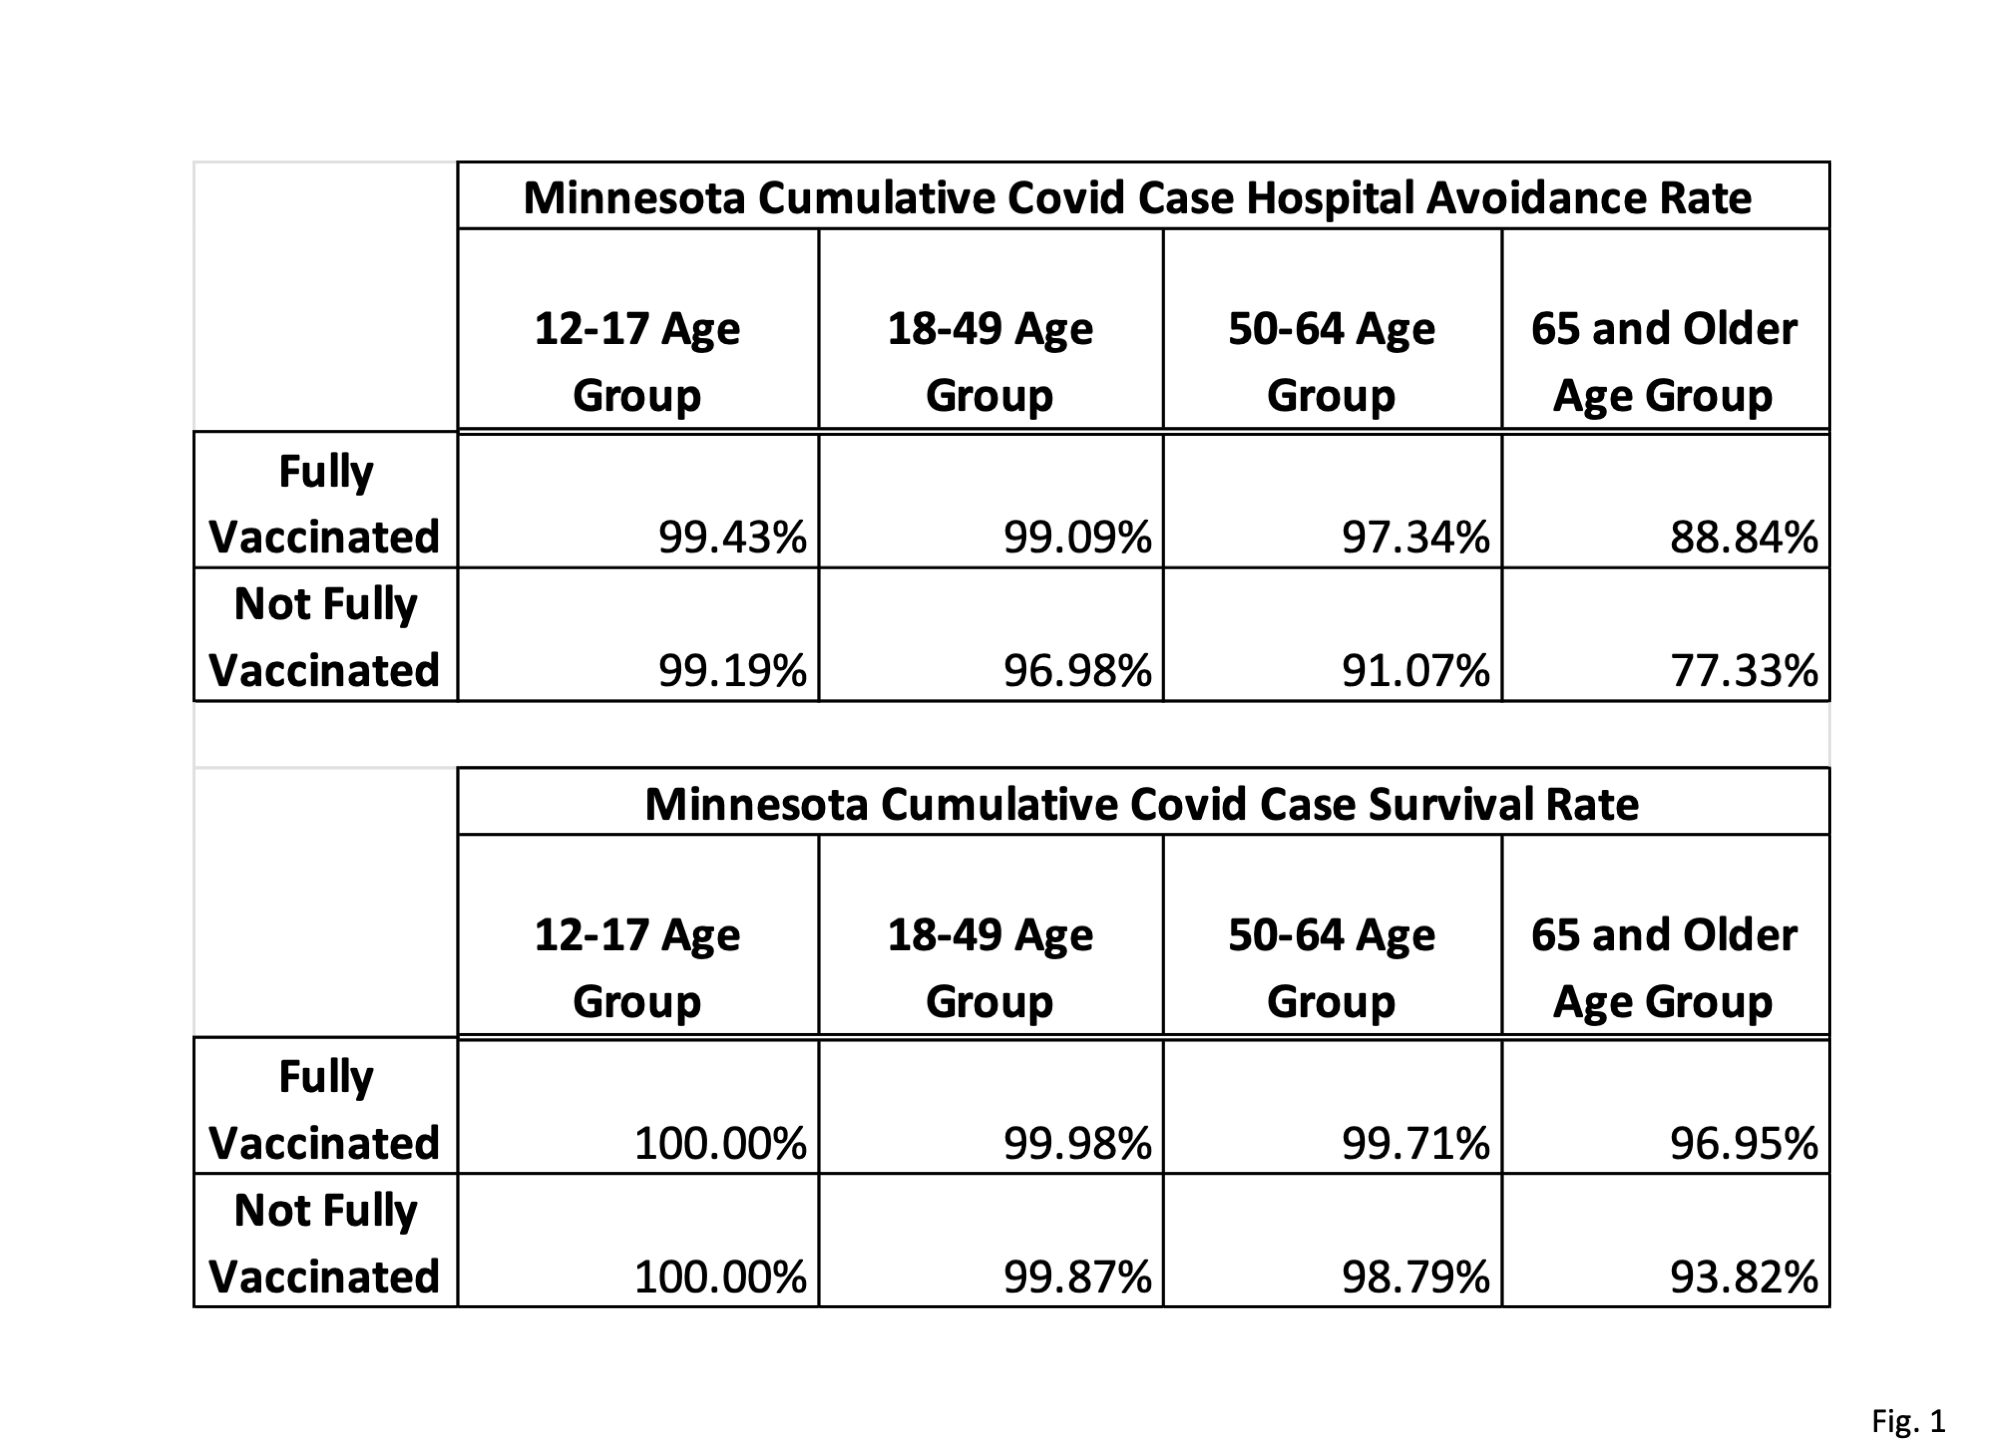
2022/05/20/coronamonomania- lives-forever-part-139/) This reminded us that although we publish age distribution charts each week for Covid cases, hospital admissions, and deaths it has been quite some time since we published survival rates. In fact, we last published case hospital avoidance rates and case survival rates on 2/07/2022 here: https://healthy-skeptic.com/ 2022/02/07/survival-and- hospital-avoidance-rates/. - Fig. 1 shows the cumulative hospital avoidance rate (the rate of those who test positive for Covid but who are not hospitalized) and the cumulative positive case survival rate, for all positive cases from the week starting 5/02/2021 to the week starting 4/10/2022. The rate of hospitalization, or rate of death, of positive cases would therefore be 100% minus the displayed rates. These rates are of course greatly affected by how completely the Covid testing regime tests and reports positive cases. If missed Covid cases were included in the reported data then these survival rates would be higher than reported here.
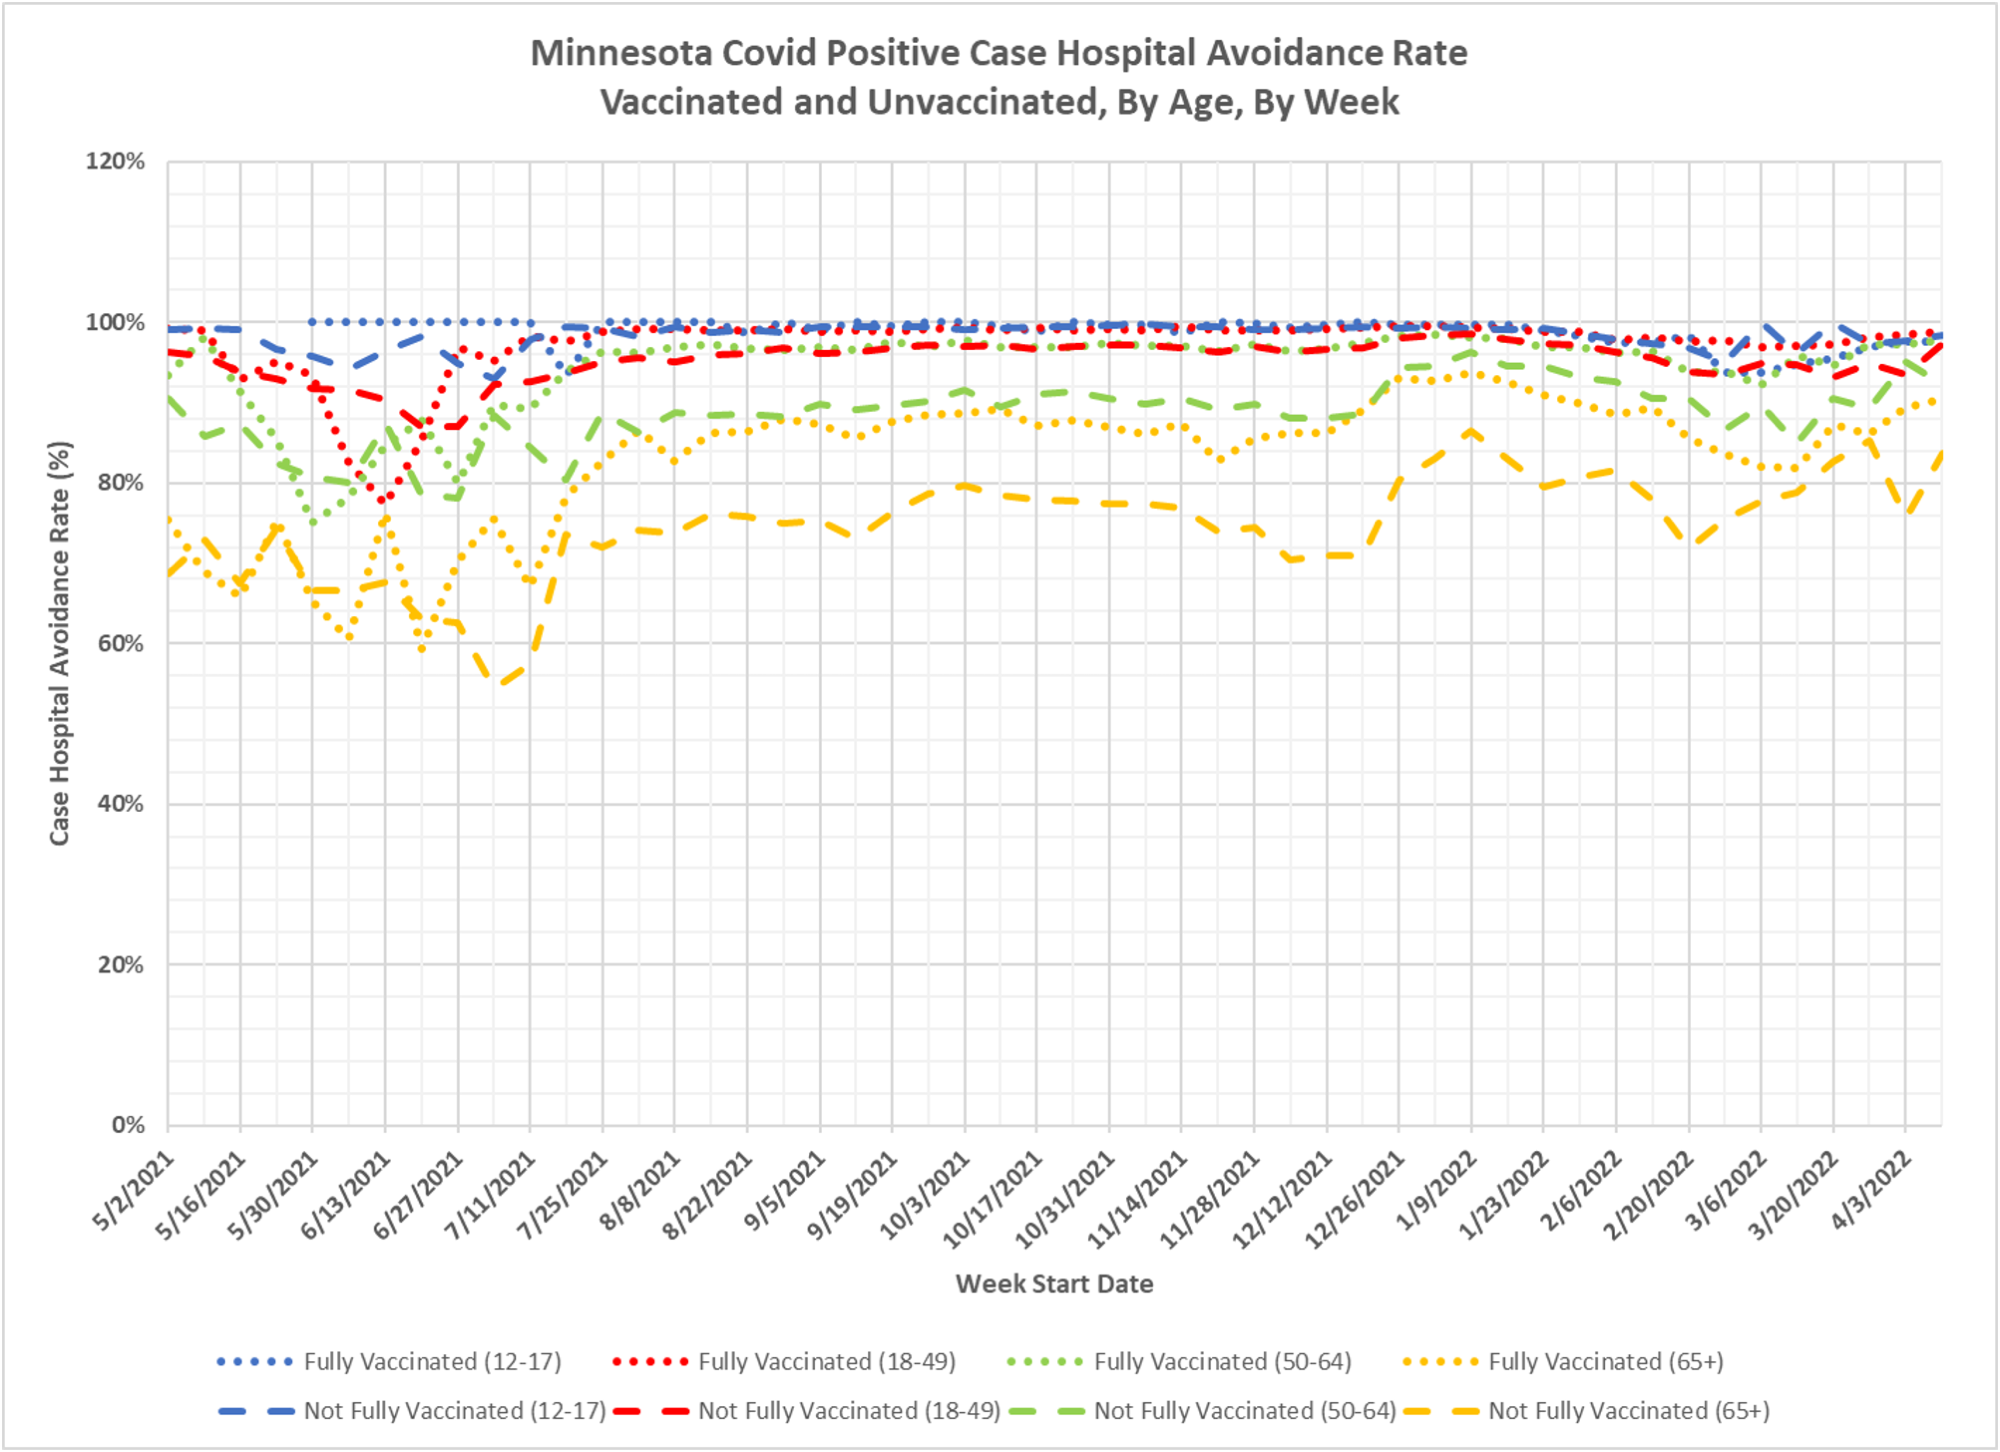
- Fig. 2 displays the hospital avoidance rates per age group per week for the vaccinated and unvaccinated age groups. The overall lack of any real trends here is a little surprising, and requires further reflection and analysis.
- Fig. 3 displays the positive case survival rate per age group per week for the vaccinated and unvaccinated age groups. In contrast to the hospitalization rates, we can see some discernable trends in the survival rates in recent months. Since the start of the Omicron wave of cases in the middle of December 2021 the survival rate whether vaccinated or not for the 65+ age group has increased remarkably. At the same time there was a noticeable improvement in the survival rate for the unvaccinated 50-64 age group. All other age groups have been very close to 100% for an extended period of time.
- On the COVID-19 Vaccine Breakthrough Weekly Update web page https://www.health.state.mn.
us/diseases/coronavirus/stats/ vbt.html the Minnesota Department of Health (MDH) publishes rates per 100k in the graphic Cases, Hospitalizations, and Deaths by Age Group. From these rates per 100k, by multiplying by the relevant age group populations, we are able to calculated the actual cases, hospitalizations, and deaths by age group by week for the vaccinated and unvaccinated populations. The rates per 100k are available in the data file vbtcirates.xlsx linked in the notes below the graphic. - The vaccinated populations are published in the data file available at the link “People Vaccinated, By Age” available on the MDH Vaccine Data web page https://mn.gov/covid19/
vaccine/data/index.jsp. Fully vaccinated people are defined as those having completed their vaccination shots 14 or more days before the start of the week being evaluated.

Any research – or attempted research – regarding the severity of the covid infection based on genetic factors.
The published data shows moderate to high correlation regarding the severity based on vaxed status
On the other hand, based on my personal observation among approx 150-170 individuals I personally know, the higher correlation is the persons health status (healthy vs obese or other factors), The persons individual genetics seems to have a high correlation, and the vax status seems to only have a low to medium level of correlation
for example, my family had super spreader event at christmas with approx 1/2 the family vaxed and the other half unvaxed. the level of severity among the vaxed and unvaxed was very similar. (with the exception of one who was unvaxed who was sick for two solid weeks)
Second example is 35 year old vaxed male had the same level of sickness as his 60 year old unvaxed mom (genetic factor?)
there has been some genetic based research, mostly around the immune system and different genetic variations related to blood type. Not much that is compelling, certainly not compared to the clear role of obesity and other health conditions, which may be partly genetic in origin.
It would seem, on an aggregate basis, that there is little to no benefit in vaccinating persons in the 12-19 age group. On an individual basis, there are some in that age group that would benefit, which leads to my next comment: When will (if ever) the CDC leave vaccination for COVID up to the patient and their doctor? It makes little sense (to me) at this point in time to have the CDC making broad swath group decisions about vaccination. I would prefer that decision be made in consultation with my doctor, who may advise me to get, or not get another booster.