Dave Dixon thought it would be interesting to see survival rates and hospital avoidance rates by age group, and vax status. Might help some people get a grip on what their risk truly is. Some of the trends Dave mentions are likely due to Omicron. And one difficulty with the accuracy of the rates is the unknown effect of prior infection and the unknown accuracy of DOH’s vax matching. We know they undercount. Dave’s notes:
- On the COVID-19 Vaccine Breakthrough Weekly Update web page https://www.health.state.mn.us/diseases/coronavirus/stats/vbt.html the Minnesota Department of Health (MDH) publishes rates per 100k in the graphic Cases, Hospitalizations, and Deaths by Age Group. From these rates per 100k, by multiplying by the relevant age group populations, we are able to calculate the actual cases, hospitalizations, and deaths by age group by week for the vaccinated and unvaccinated populations. The rates per 100k are available in the data file vbtcirates.xlsx available in the notes below the graphic.
- The vaccinated populations are published in the data file available at the link “People Vaccinated, By Age” available on the MDH Vaccine Data web page https://mn.gov/covid19/vaccine/data/index.jsp. Fully vaccinated people are defined as those having completed their vaccination shots 14 or more days before the start of the week being evaluated.
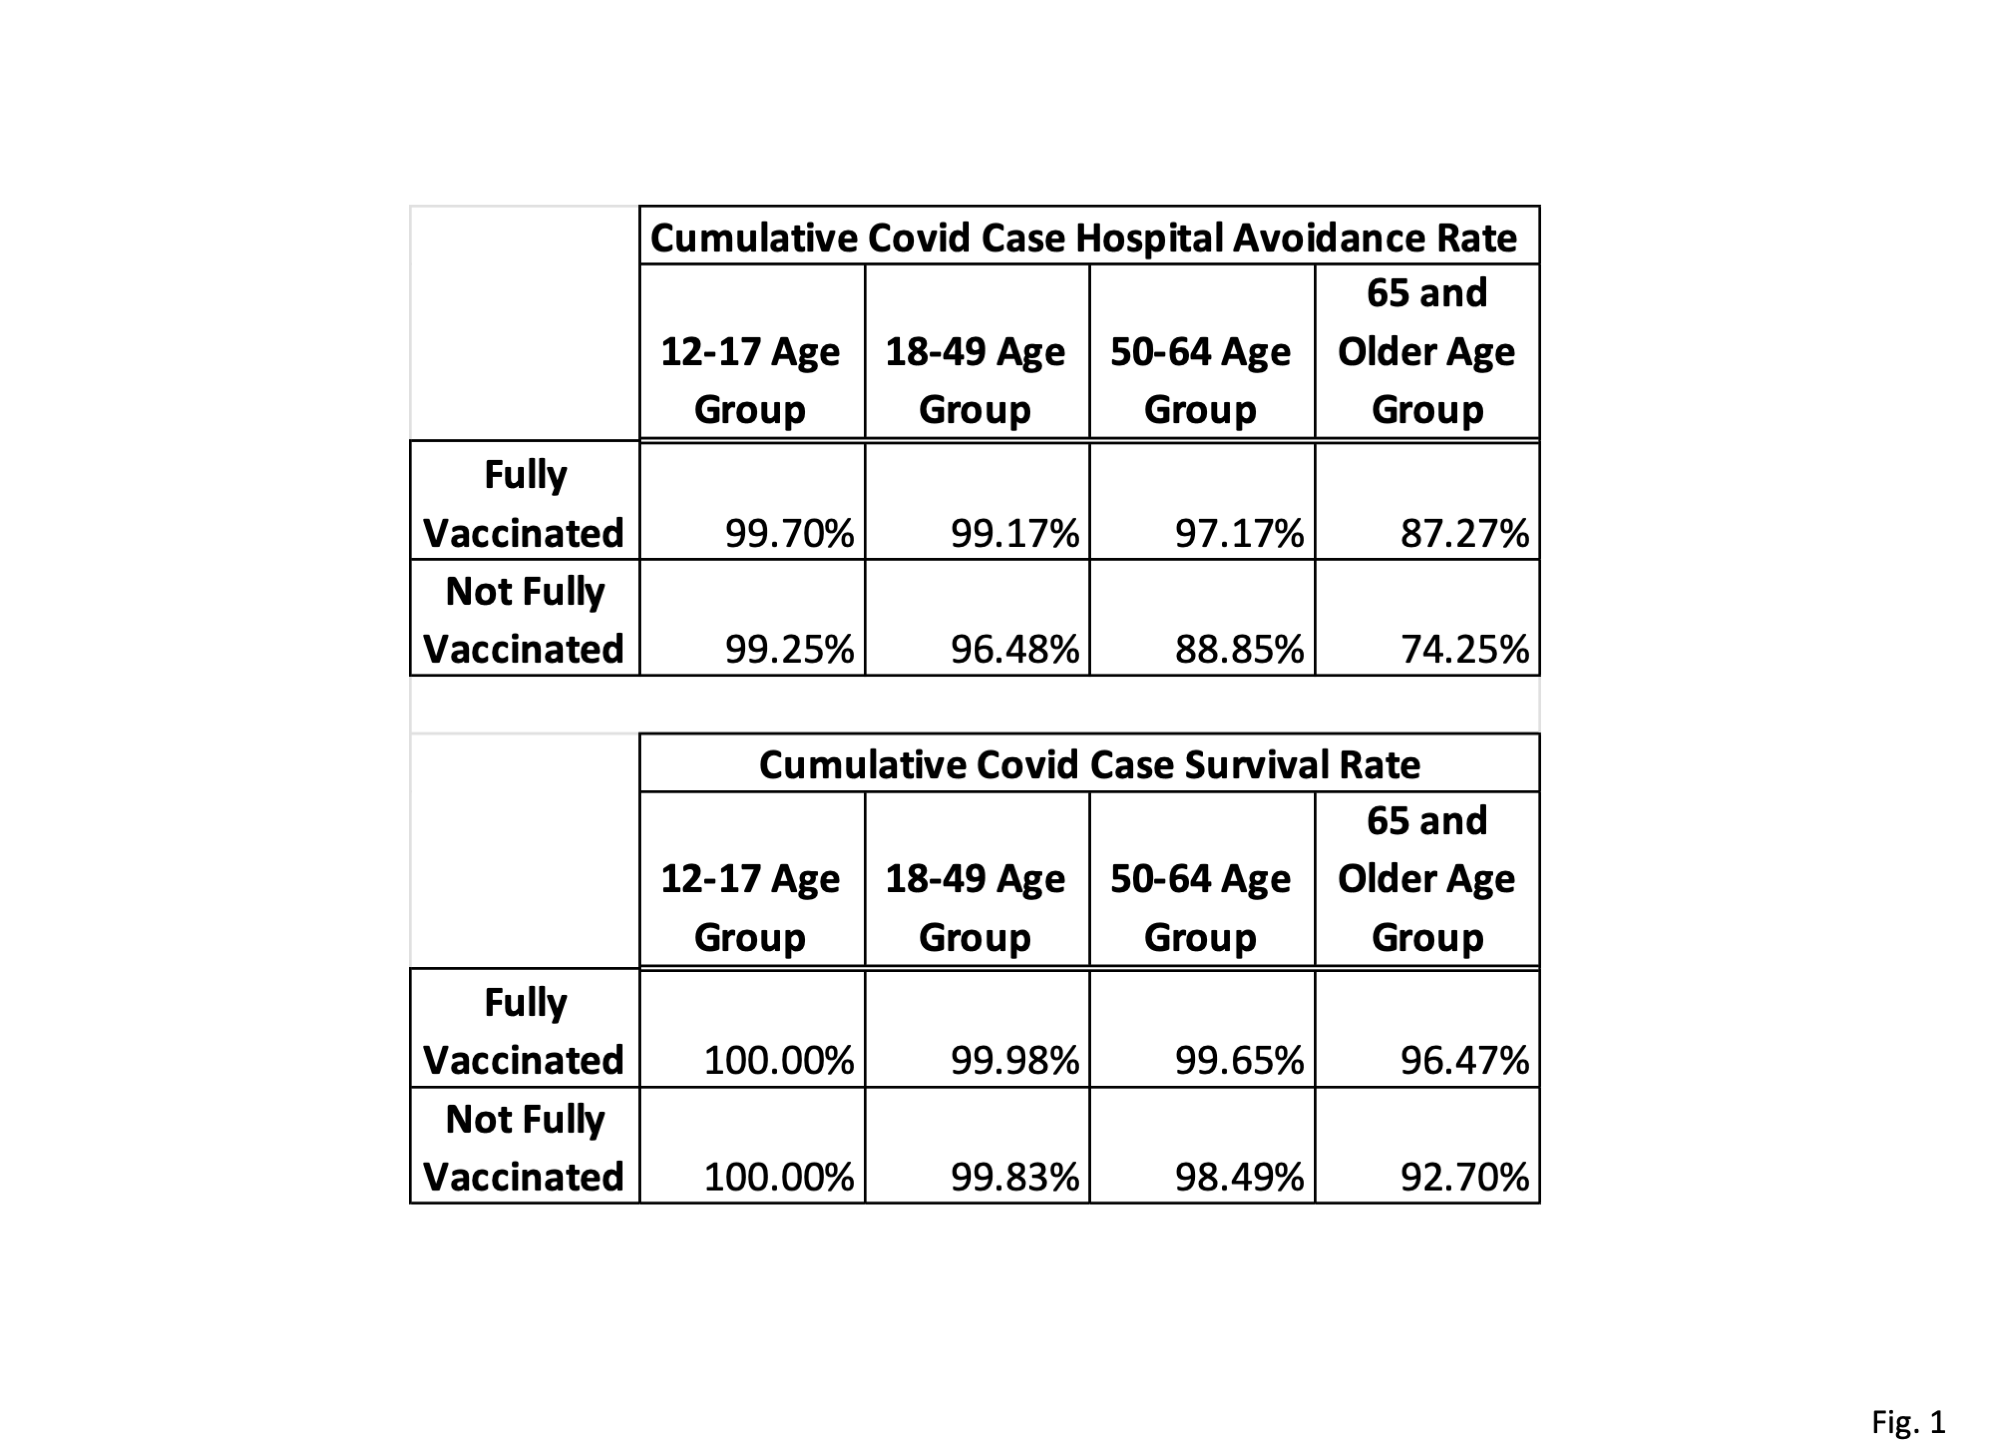
- Fig. 1 shows the cumulative hospital avoidance rate (the rate of those who test positive who are not hospitalized) and the cumulative positive case survival rate, for all positive cases from the week of 5/02/2021 to 12/26/2021. The rate of hospitalization, or rate of death, of positive cases would therefore be 100% minus the displayed rates, if a person were interested in looking at it that way. Vaccination appears to improve the rates of avoiding hospitalization and of survival, especially of the older age groups. However, other factors that might affect these rates are not accounted for, such as differences in general health between the fully vaccinated and not fully vaccinated populations.
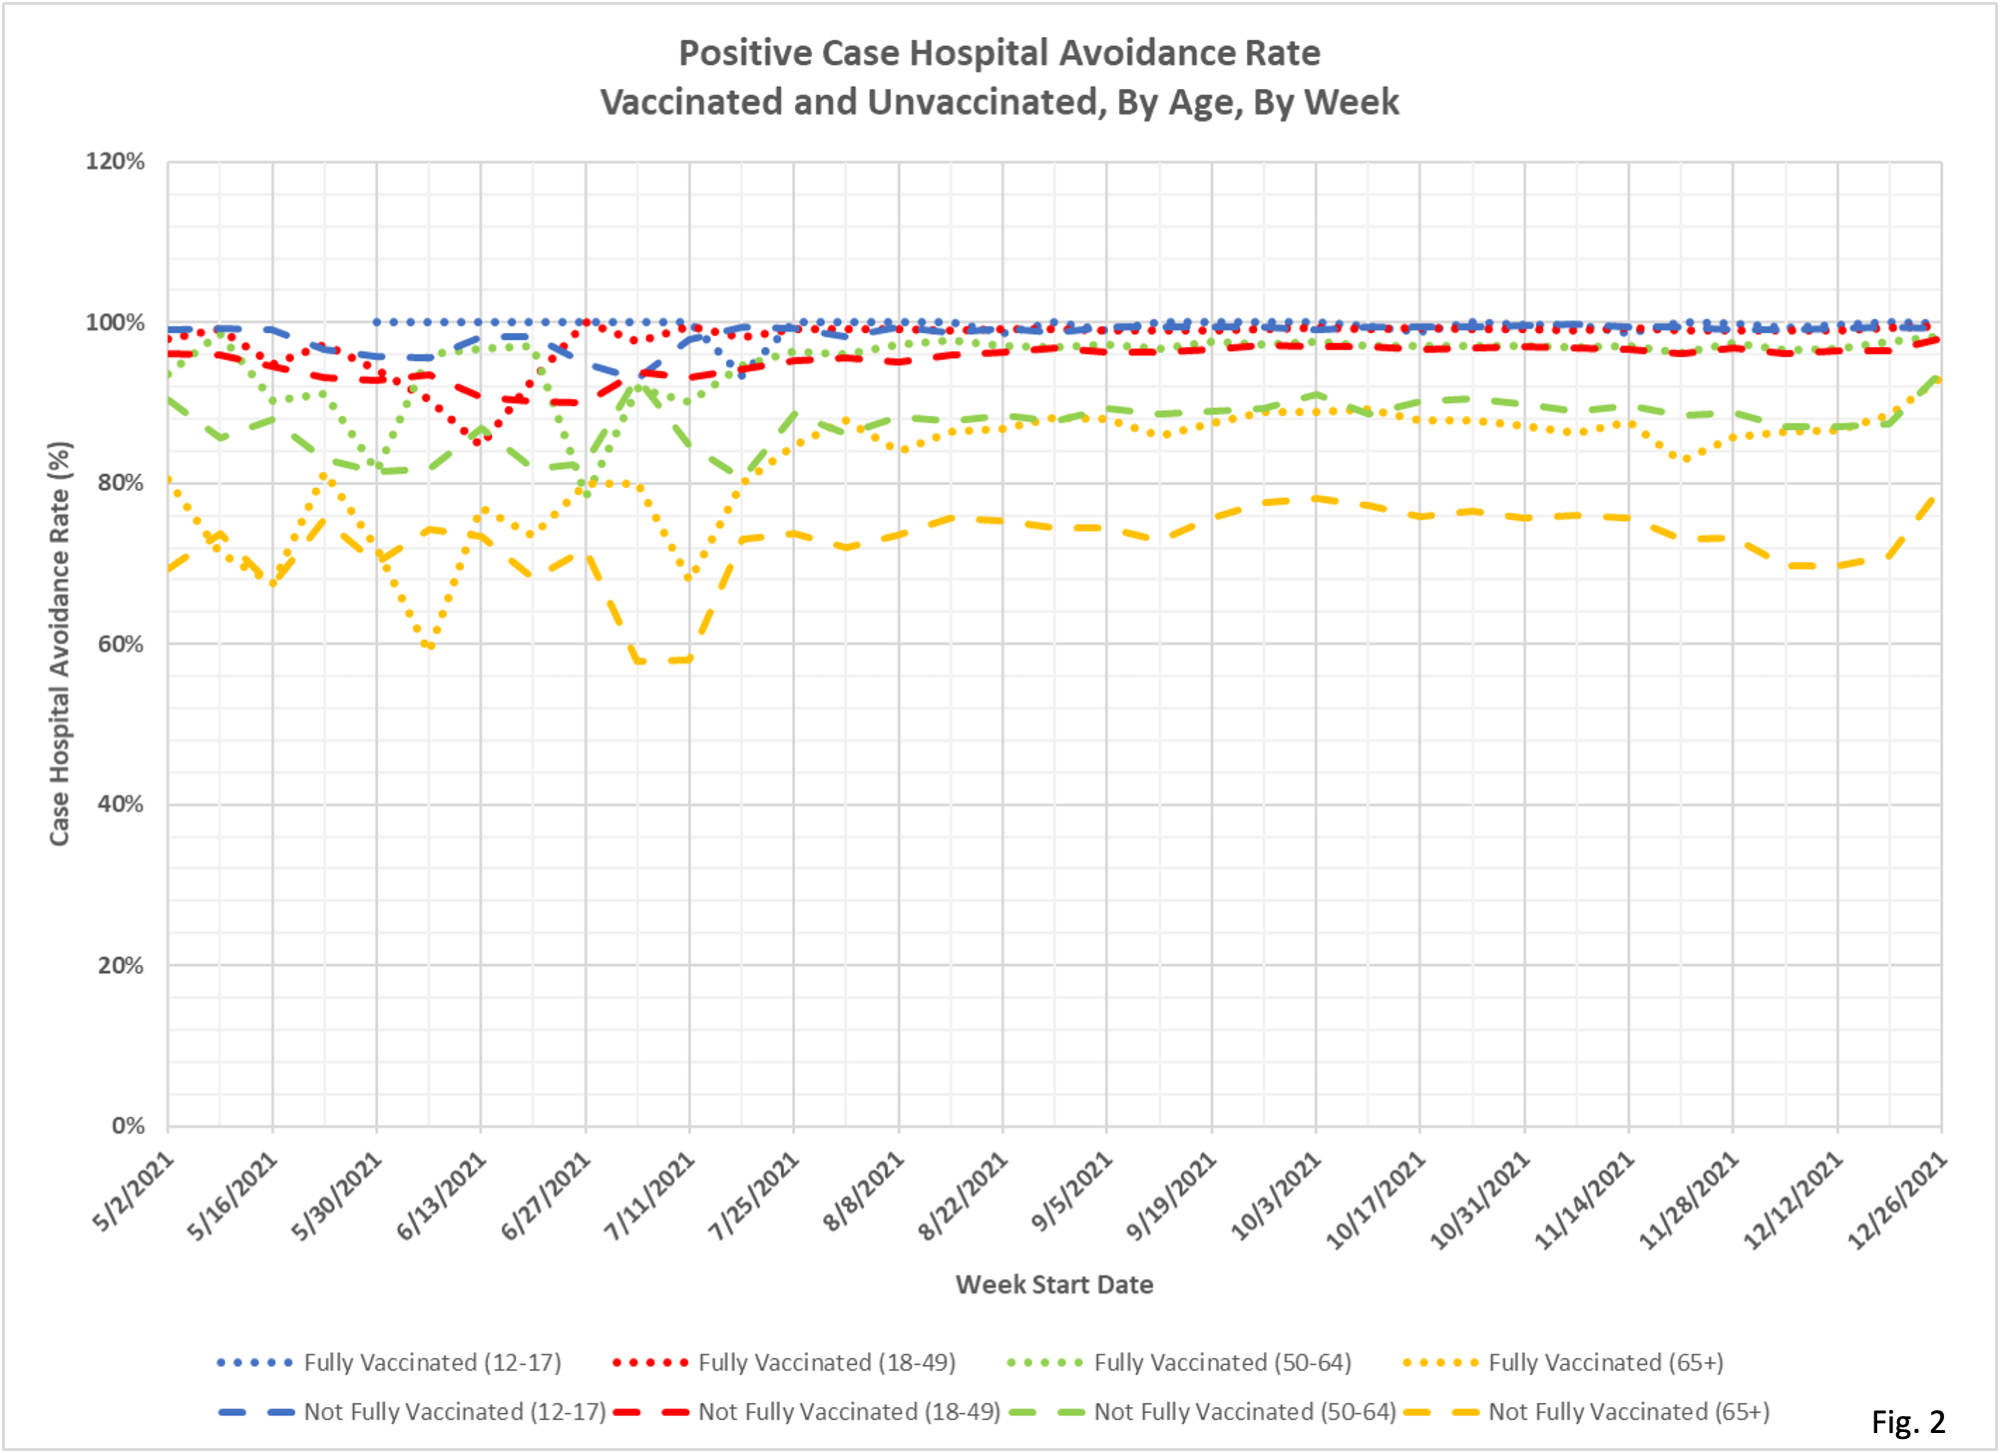
- Fig. 2 displays the hospital avoidance rates per age group per week for the vaccinated and unvaccinated age groups. The improvement in the rates in the last 2 weeks of the chart may be due to incomplete reporting. MDH does update breakthrough hospitalization data periodically so all of these rates are subject to change.
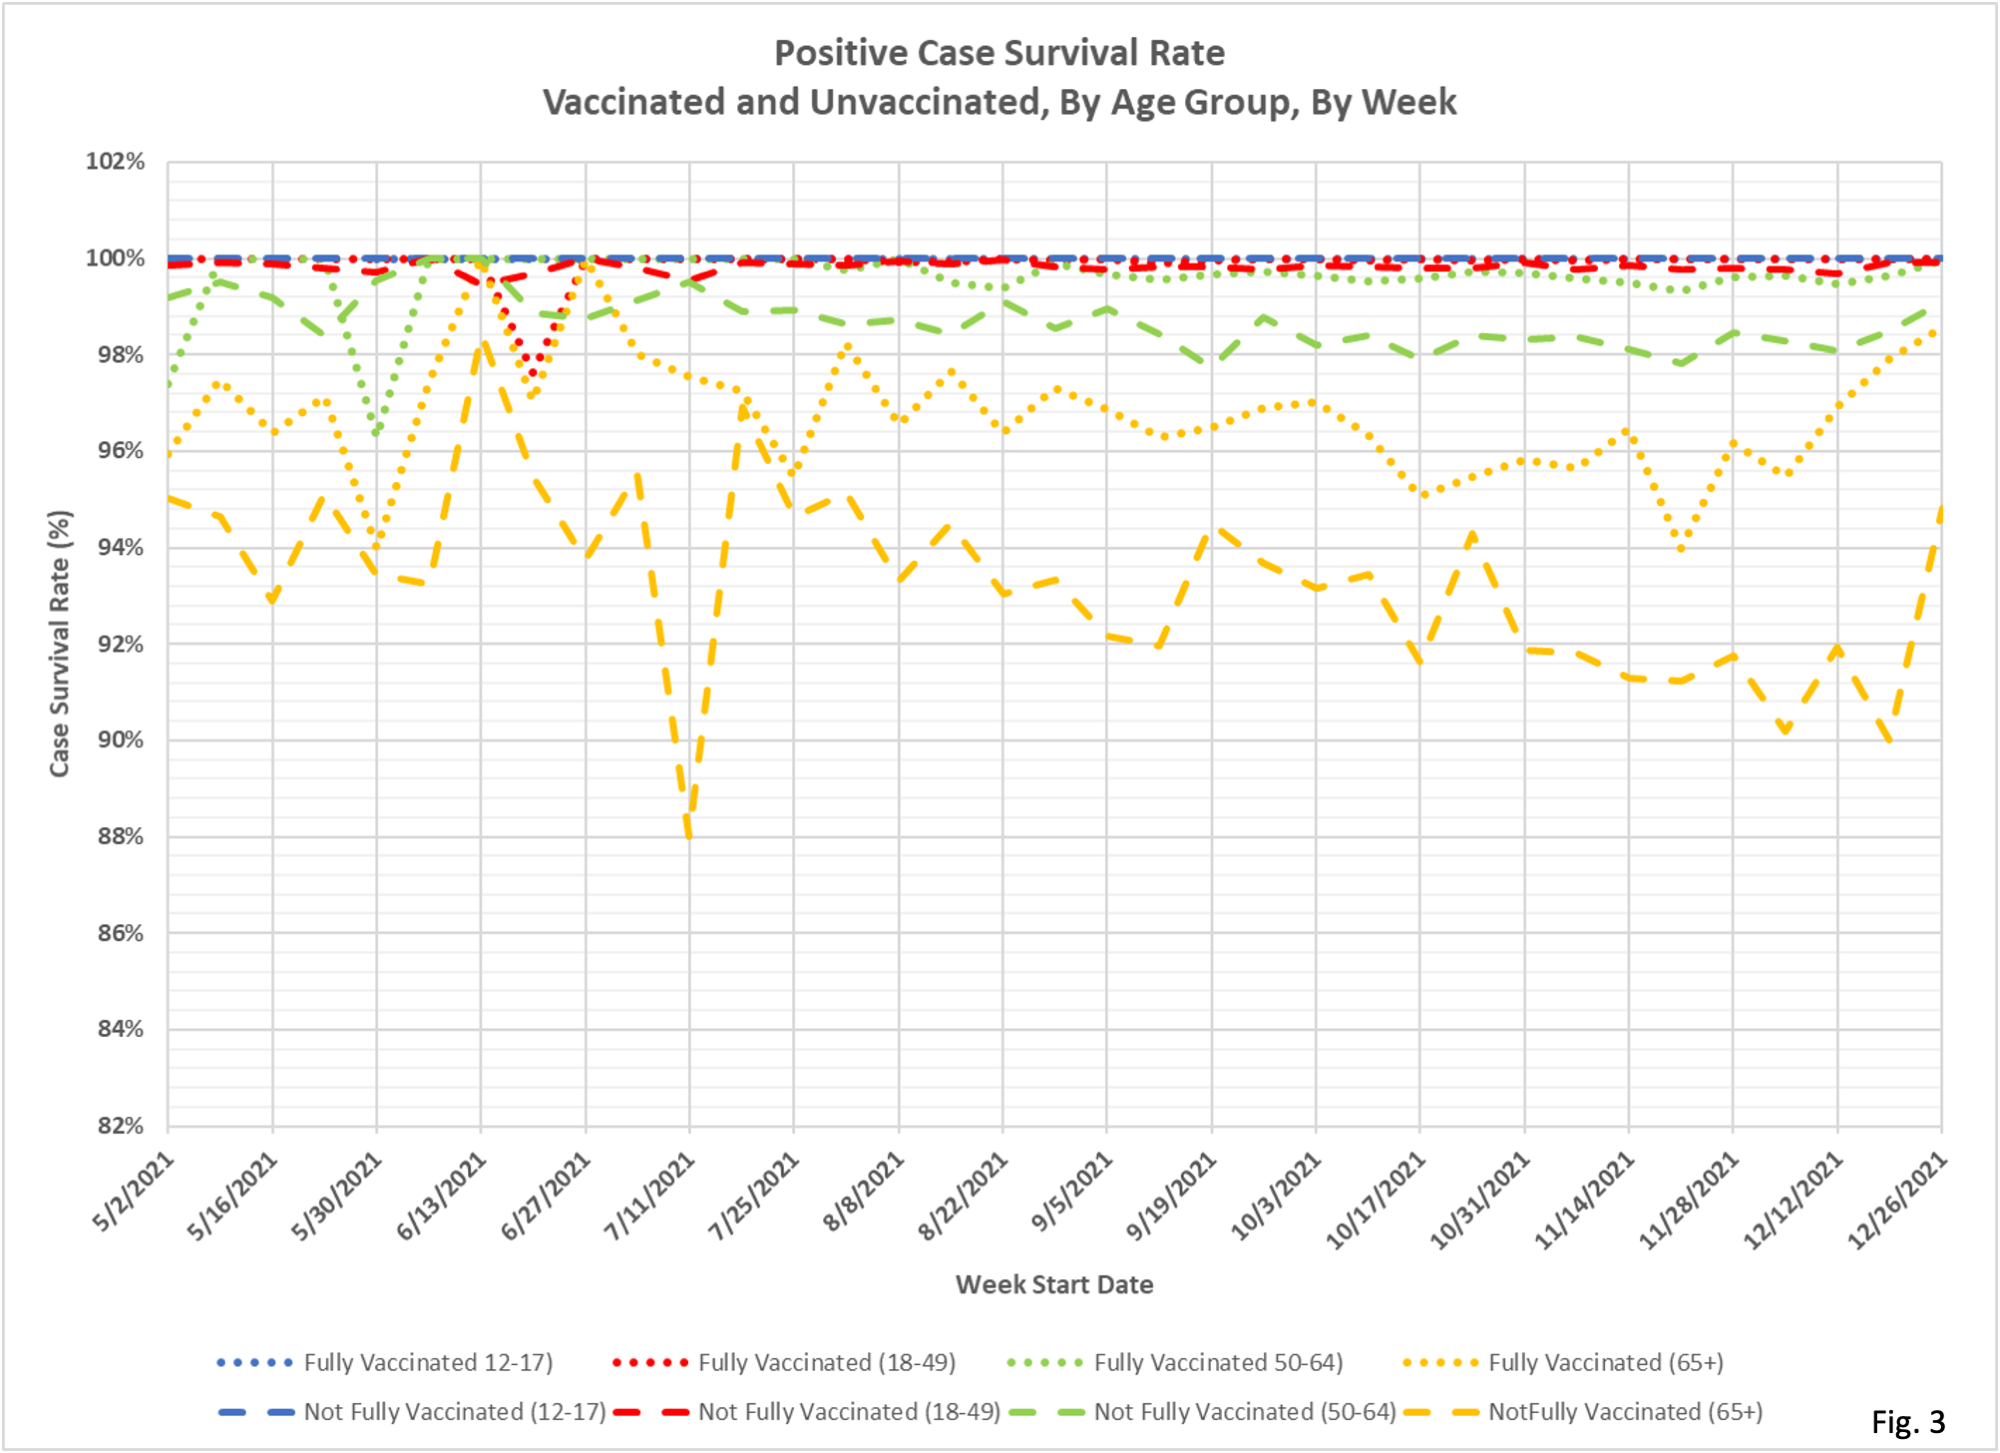
- Fig. 3 displays the positive case survival rate per age group per week for the vaccinated and unvaccinated age groups. Similar to the hospital avoidance rates, the improvement in survival rates in the last several weeks may be due to incomplete reporting. The general decline in survival rates in the 65+ unvaccinated group from July to December 2021 is disconcerting. This was the time period, at least toward the end, when the Delta variant was prevalent. Is the decline in survival rates because the Delta variant was more deadly, because treatment regimens are of reduced effectiveness, or because general health of this population sub-group has been declining? While vaccination improves the survival rates, during this time period the survival rates of the vaccinated also declined. These declining survival rates highlight the need for improved anti-viral treatments.
- Another factor to be considered is how the numbers of incidental infections affect the hospital avoidance and survival rates. We know from reporting by other states that a significant fraction of Covid hospitalizations are due to non-Covid reasons. The same incidental infection effect is undoubtedly at work in the Covid death rates. We have submitted Data Practice Act requests to MDH which have so far been unfulfilled. Effectively, the true numbers of people who are hospitalized or die from Covid are much lower than the rates published by MDH.

Love this way of looking at things, really helps give a sense of “absolute risk reduction” rather than relative risk reduction. For the 18-49 cohort, vaccination reduces your risk of dying by 1.5/1,000ths
For individuals that are not obese, it’s a fraction of that. For those without comorbidities, a fraction of that. If you are a somewhat healthy individual under 50, the absolute risk reduction is so small, than even a very small risk of harm must be given large weight in the calculation of net benefit.