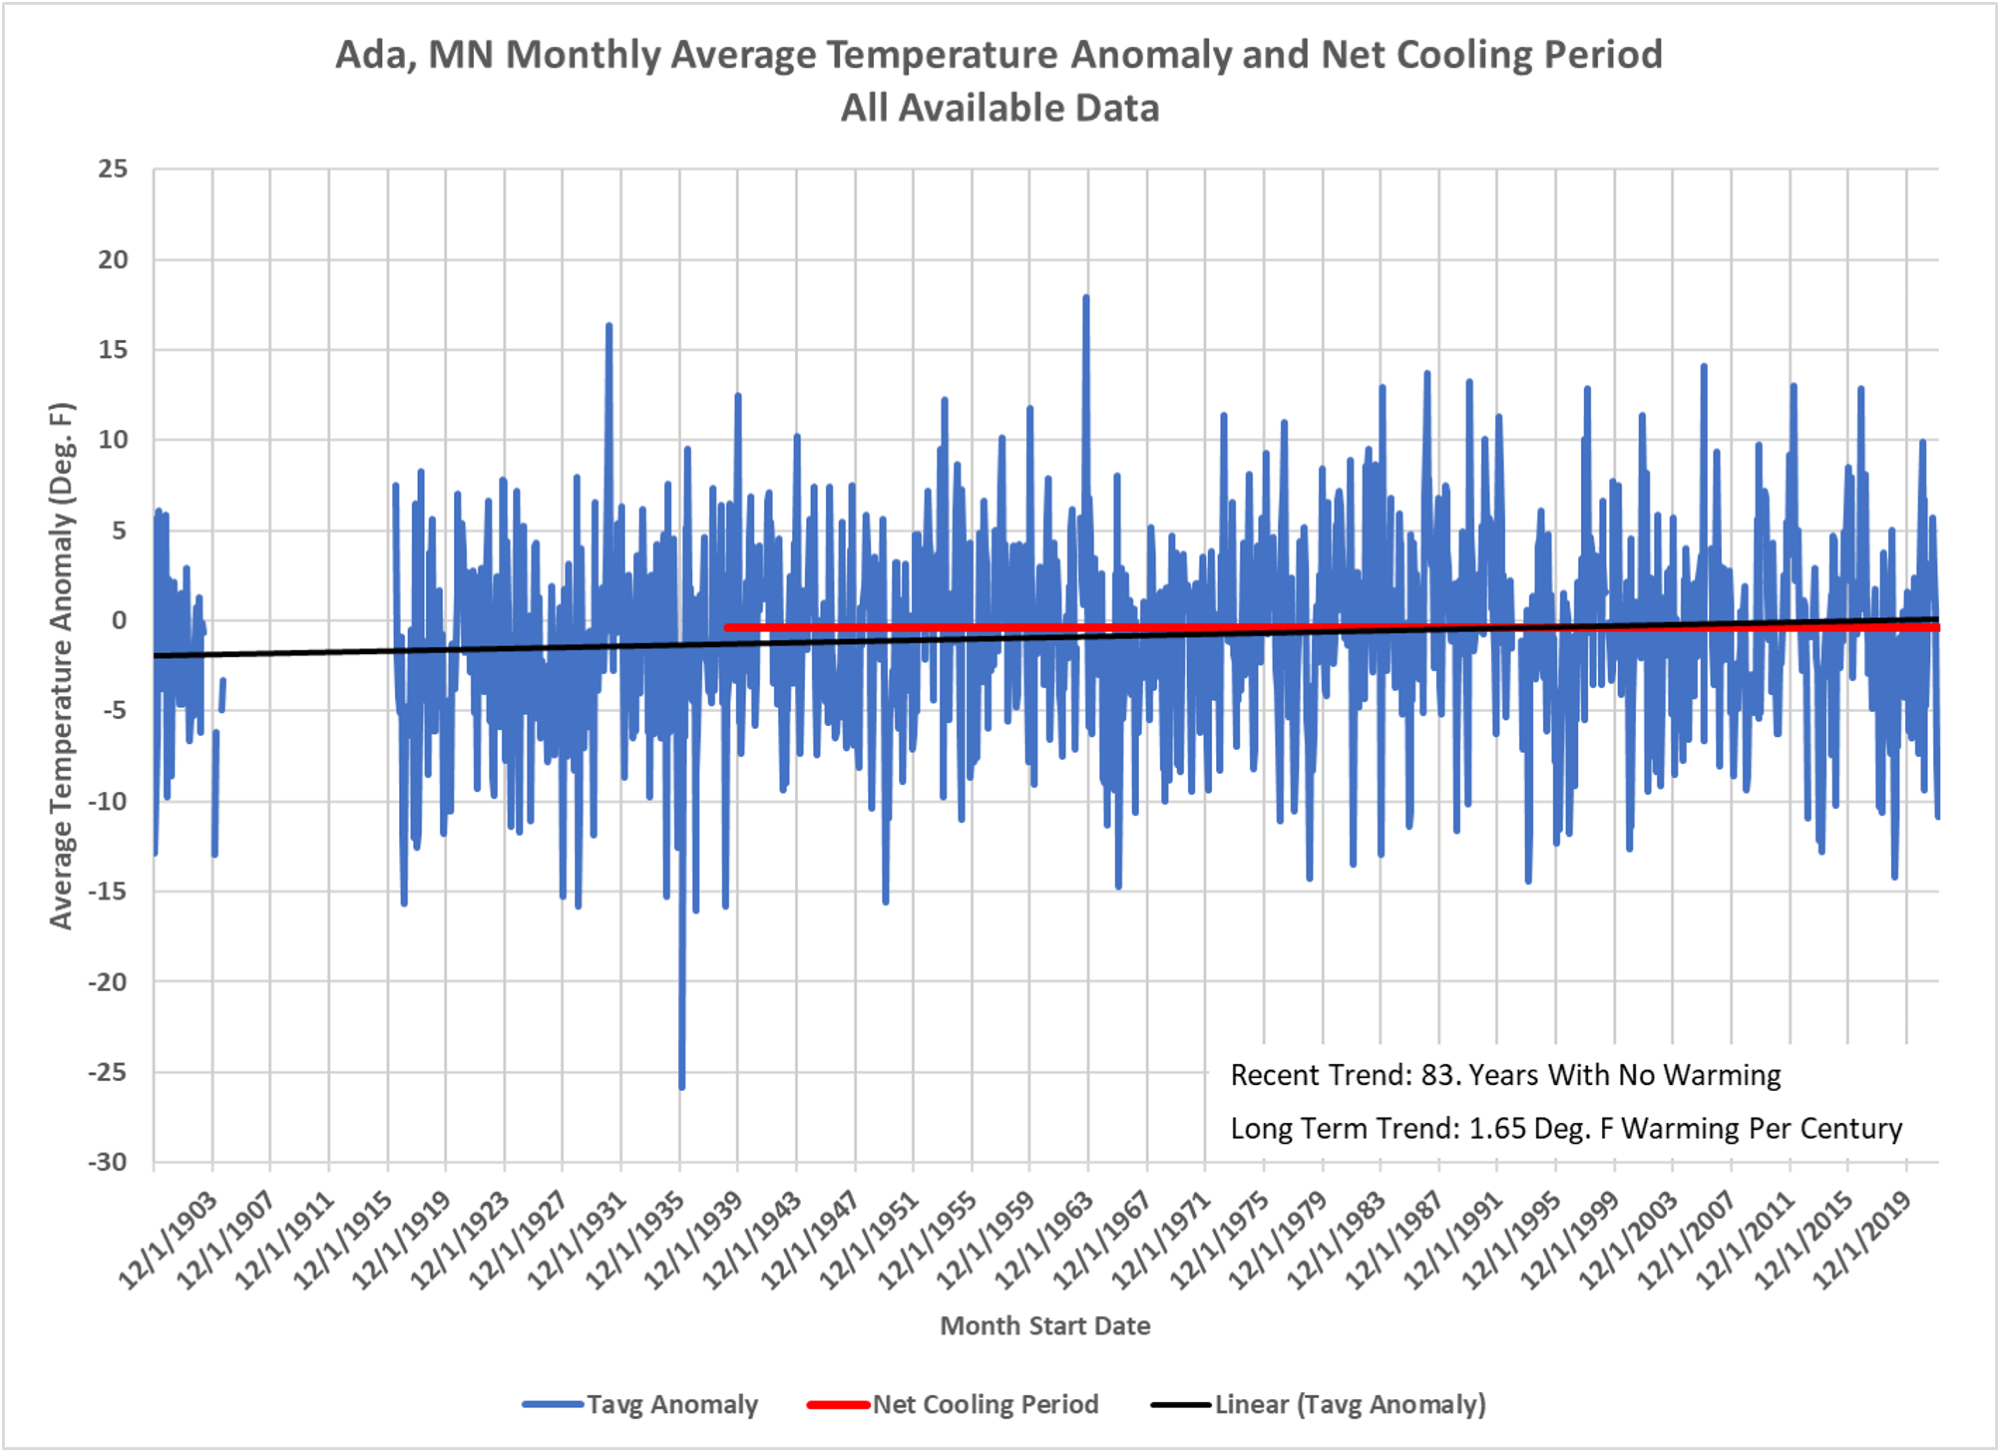
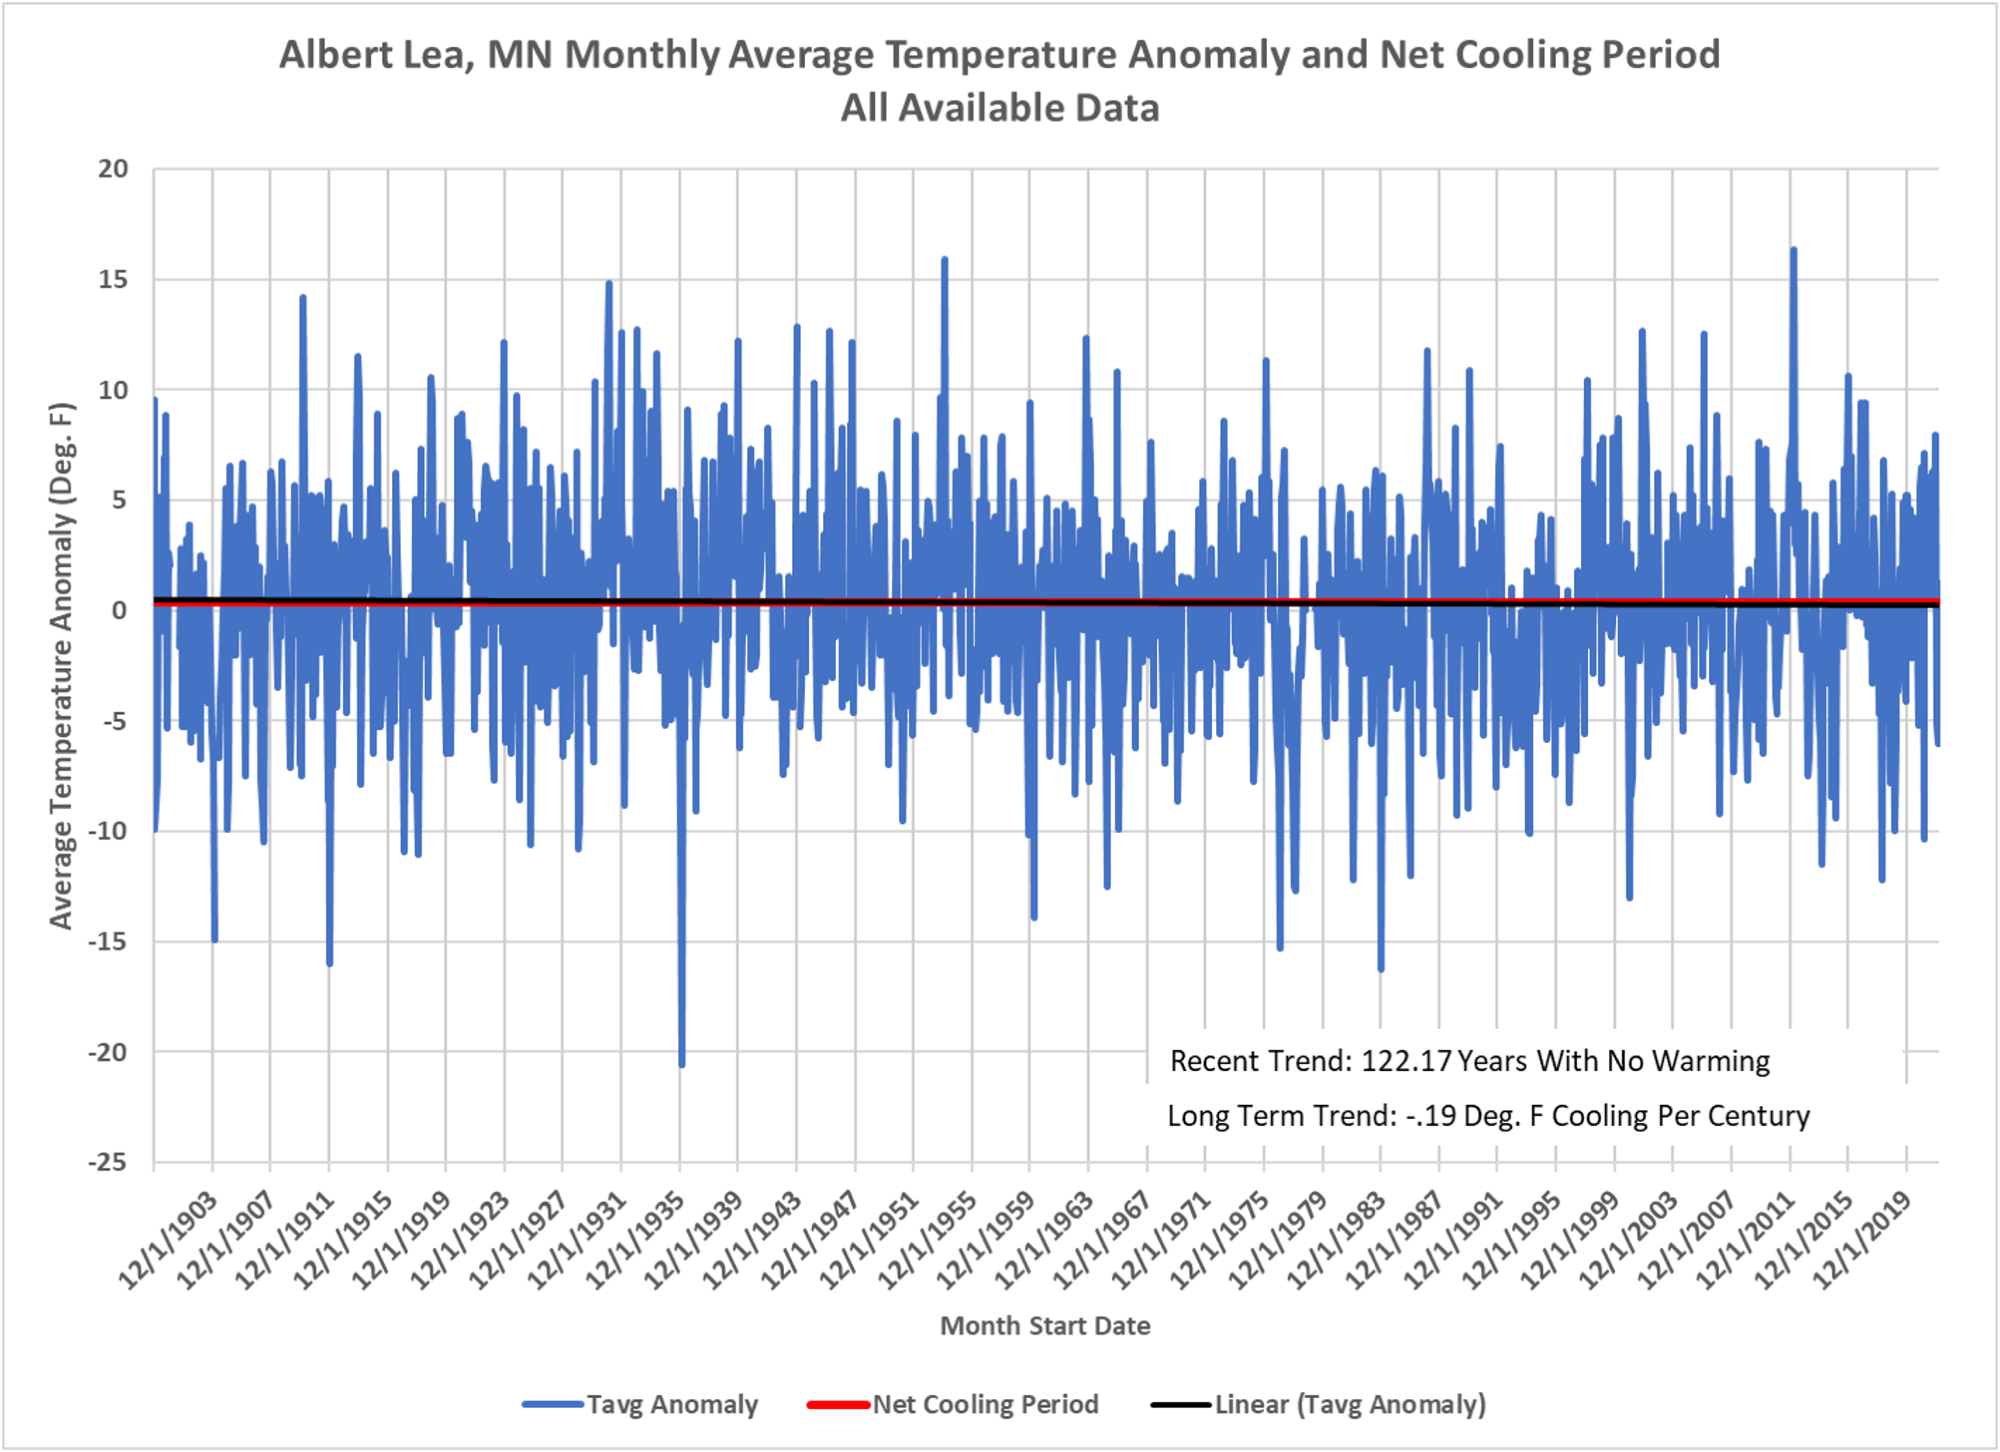
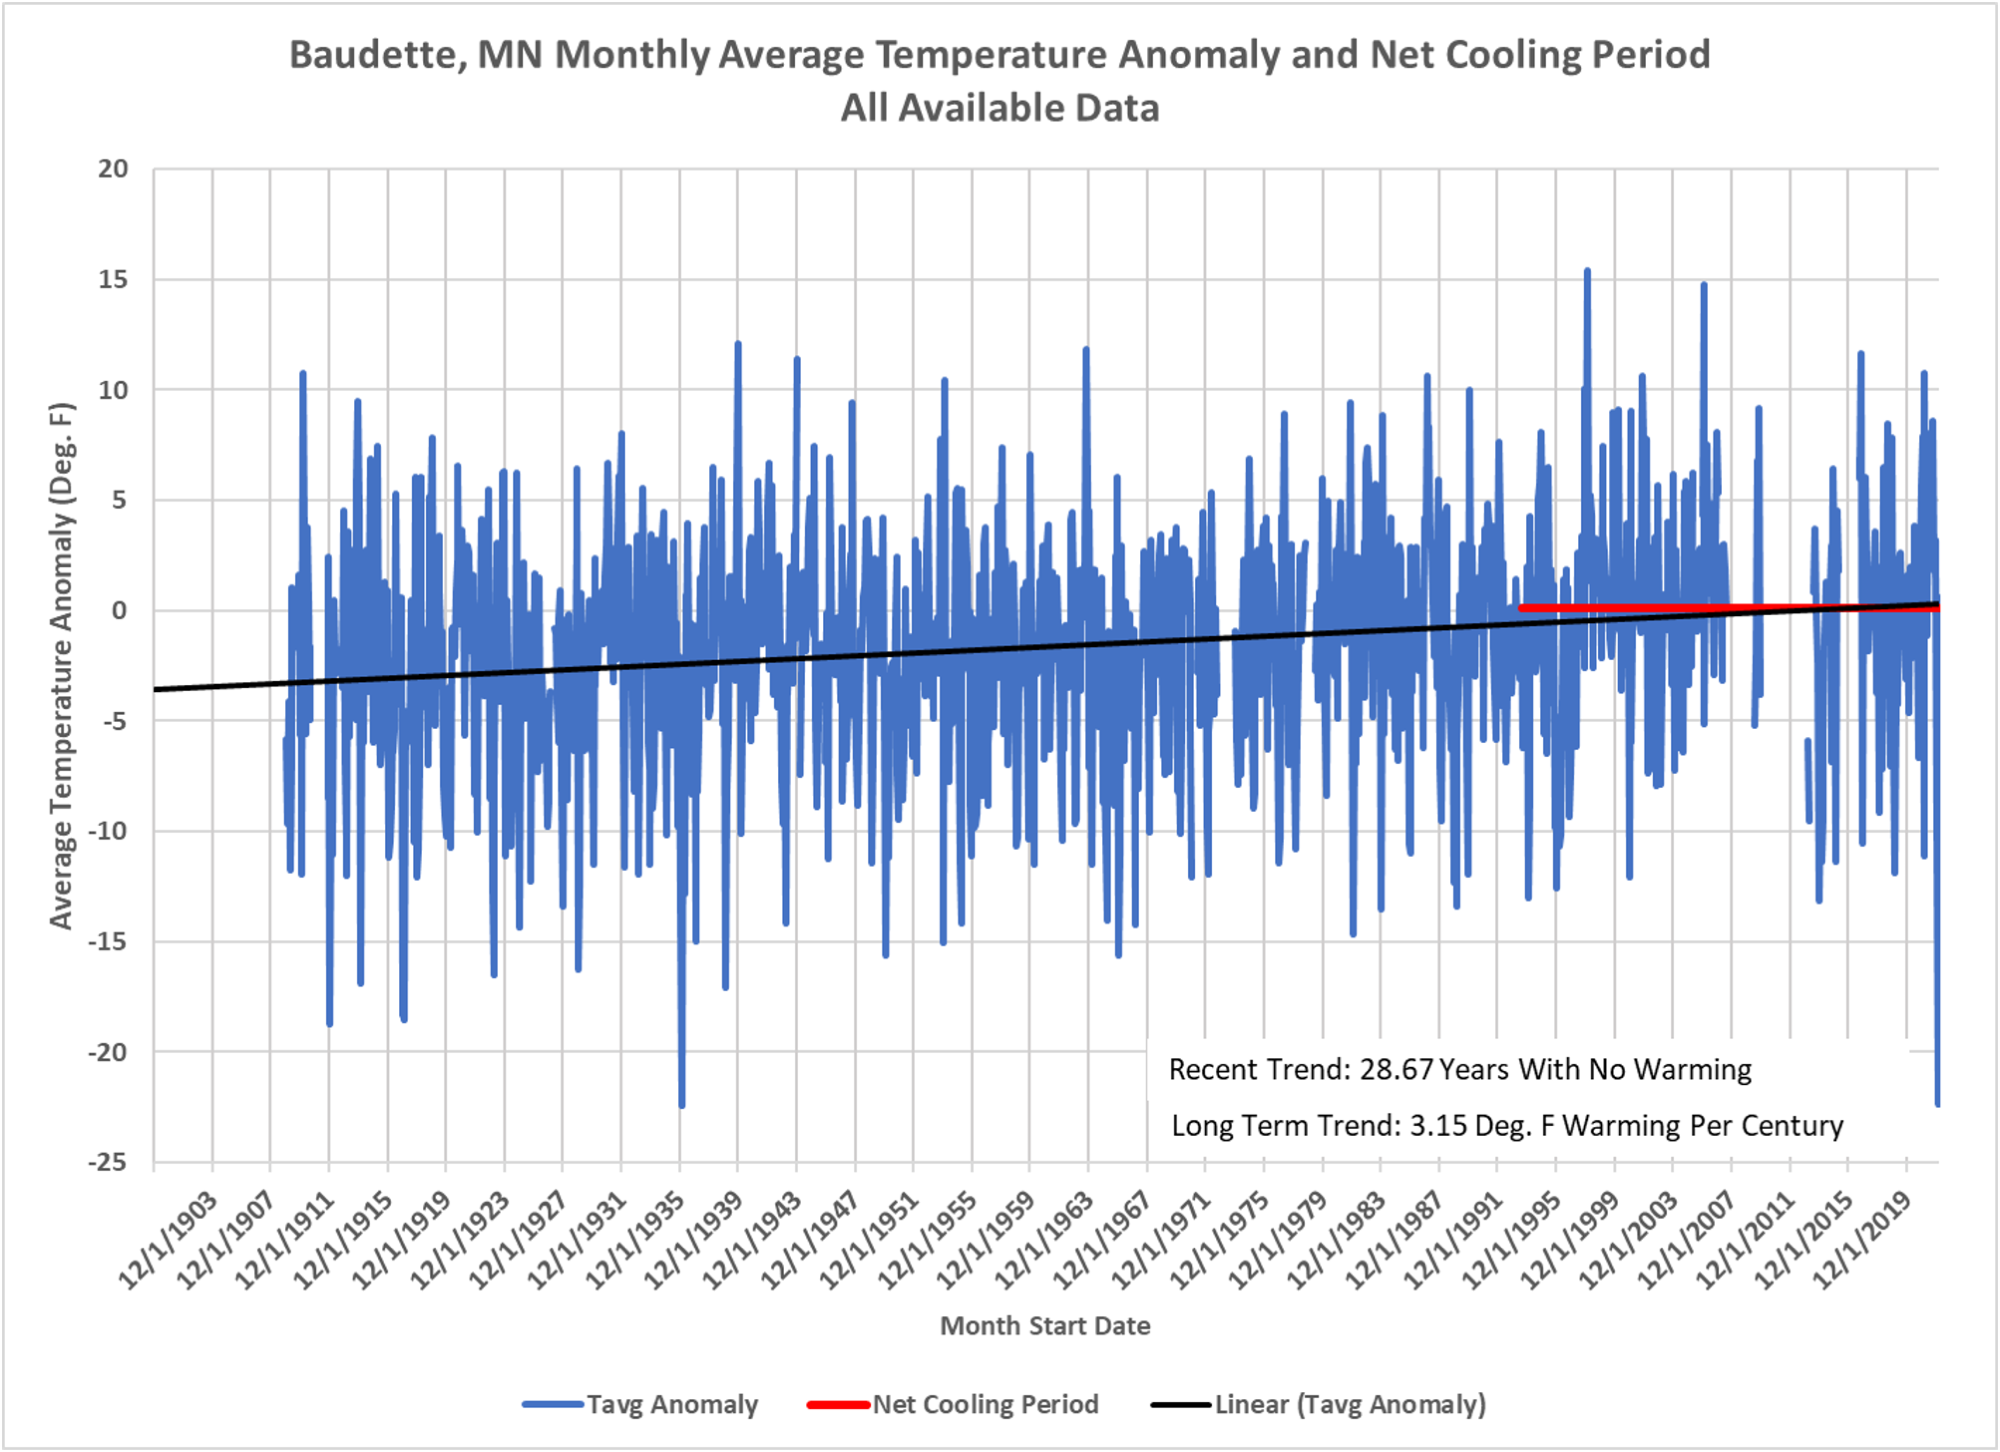
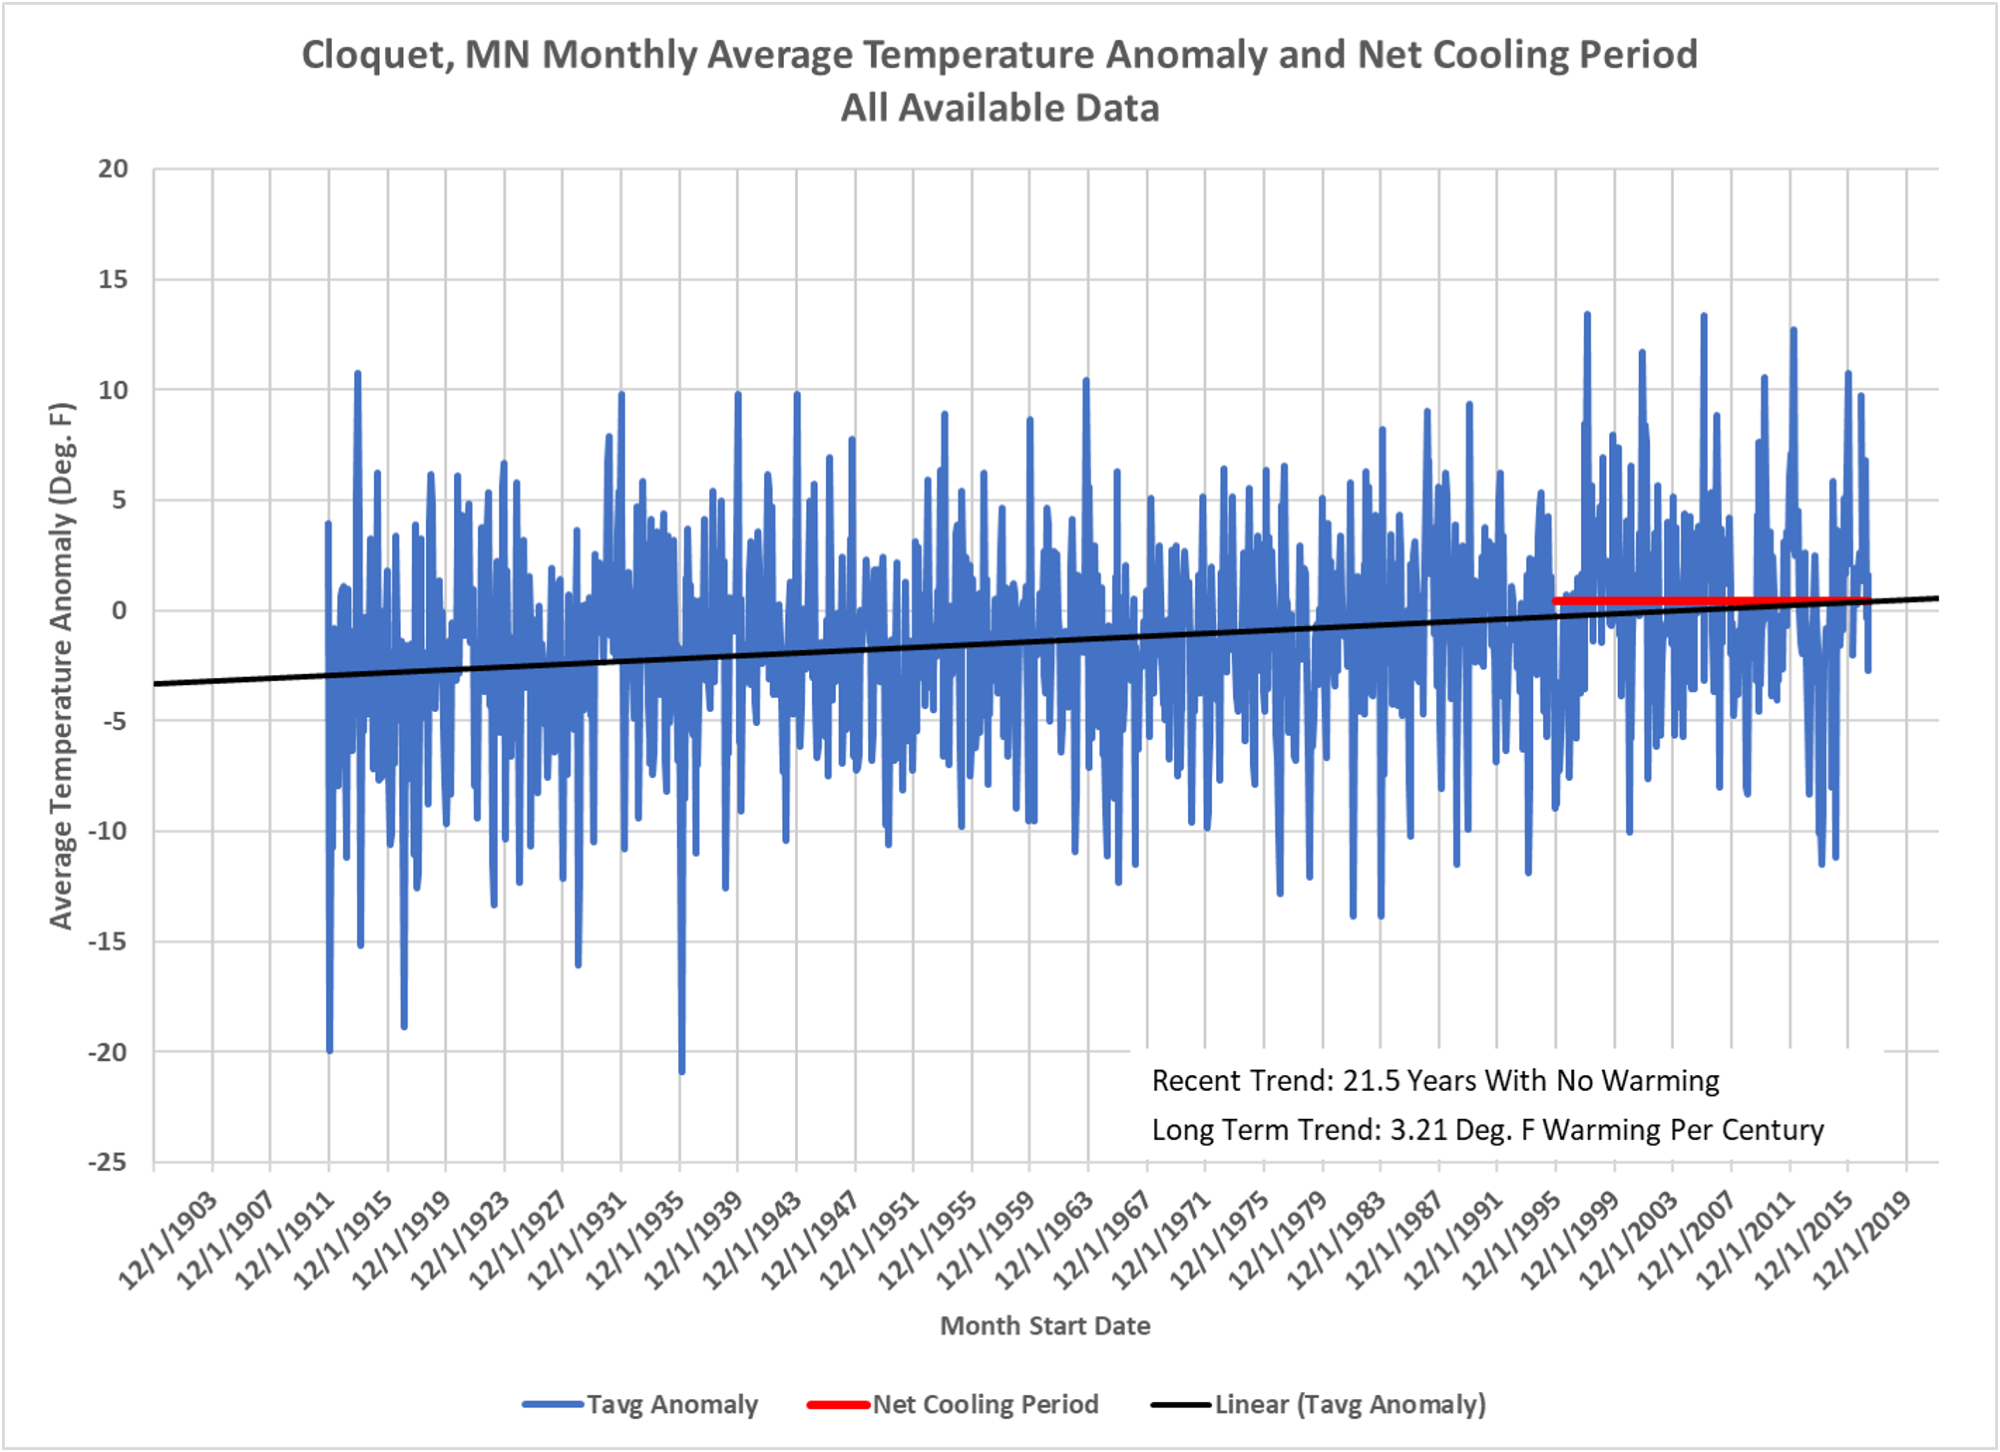
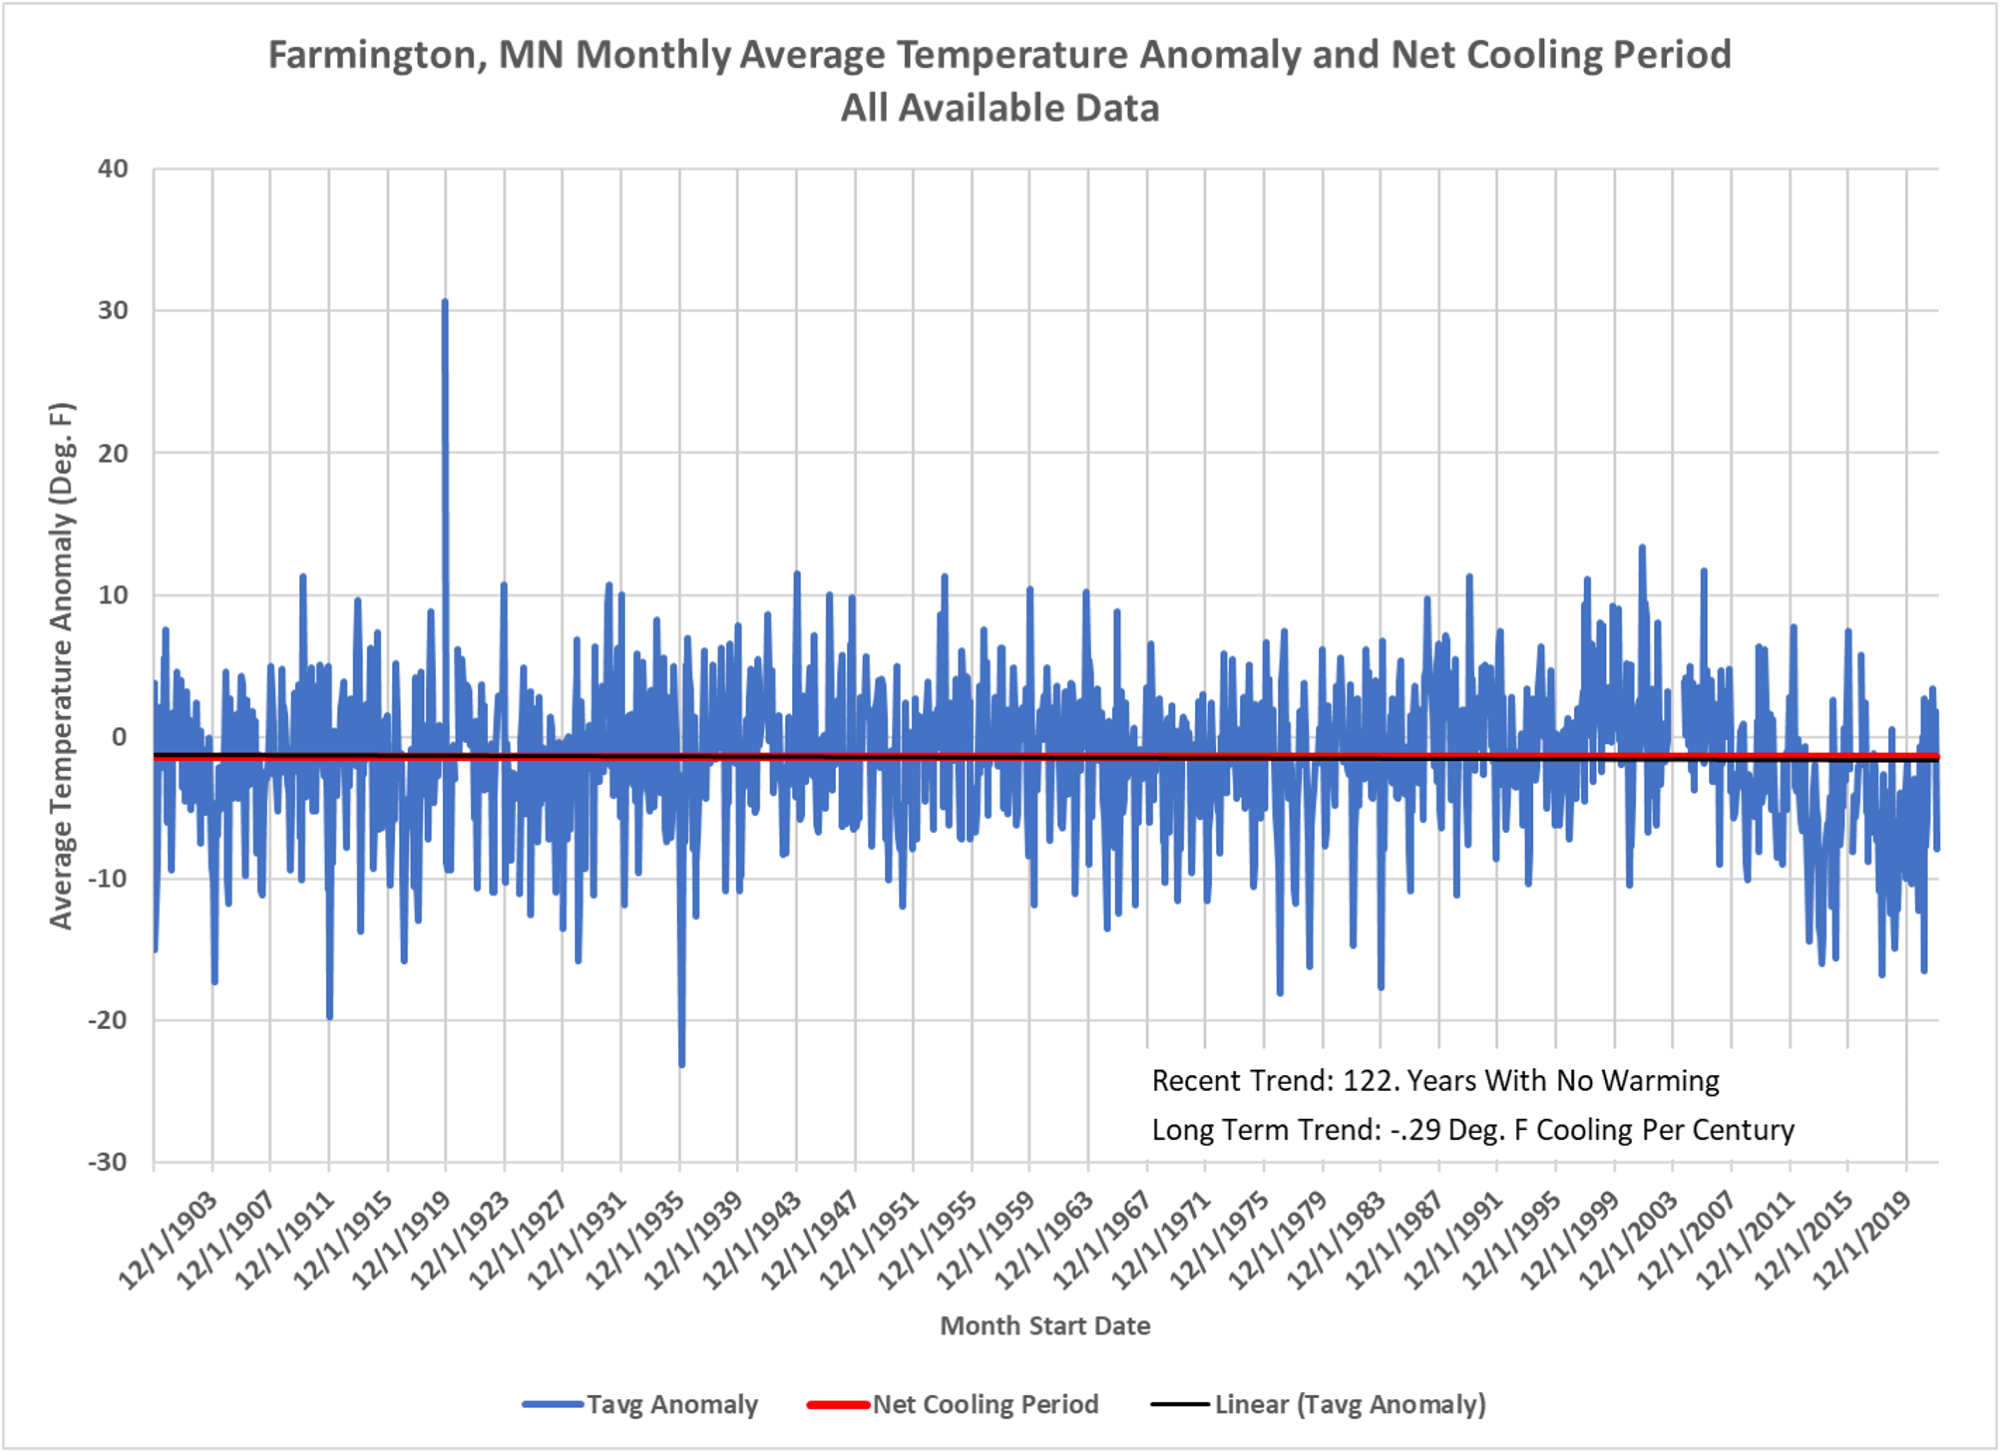
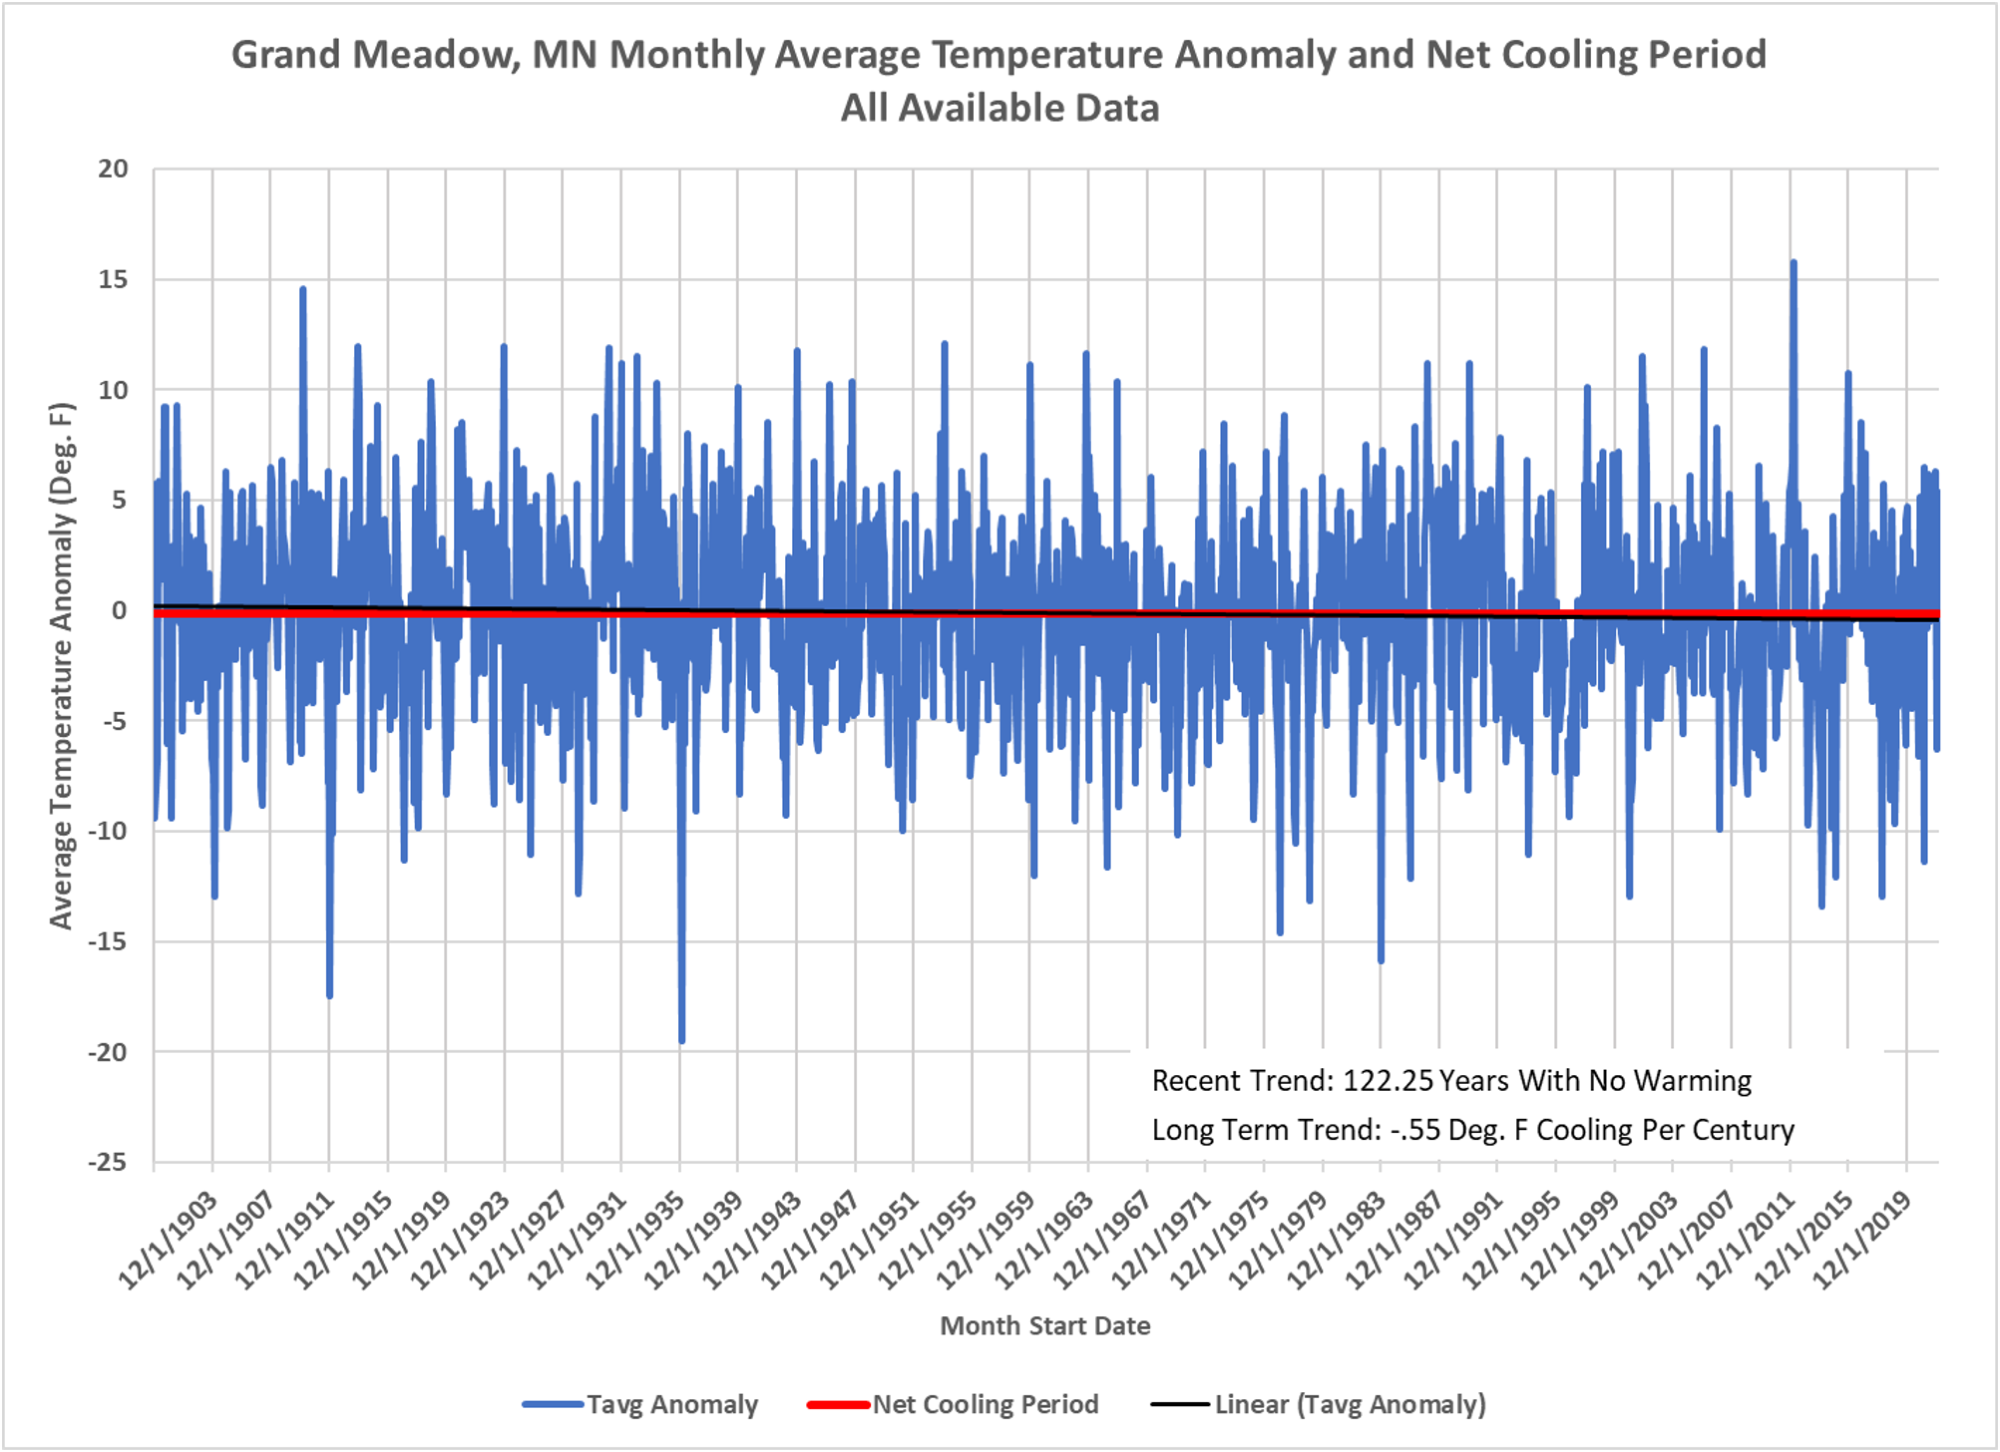
More of Dave’s work on long-term temperature records from rural Minnesota locations. The variation is interesting, suggests some local factor may be affecting a particular thermometer, or that Minnesota has some interesting micro-climates. The three with more warming are in northern Minnesota. The three with a little cooling are more in the south of the state. The first one, Collegeville, is kind of south center of the state. A lot more work to do to understand potential issues, but an interesting set of data at this point.
 Dave’s notes:
- We are continuing our examination of Minnesota weather stations, which we began here: https://healthy-skeptic.com/2022/04/17/massive-climate-warming-in-rural-minnesota/. The stations presented here are the first 6 sites in Minnesota that are part of the United States Historic Climatology Network (USHCN). The USHCN is a subset of weather stations that were selected on the basis of “spatial coverage, record length, data completeness, and historical stability”, as described here: https://www.ncei.noaa.gov/products/land-based-station/us-historical-climatology-network. Note that accuracy of the temperature measurements isn’t necessarily a factor in selecting these sites. Proximity of buildings and pavement is suspected of influencing temperature measurements. In future installments on this project we will evaluate the impact of siting quality on the temperature trends in Minnesota.
- The National Oceanic and Atmospheric Administration (NOAA) publishes monthly high, low, and average temperatures for each USHCN site, on both a raw and an adjusted basis. For our effort we are not using this published data, but instead are using the raw daily temperature data downloaded from NOAA here: https://www.ncdc.noaa.gov/cdo-web/ and calculating our own monthly averages. We are avoiding use of the official USHCN data sets for now based on some reports that the adjusted versions of the USHCN data tended to increase long term warming trends. For example, here is an analysis at Climate Audit: https://climateaudit.org/2007/02/16/adjusting-ushcn-history/ which displays how the USHCN in the overall US had an increased warming trend from one adjustment version to another. Here is another analysis of USHCN adjustments at Watts Up With That: https://wattsupwiththat.com/2012/04/13/warming-in-the-ushcn-is-mainly-an-artifact-of-adjustments/. It would be logical for us to eventually compare the raw and adjusted versions of the USHCN data site for each site.
- After downloading the daily data the only changes made are to remove days with no data. When the data is downloaded days with missing data appear as zero, and if left in the data set would be treated as zero degrees in the analysis. Fortunately days with missing temperature data are also missing the time of observation notation, giving us a way to remove the days which are missing versus the days that are actually at zero degrees.
- After calculating the average temperatures for each month, a baseline for each month if determined by averaging each month from January, 1981 through December, 2010. The anomaly for each month is computed by subtracting the baseline monthly temperature from each month’s average temperature.
- The Net Cooling Period is calculated by evaluating how far back from the most recent month that a linear regression has a negative slope, indicating a cooling temperature trend. This is illustrated as the red line on the chart. The overall temperature trend is shown in black, using the built-in Excel linear trend function.
- Of the 6 sites evaluated so far, out of a total of 33 Minnesota USHCN sites, 3 have shown a long term warming trend, and 3 have a very slight long term cooling trend.
(charts here)


There are noticeable trends.
Perhaps a 5 and a 20 year average could be added.
generally anything less than 30 years clearly isn’t climate, and really, I think you need at least 100 years, maybe more to say there is some longer term climate shift at work
Viruses are gonna virus and climate is gonna climate ! We have no control over either of these. Have another cup of coffee, hug and spend time with your loved ones and treat all others kindly … it’s a relatively short ride 🙂
So Baudette and Cloquet have both warmed over the past 120 years, but cooled over the last 25-30 years when they should have been warming according to the global warming cult? Cloquet is close enough to Lake Superior which can produce wild swings in the weather. It’s won’t produce quite the temp swings that the weather stations in Duluth will, but it’s still enough where the trends over time might not be as meaningful as those of cities that don’t have a lake that’ll affect the weather so much.
It’s quite easy to see that the global warming cult’s ultimate goal is destruction of American capitalism and the West and nothing to do with reducing pollution. If the goal were to reduce pollution, they’d spend their time in places like China and India trying to get them to convert their coal plants to natural gas or nuclear. But it’s always America that has to change, not anybody else.
America is in the globalist cross-hairs because we’ve spent the last 80+ years, via the CIA and other similar groups, running the world our way. We’re finally starting to be treated the way we’ve treated hundreds of other countries. It feels very uncomfortable not trusting the media, financial, medical, educational and food systems. That’s what every day is like in nearly every other country. I’m not sympathetic towards of supportive of this agenda, but can certainly understand why it’s getting traction.
If you look closely, you will find most places are warming are metro areas. UHI anyone.
Yeah, that is why we are only looking at the more rural stations, to avoid that, but there still can be siting issues, so we are checking on that too–can’t have the thermometer sitting in an asphalt parking lot