Dave Dixon has done tremendous work on CV-19 data, but his skills as a data analyst and his interests go beyond that. As he notes below, he has tracked temperatures in his area of Minnesota for some time. For those not familiar with the sorry state of so-called climate science, in the futile pursuit to stop minor human impacts on climate, the temperature data sets from the US and around the world have been substantially “adjusted”, with those adjustments almost always seeming to make the past look colder and the present warmer, so that we can see a supposed big jump in global temperatures. Not sure why those adjustments are even needed and far better minds than mine have more than adequately destroyed the raionale for those adjustments. Among the real issues with temperature data is that as the US and the world become more urbanized, city and suburban temperatures are affected by the heat impacts of such dense population areas, which tend to raise maximum temperatures and minimum ones on a daily basis. So it is more interesting to look at rural temperature data collection sites, which are less affected by this urban heat. That is what Dave Dixon has done below. Others have done similar work with a similar finding. Interestingly, if there are slightly higher night-time low temperatures, that is likely a cloud effect. As far as I can tell the biggest problem with climate models and the biggest uncertainty in climate science is what the effect on and of clouds is, when inputs to the system change. In any event, it is pretty clear from the charts below that there is no climate emergency if you define that as a substantial warming trend. In fact, there isn’t any warming at all.
 Dave’s notes:
- Kevin’s recent posts on climate, such as this one https://healthy-skeptic.com/
2022/04/06/long-term-and- recent-temperatures/, prompted me to share a little of data analysis I have dabbled with over the years. I have long been skeptical of the mainstream consensus on global warming, based on reading web sites for many years such as Steve McIntyre’s Climate Audit, https://climateaudit.org/. In my working years I didn’t always have a lot of spare time for climate analysis, and my retired years have been consumed by Covid analysis, but I have always monitored the temperature records at the weather station at St. John’s University in Collegeville, MN, the closest weather station to my home. This site is in rural Stearns County MN, and other the University itself, is surrounded by a mix of farmland, forests, and lakes, and almost no development of any kind. - The daily climate summaries for US weather stations can be downloaded from the National Oceanic and Atmospheric Administration web site, https://www.ncdc.noaa.gov/cdo-
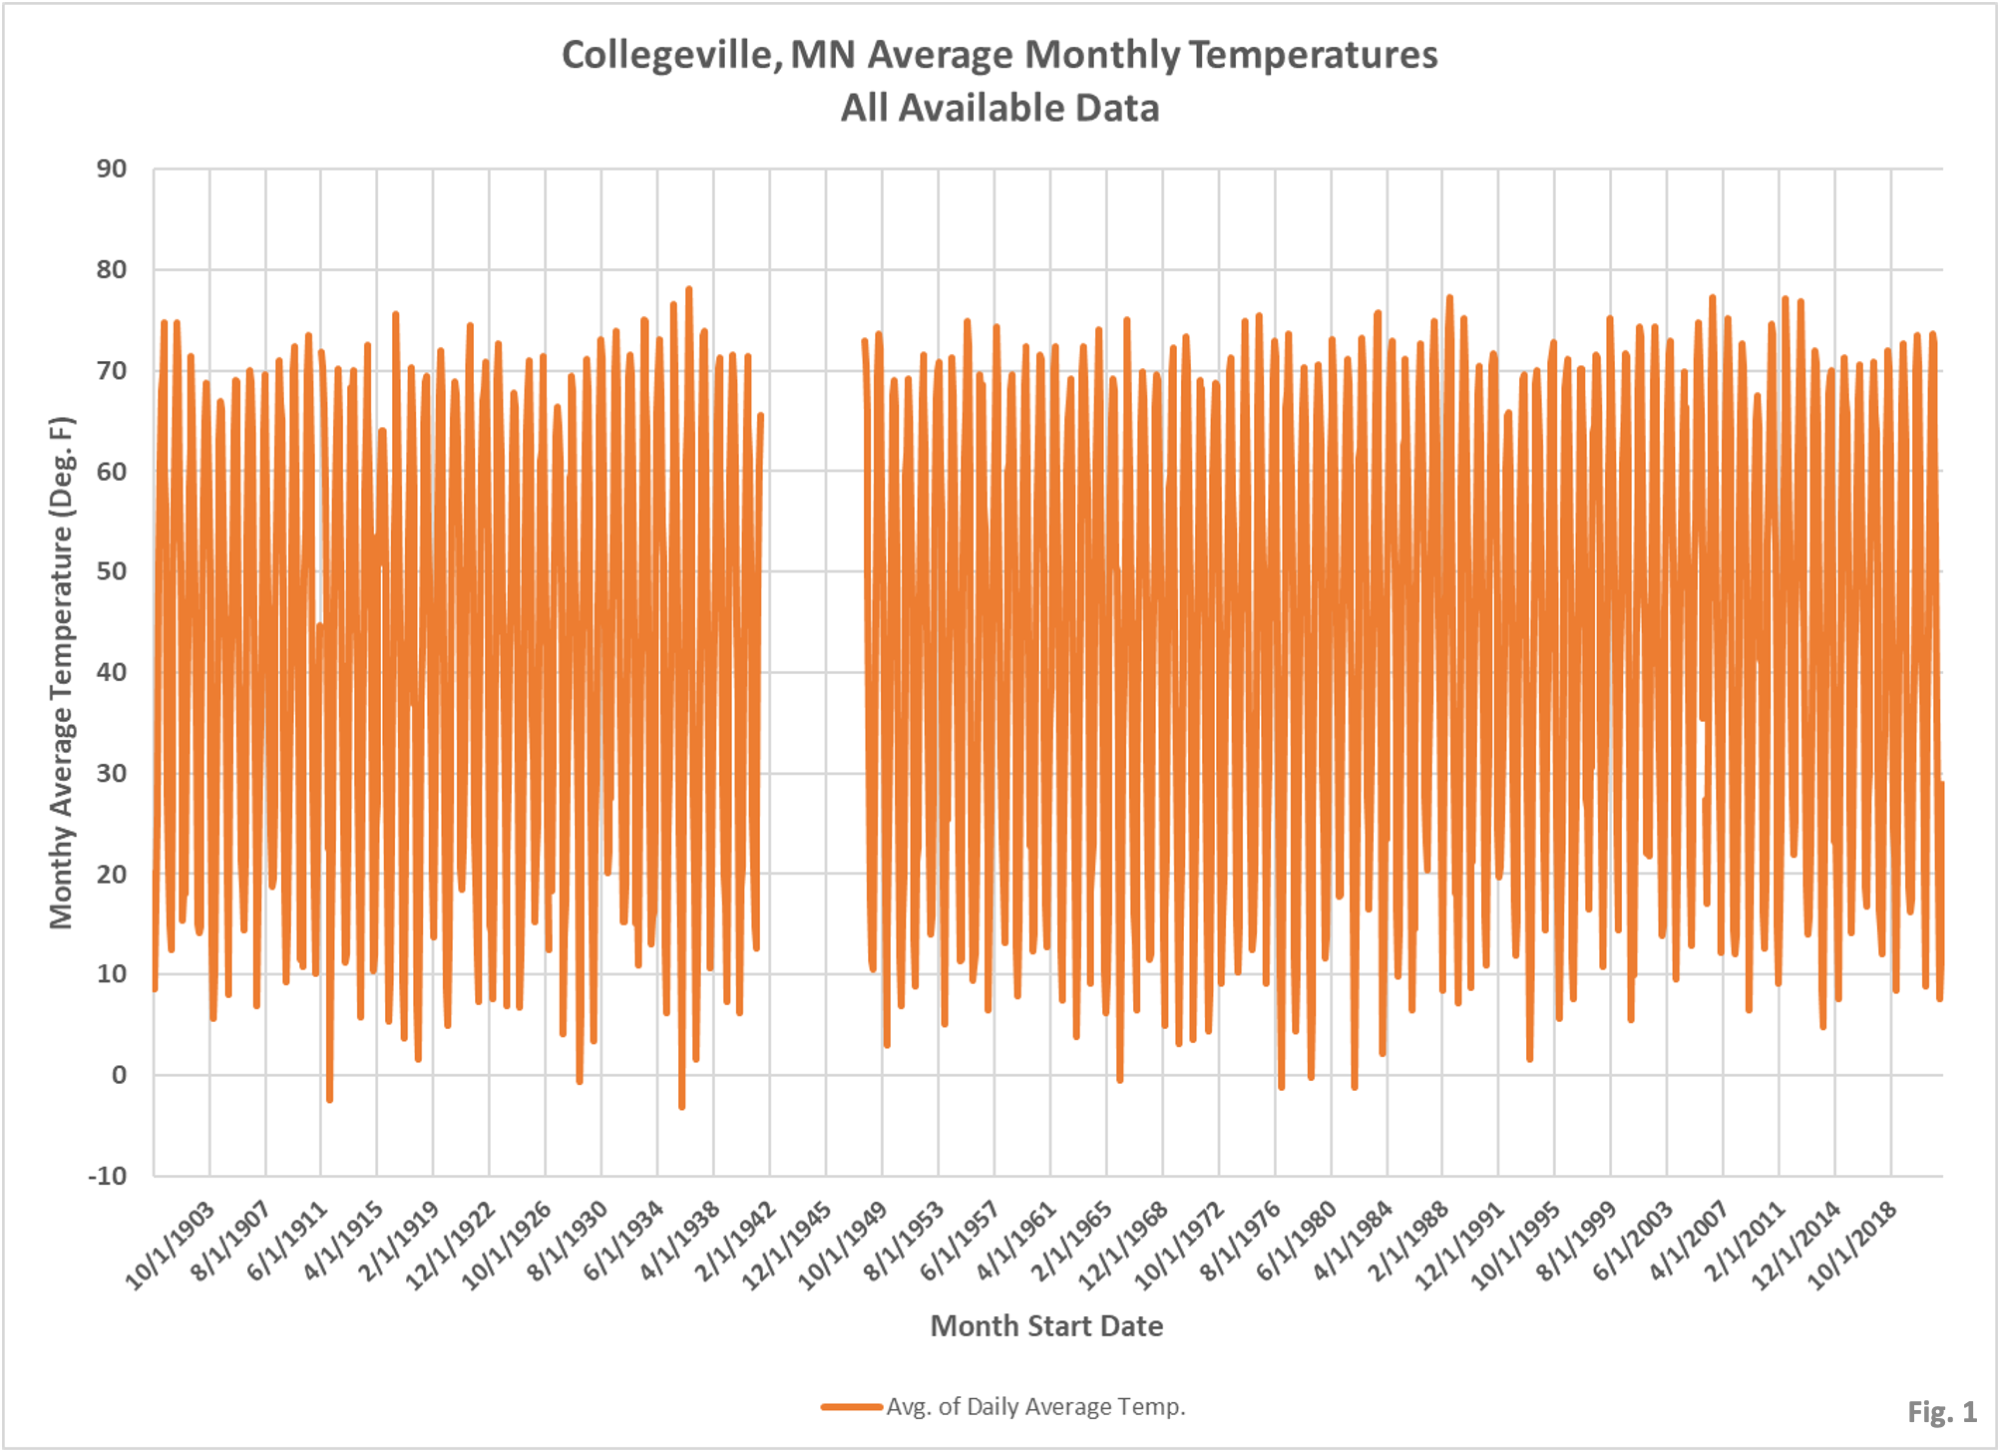
web/. Using the search tool, I download data every month for the Collegeville, MN station, ID No. USC00211691. This site of part of the Global Historical Climatology Network Daily (GHCND). A description of this network can be found here: https://www.ncei.noaa.gov/ products/land-based-station/ global-historical-climatology- network-daily. - After downloading the daily summaries, I calculate the average daily temperature by taking the average of the daily high and low temperatures. The daily average temperatures are then averaged over each month to get the monthly average temperature. Fig. 1 shows the monthly average temperature, for all of the available data. The gap in the data during WW2 is prominent, but it is not obvious that there is any meaningful trend. However, we can see that since January 1982 there are no extreme cold winter months with average temperatures below 0 F. For example, February of 1936 had 18 nights with low temperatures -10 F or colder.
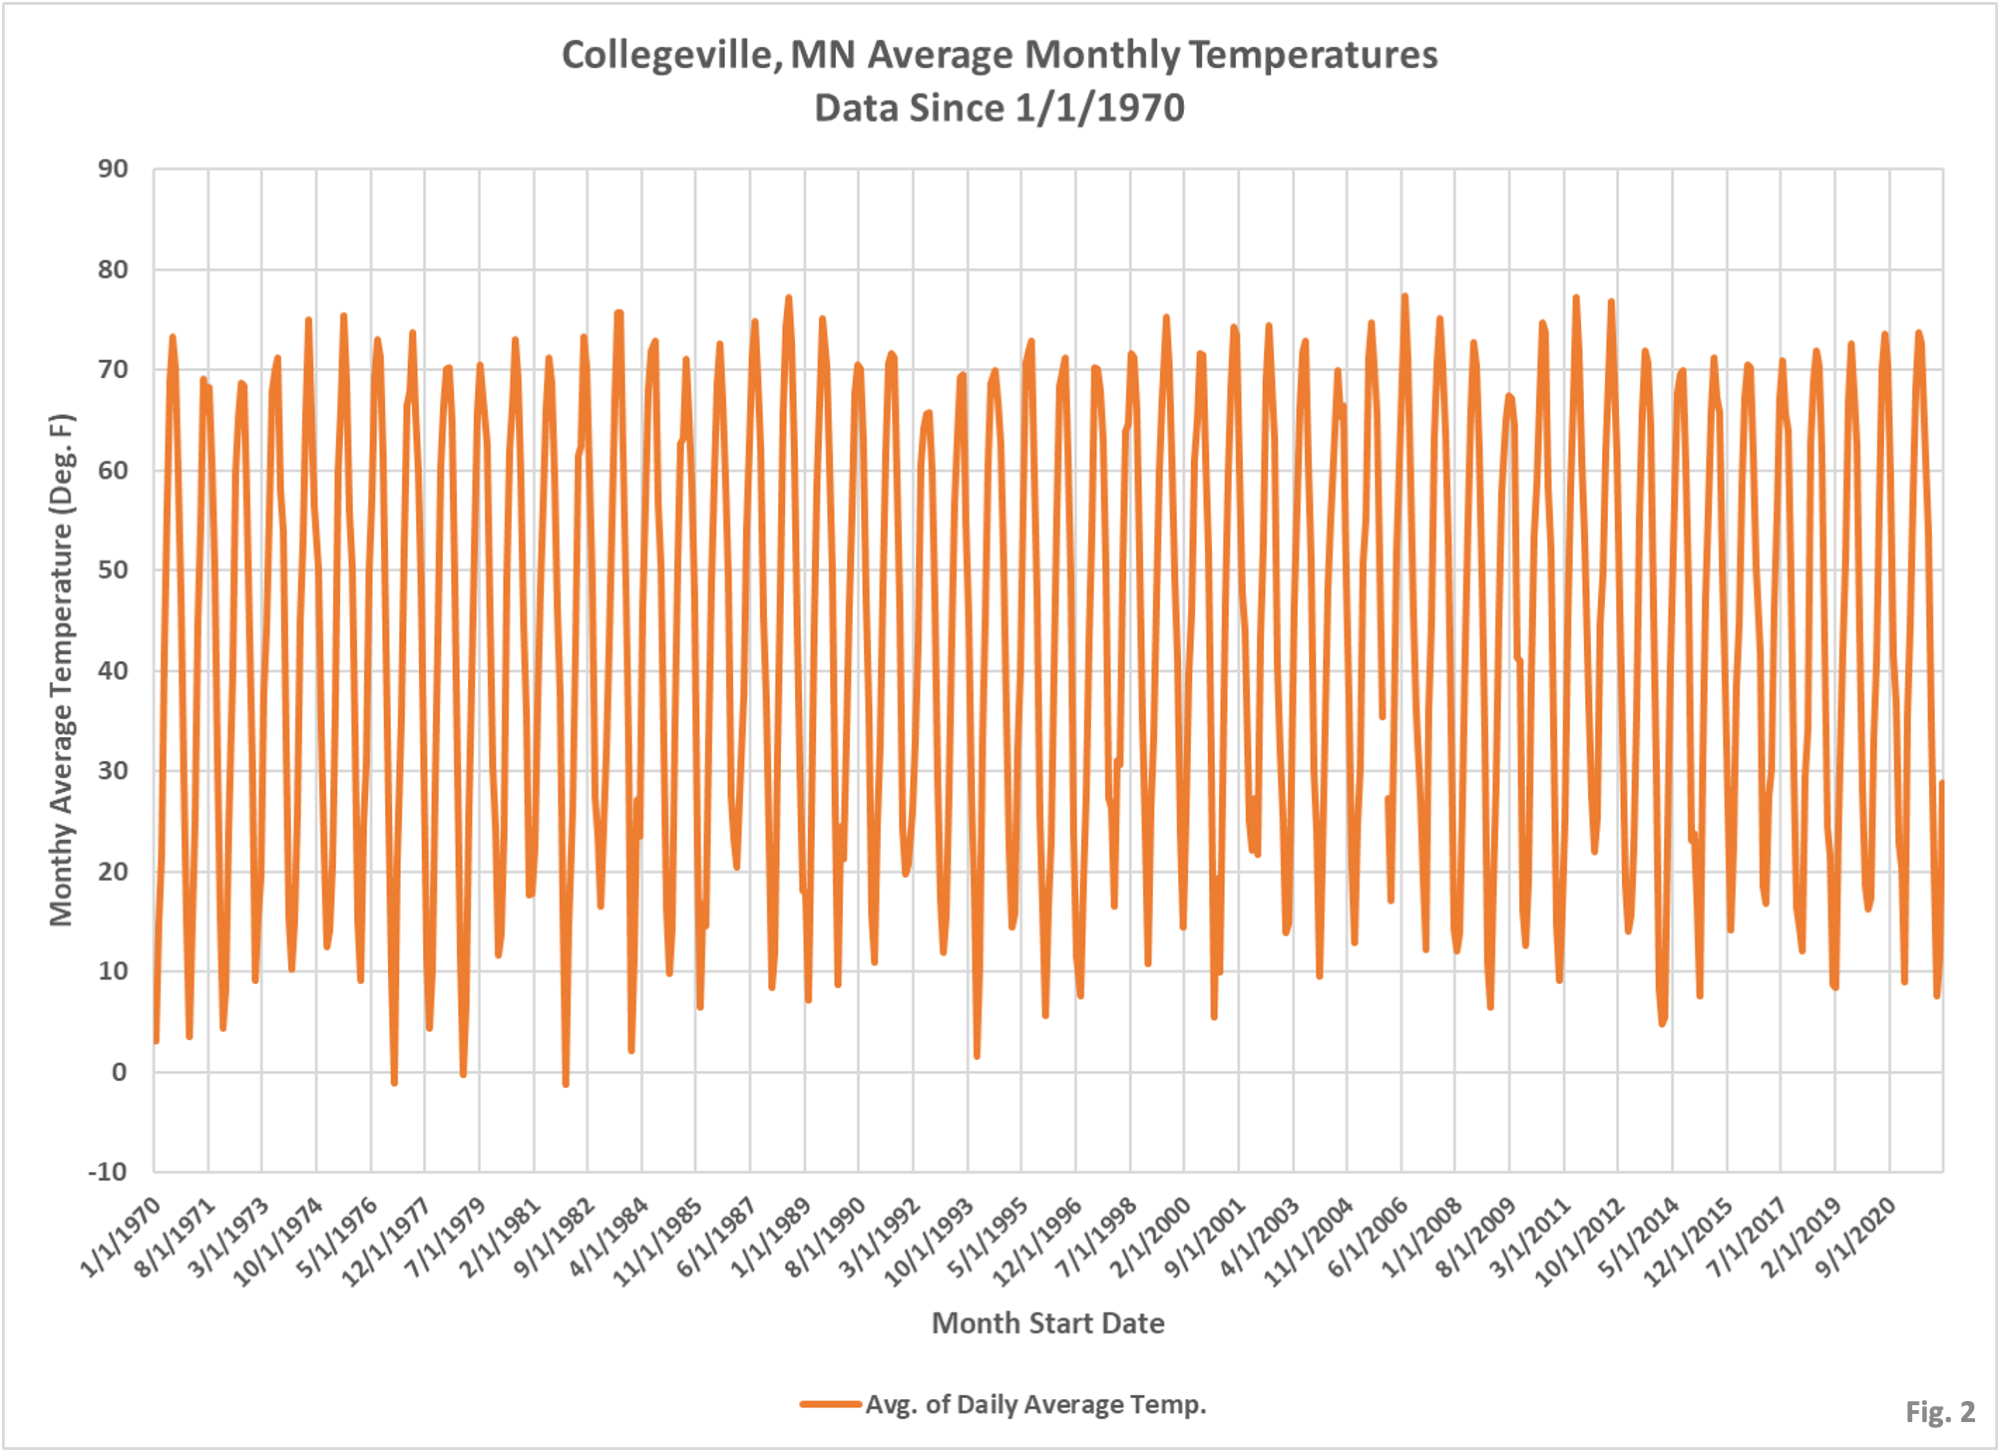
- Fig. 2 shows the same monthly average temperatures as Fig. 1, but is limited to data since January 1970. It is still not possible to visually detect a trend, except perhaps the absence of extreme cold winter months.
- The next step in the analysis is to calculate a ‘normal’ baseline temperature for each month, and then calculate the monthly anomaly, which is just the difference from each months’ average temperature compared to the baseline average temperature. Each months’ baseline is calculated using the 30 year period from January 1981 to December 2010. The purpose of the baseline is not to claim what normal temperatures are, but rather to just establish a baseline to allow us to evaluate the temperature trend over time.
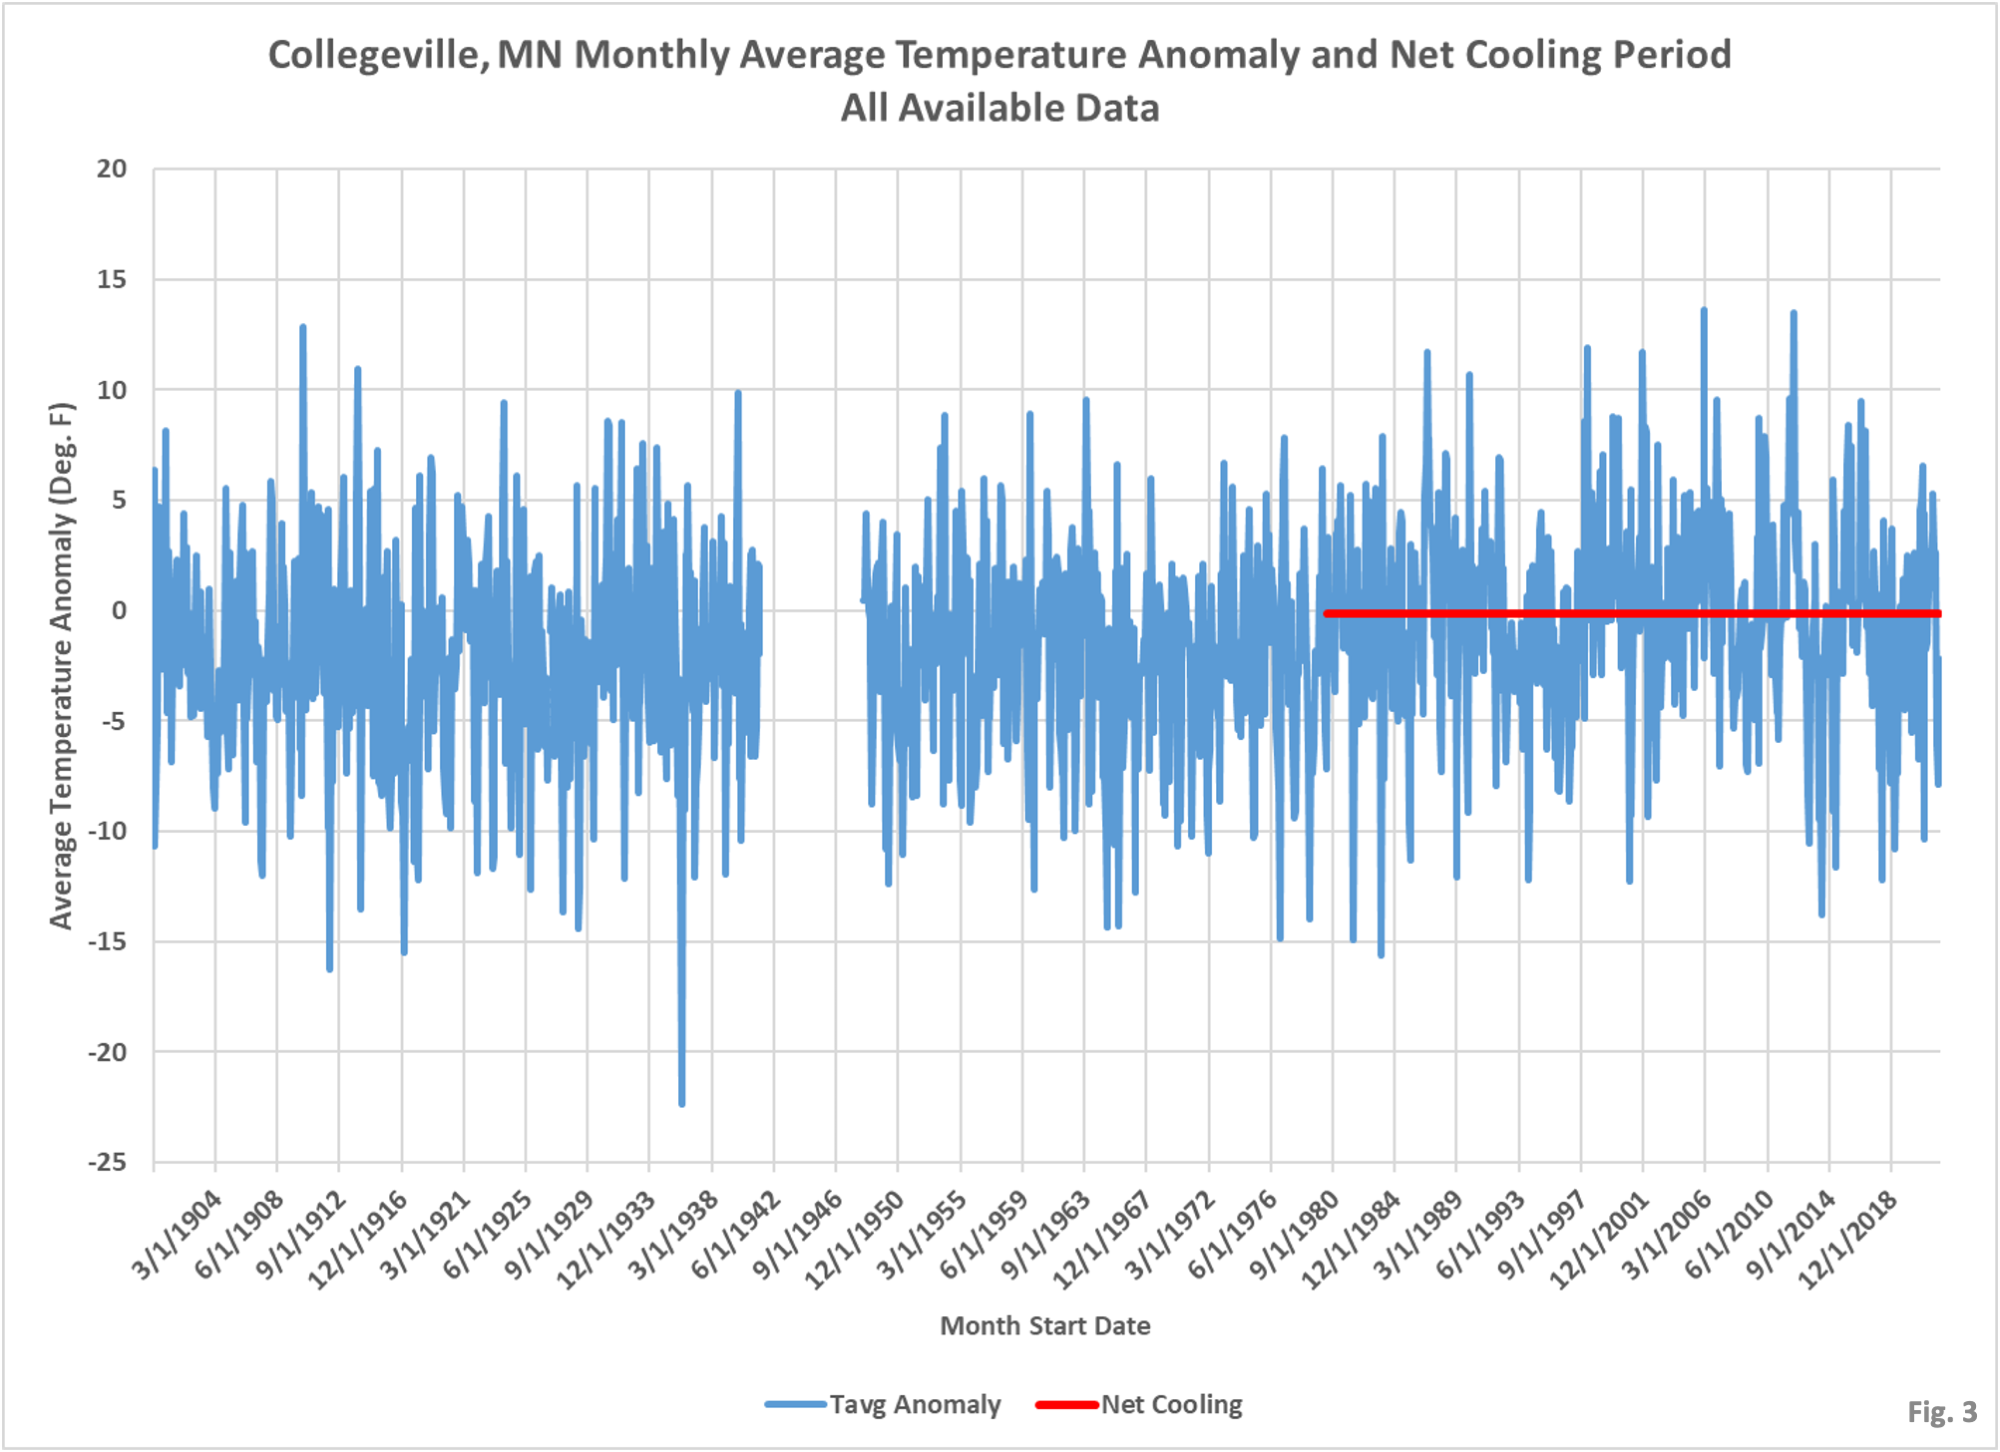
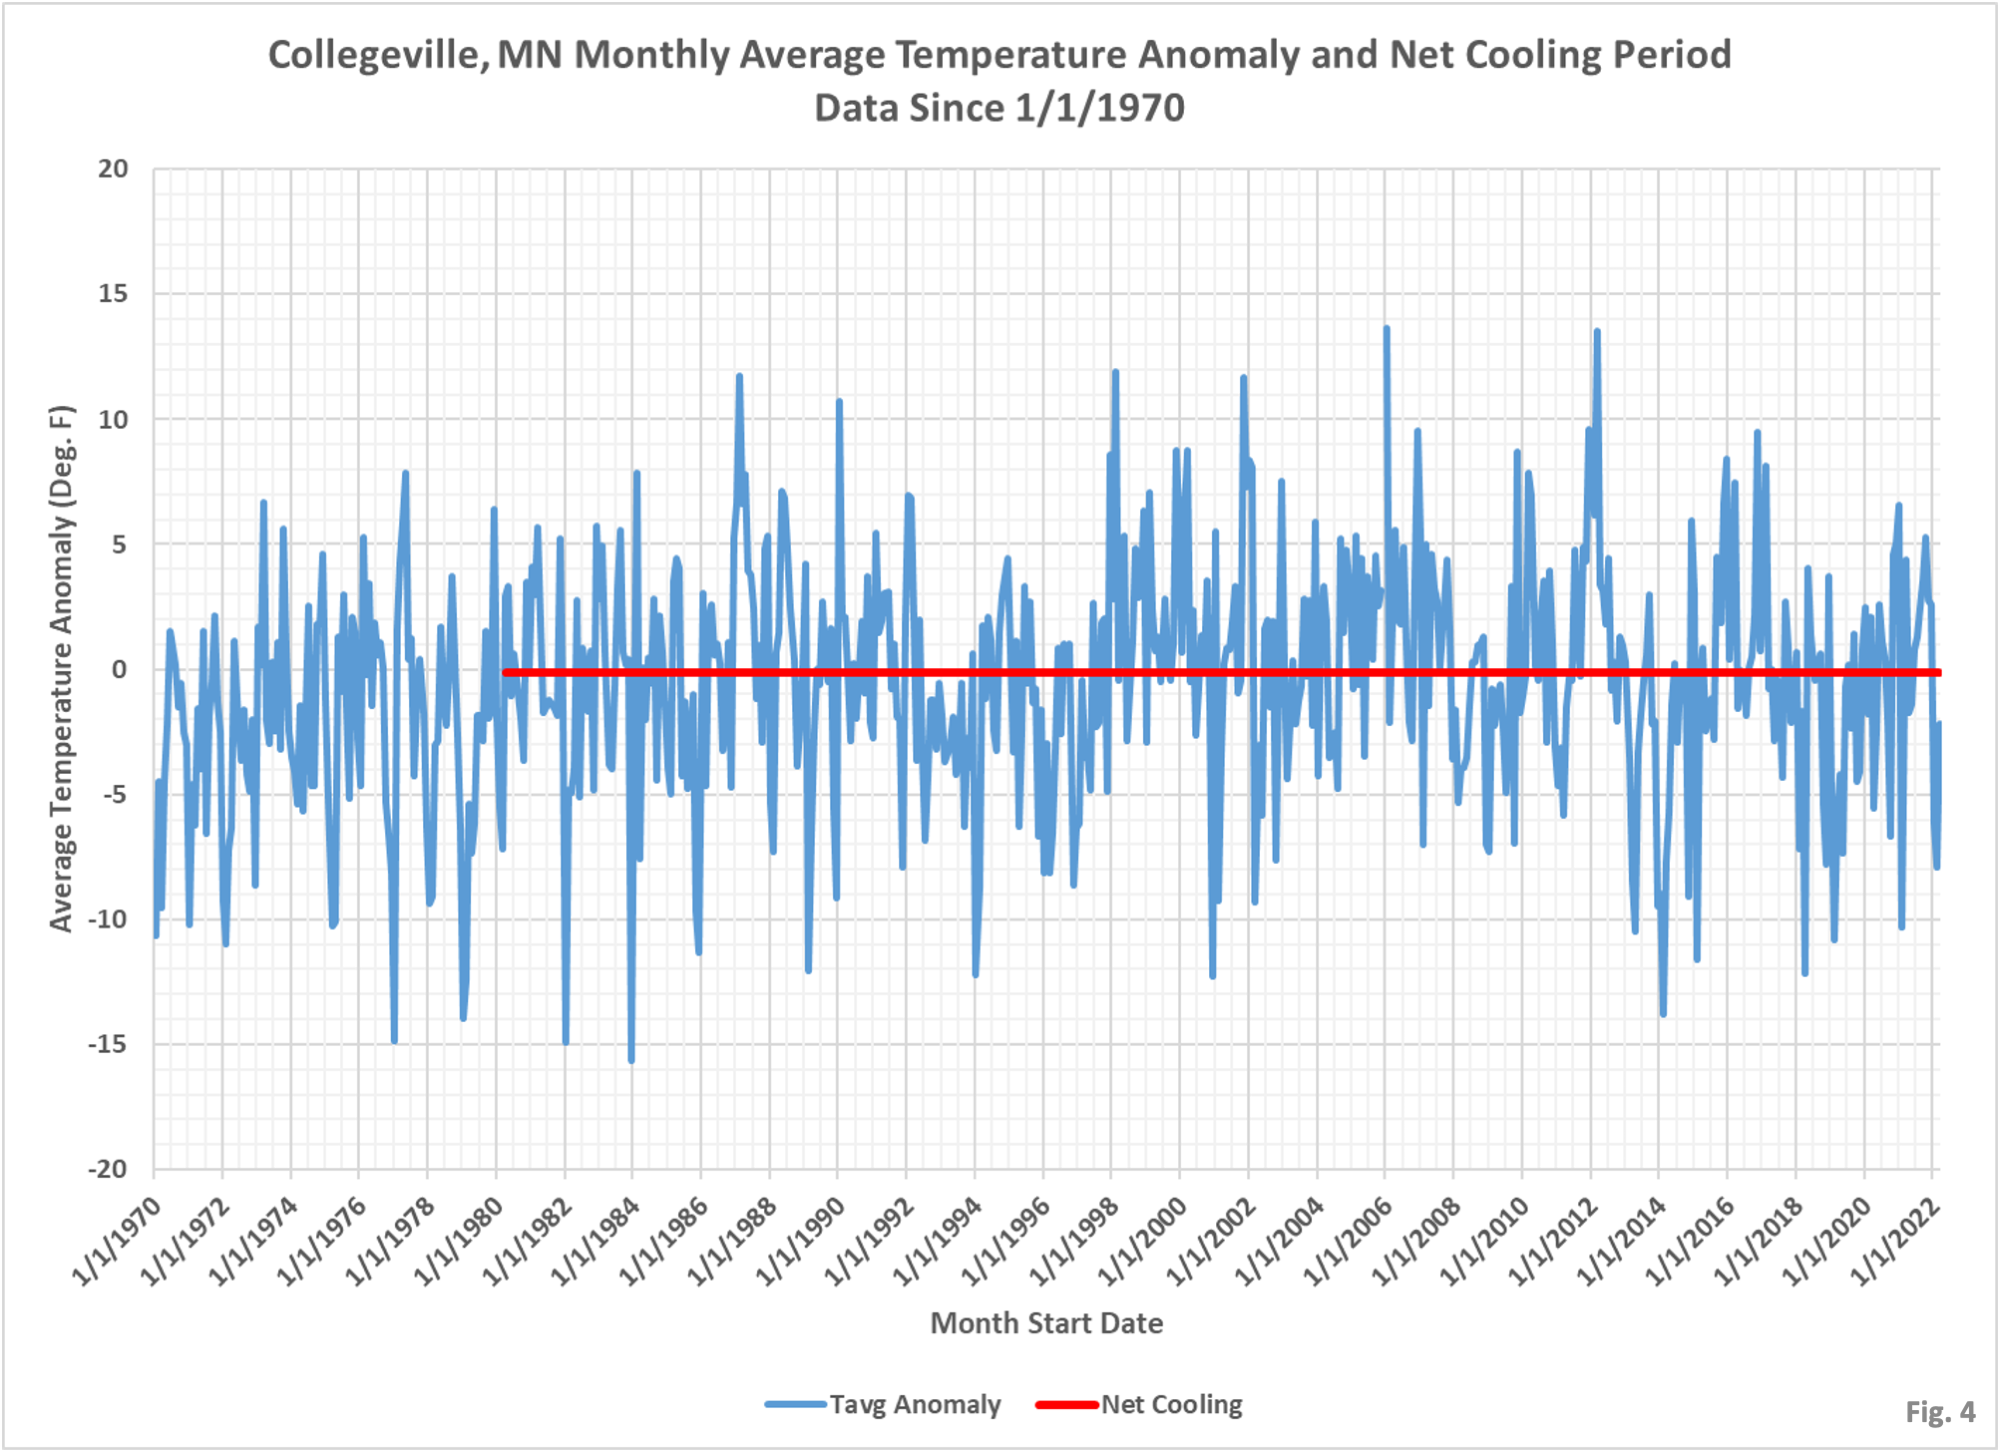
- Fig. 3 displays the monthly anomaly from baseline for each month for the entire dataset. February 1936 stands out as the largest negative anomaly. Looking at Fig. 1 we can see other instances where the monthly average temperature appears similar to Feb. 1936, however the other cold months took place in December or January, which have colder baseline temperatures than February, and therefore smaller anomalies. Fig. 4 shows the anomalies for the same time period as Fig. 2, since January 1970.
- The final feature on Fig. 3 and 4, and really the entire point of this exercise, is the horizontal red line labelled “Net Cooling”. Starting from the March 2022, I calculate a linear regression going back to each month. If the linear regression has a negative slope that means that over the time period analyzed that there has been a cooling trend, and a positive slope means there has been a warming trend. As of March 2022 there is a net cooling trend since April 1980. Basically, we can say that for one weather station in rural Stearns County, MN there has been no measurable warming for 42 years. Going back further in time there is indeed a positive trend, meaning that the years prior to 1982 were colder than after 1982.
- This is obviously the most simplistic analysis possible, but it does help illustrate whether or not measurable warming is occurring. After all, if global warming is increasing at such a rate that it is an existential threat to humanity, surely we would see signs of it at individual weather stations? Not in the last 42 years in Collegeville, MN, apparently.

How Dare You?!!! No, really, I can believe it’s all nonsense but I just can’t spend my time investigating climate change so I’m not going to worry about it one way or the other. But how about those flying saucers that were a hot topic a few months ago… do you have any thoughts on those? I’m hoping they’re people from the future here to protect us from ourselves. I don’t know what to believe anymore. I’m of the mindset that absolutely anything could be true.
It’s all fun and games until the lives of nearly 8 Billion people are crushed by the false narrative of ‘Climate Change”. Why would anyone expect a planet whizzing through space with hundreds of other variables NOT to have a continuously changing climate? What’s much more fascinating is how nut jobs are continually able to pull off such global hoaxes that swallow seemingly sensible people. It really just validates that most humans are mentally limited and easily manipulated by societal hyenas.
Scientifically, humans are homo sapiens. In actuality a significant percentage are “homo emotionalis” and rarely function in the cognitive domain.
I’ve long been extremely skeptical of the “global warming”/”climate change” agenda. Unfortunately, every mind under the age of 45 that went through the public school or university system has been programmed to believe that it’s a crisis. While it’s in everybody’s best interest to have a cleaner environment, basically all of the solutions that the left has come up with do absolutely nothing to clean the environment and make the necessities in life a lot more expensive for those who can least afford it. Things like “carbon offsets” have always been a scam, but now we’re hearing about items like “carbon capture” which will be extremely expensive and could actually damage the environment going forward.
Ask anyone who works outdoors everyday of their life and you may find a differing opinion from the average indoor personnel. I would call what has accelerated in the last 20 years as “climate shift”. Longer, warmer falls, cooler, wetter springs. I can believe overall yearly temperature averages have changed little. But raking leaves in December is a strange expectation as of late. I expect climate shift to naturally take place over long periods of time, My personal opinion, the seasons have shifted >30 days in 20 years. I do consider the speed of climate shift extreme relative to a human’s lifetime. The cause relating to nature cycles vs man made problems can be debated and yet the only way to end the debate is to eliminate the variable. That is too extreme for my tastes but I suspect others believe deleting human variables is the answer. Be careful when choosing sides of this debate, you may eliminate yourself.
So you couldn’t find some tree rings to fill in the gap during the WWII years? No proxy results? Maybe the quality of raccoon pelts? Thanks for doing all this.