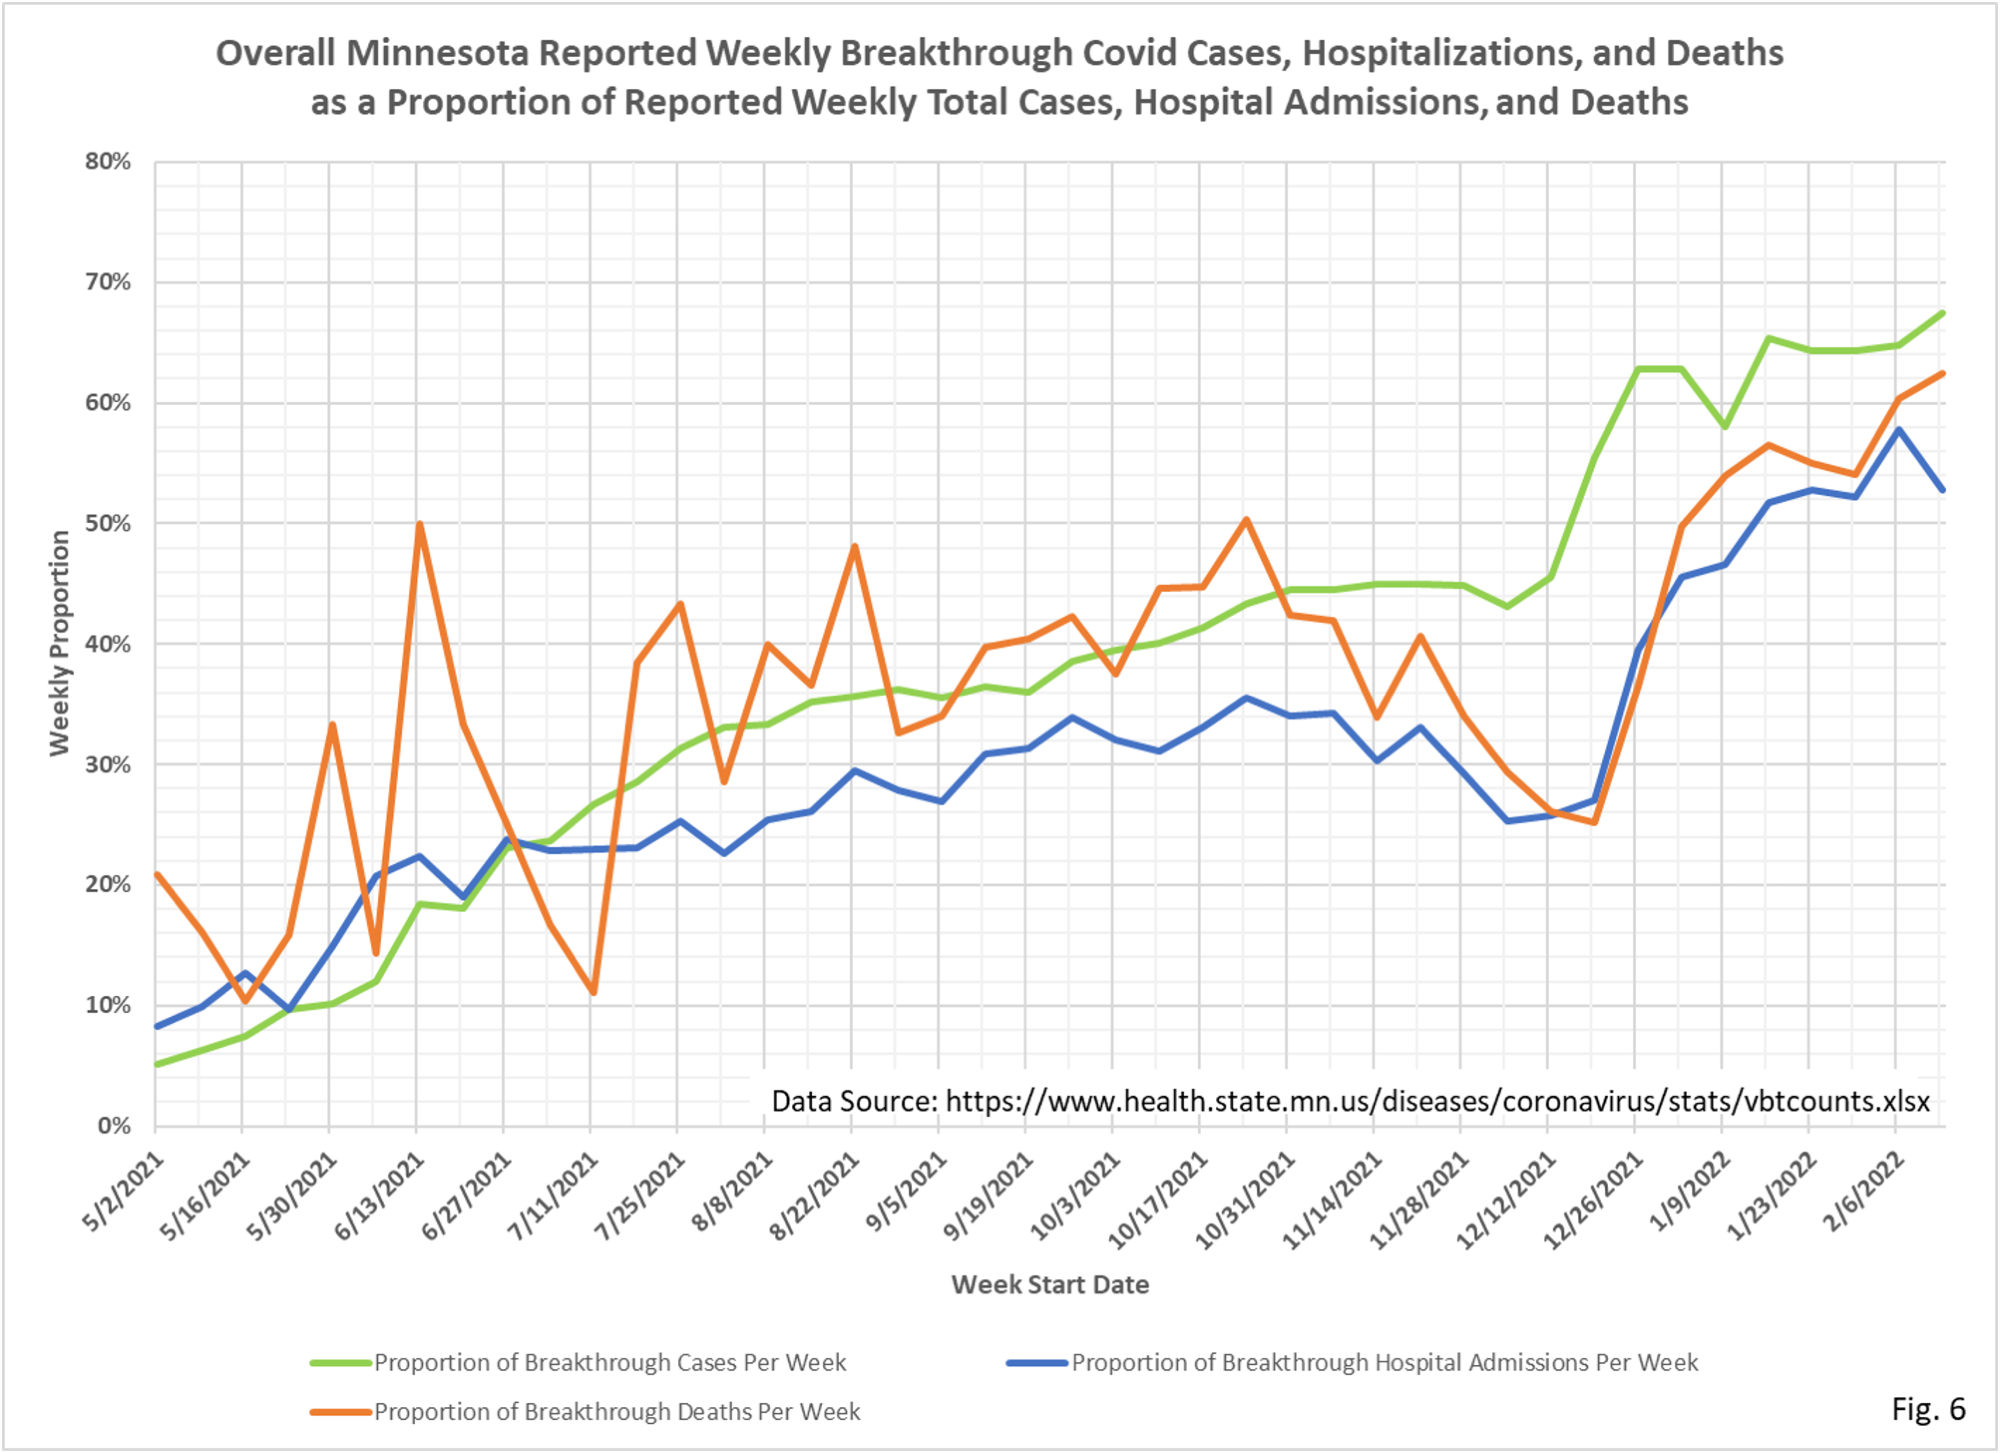
Dave is splitting this work into two posts, based on some additional data and analysis he has received. This is the first part, which has most of the old stuff. Once again, remember this data is very lagged, and we strongly suspect DOH processing delays. As of last week reported, in the middle of February, over half of all events are in the vaxed. That almost certainly is an undercount. Dave’s notes are now at the end of these tables and charts, so you get the visual impact right away.
Dave’s notes:
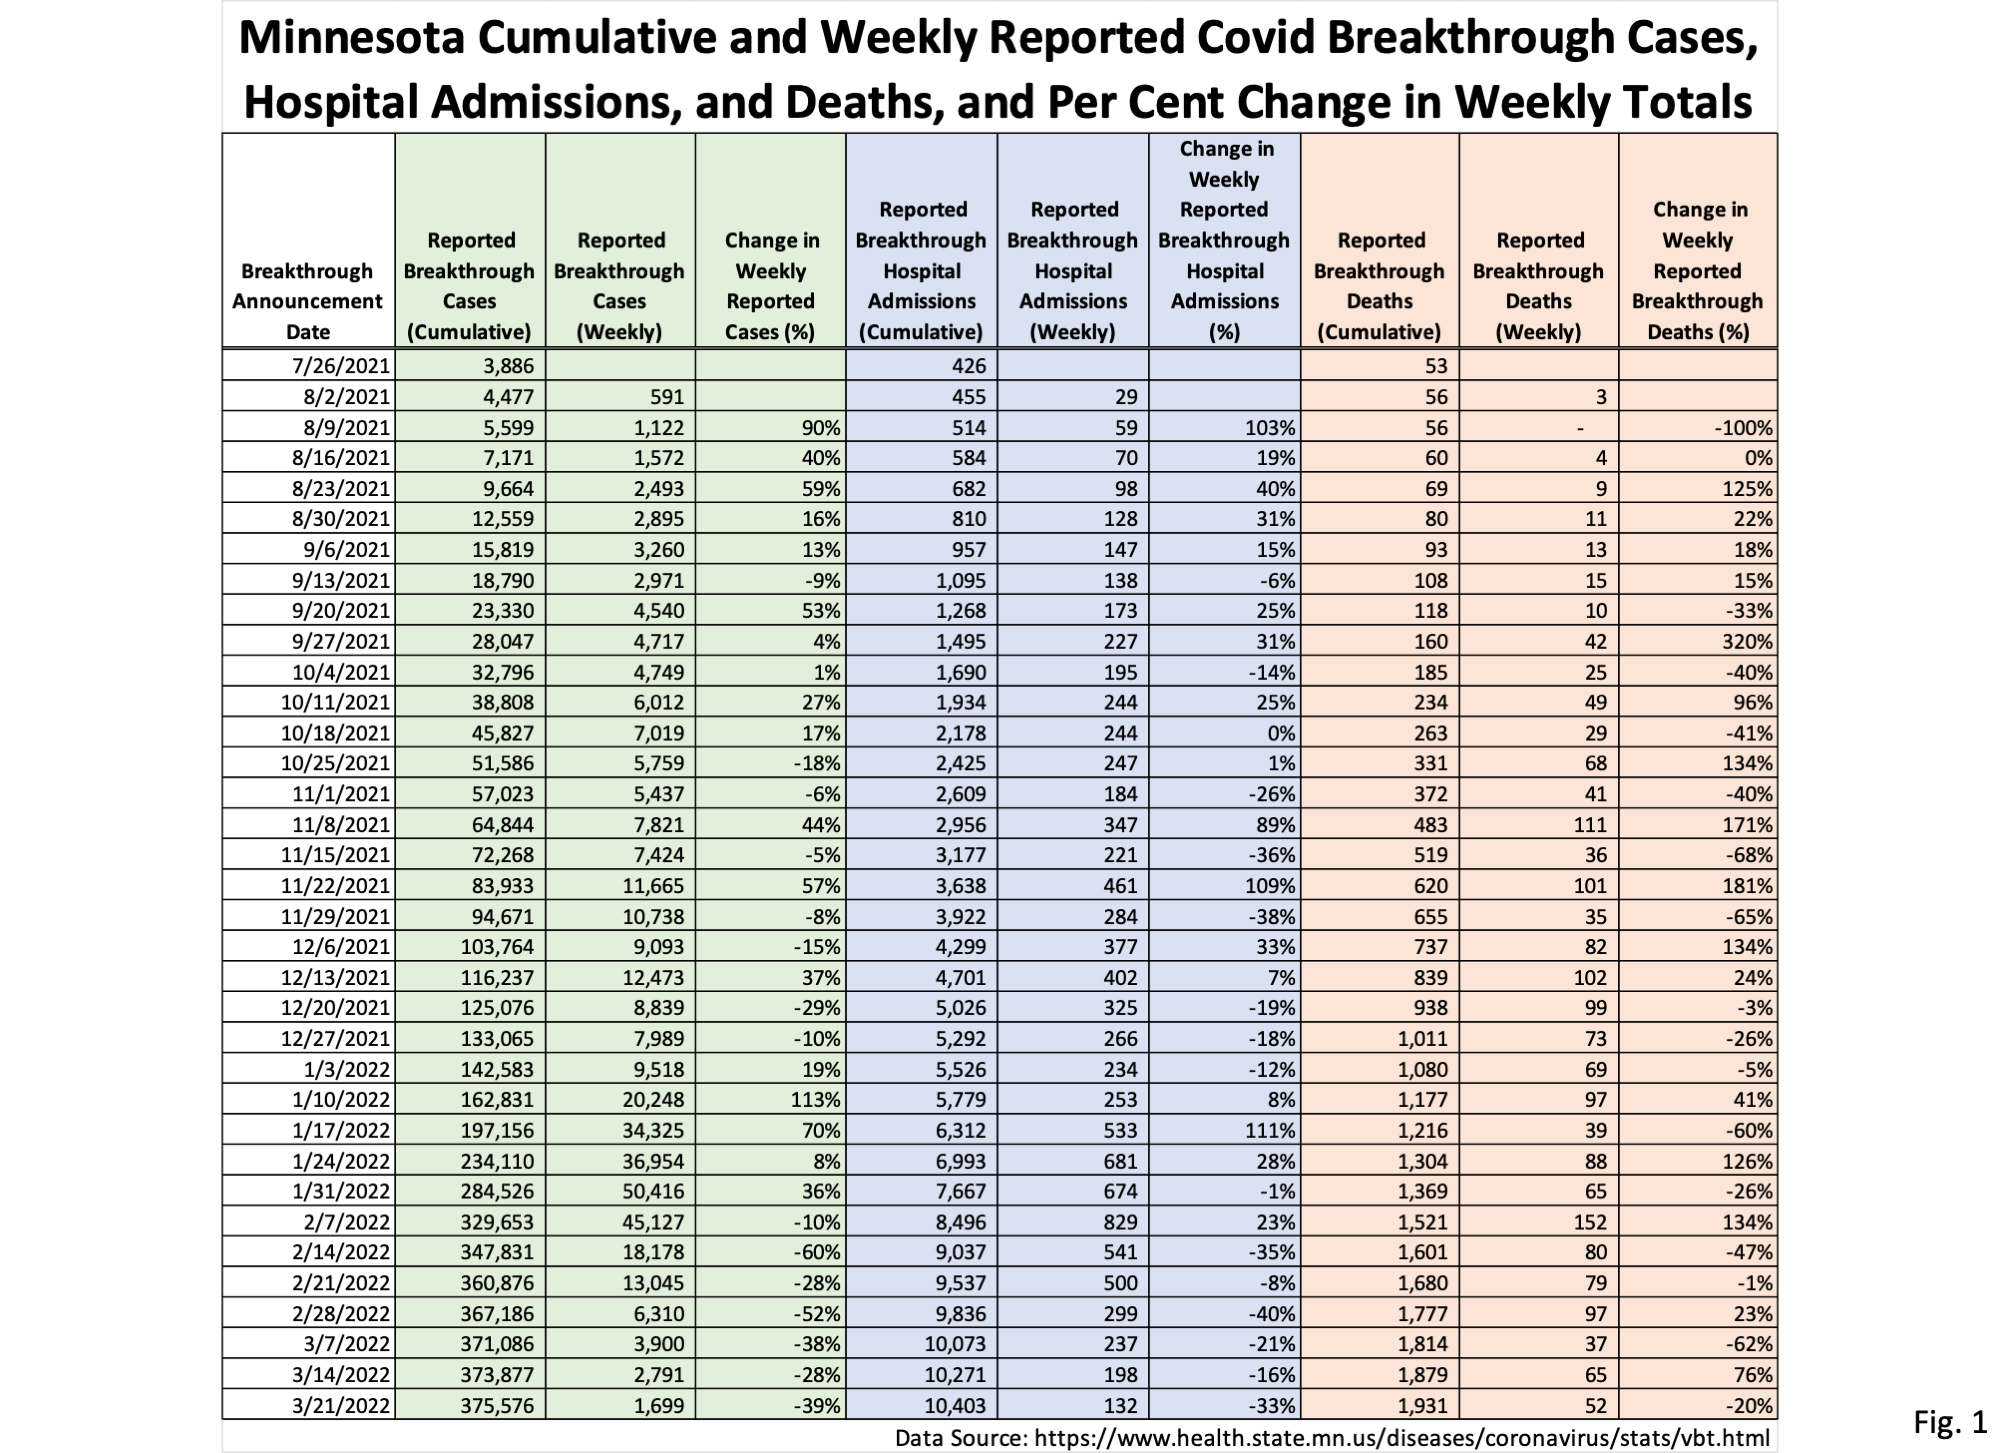
- Fig. 1: This table is the weekly announced cumulative breakthrough cases, hospital admissions, and deaths, as well as the weekly totals, and change in weekly totals, as published on the Vaccine Breakthrough Update web page https://www.health.state.mn.us/diseases/coronavirus/stats/vbt.html. New breakthrough cases announced on 3/21/2022 total just 1,699 cases.
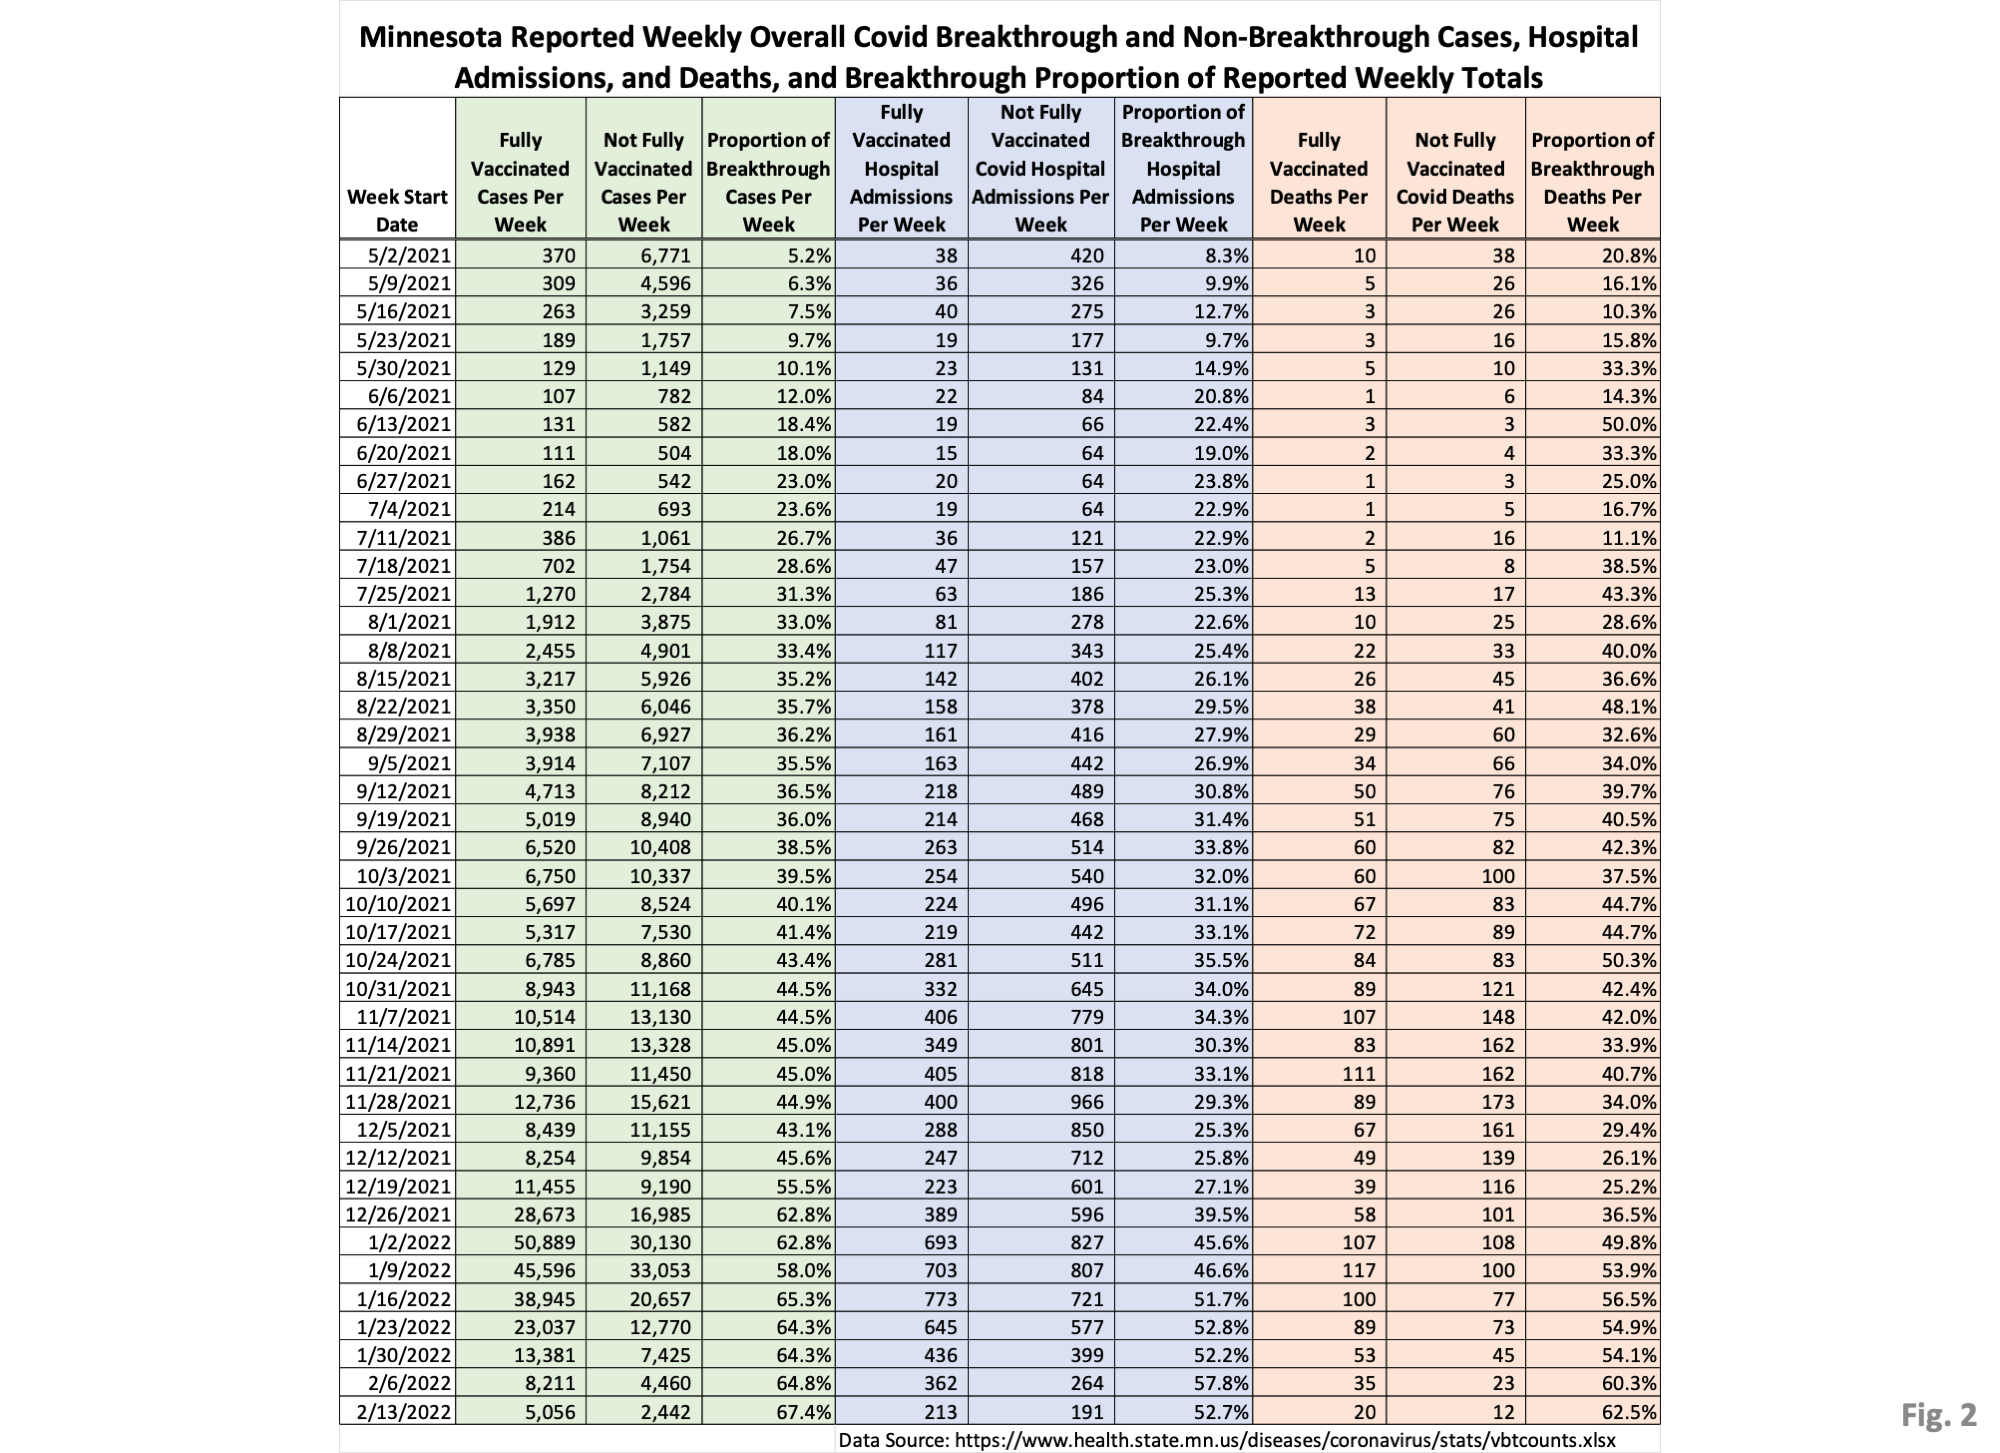
- Fig. 2: This table displays the total breakthrough cases, hospital admissions, and deaths that occured each week among the vaccinated and unvaccinated. These numbers are taken from the vbtcounts.xlsx data file published by MDH on the Vaccine Breakthrough Update web page. We note that we are working through an apparent Minnesota Department of Health data error. We obtained a refreshed detailed breakthrough case list from MDH on 3/17/2022, through a Minnesota Government Data Practices Act request, which lists more breakthrough cases than appear in the data file used to construct Fig. 2. For example, MDH reports 50,889 breakthrough cases for the week of 1/02/2022, while the Data Practices Act data file contains 52,316 breakthrough cases. All of the discrepancies occur during the Omicron surge in early 2022. We have asked MDH for a comment on this issue and have yet to receive a reply.
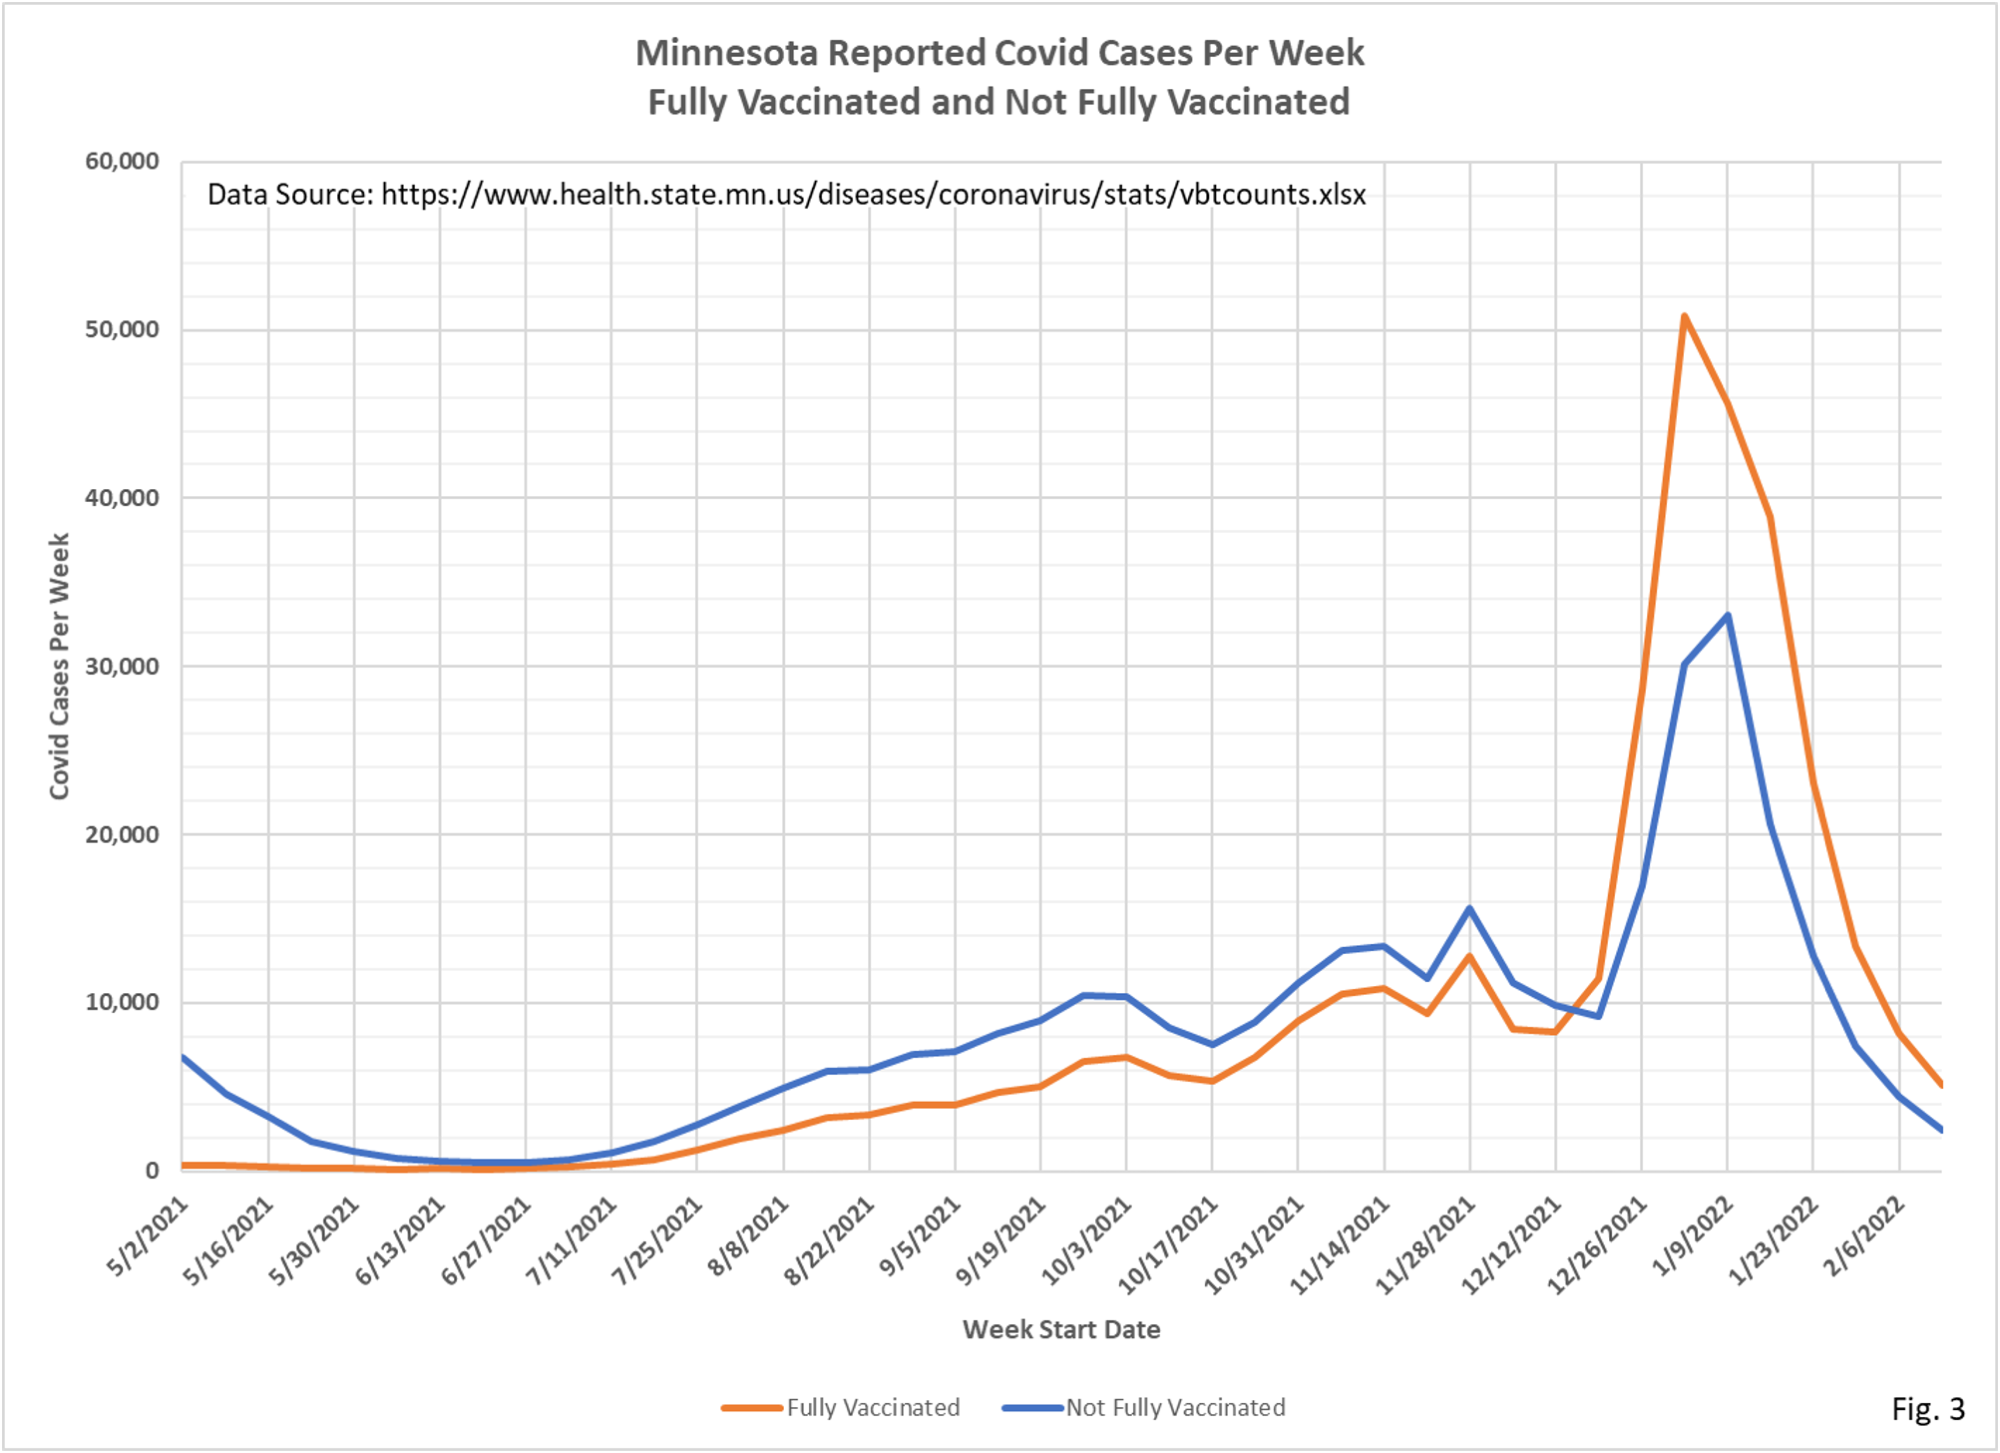
- Fig. 3: This chart is new this week, and simply plots the cases among the vaccinated and unvaccinated populations each week, as found in Fig. 2. Note that starting the week of 12/19/2021 cases are higher each week among the vaccinated. Note also that cases among the vaccinated appear to peak the week of 1/02/2022, and cases among the unvaccinated appear to peak a week later. It is not known if this is due to an actual epidemiological effect, or is an MDH reporting artifact.
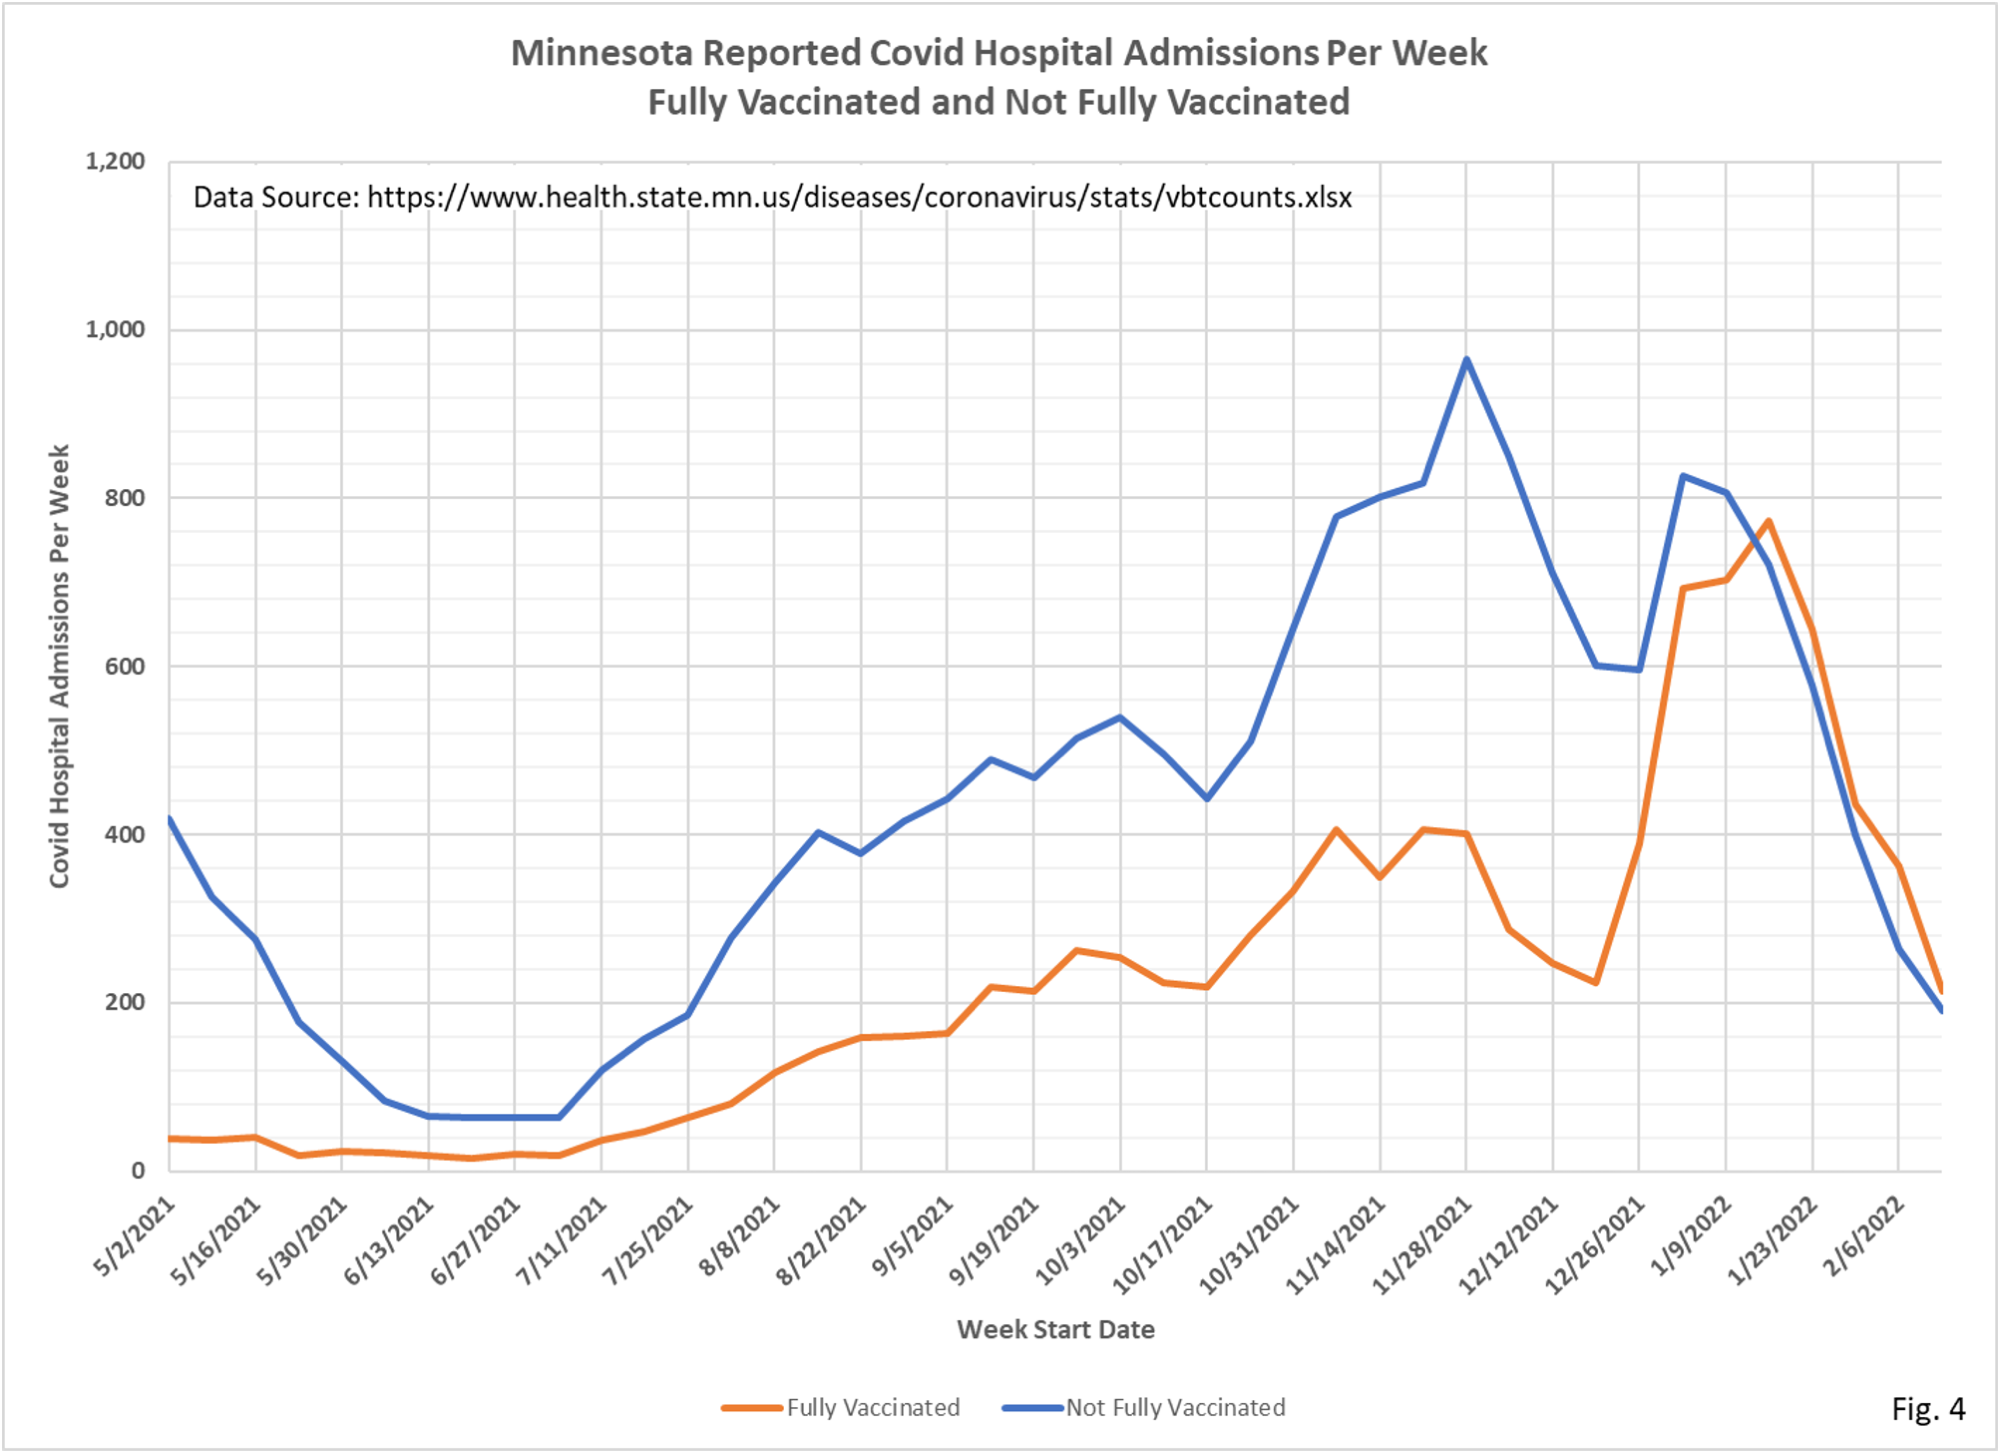
- Fig. 4: This chart is also new this week, and displays the hospital admissions among the vaccinated and unvaccinated populations each week from the data in Fig. 2. The drop we see in both vaccinated and unvaccinated admissions in late 2021 is consistent with the overall drop in admissions we see in other MDH web pages. For example, in our last post on year over data comparisons, https://healthy-skeptic.com/2022/03/21/year-over-year-charts-march-18/, we can see a comparable dip in Non-ICU admissions in Fig. 5.
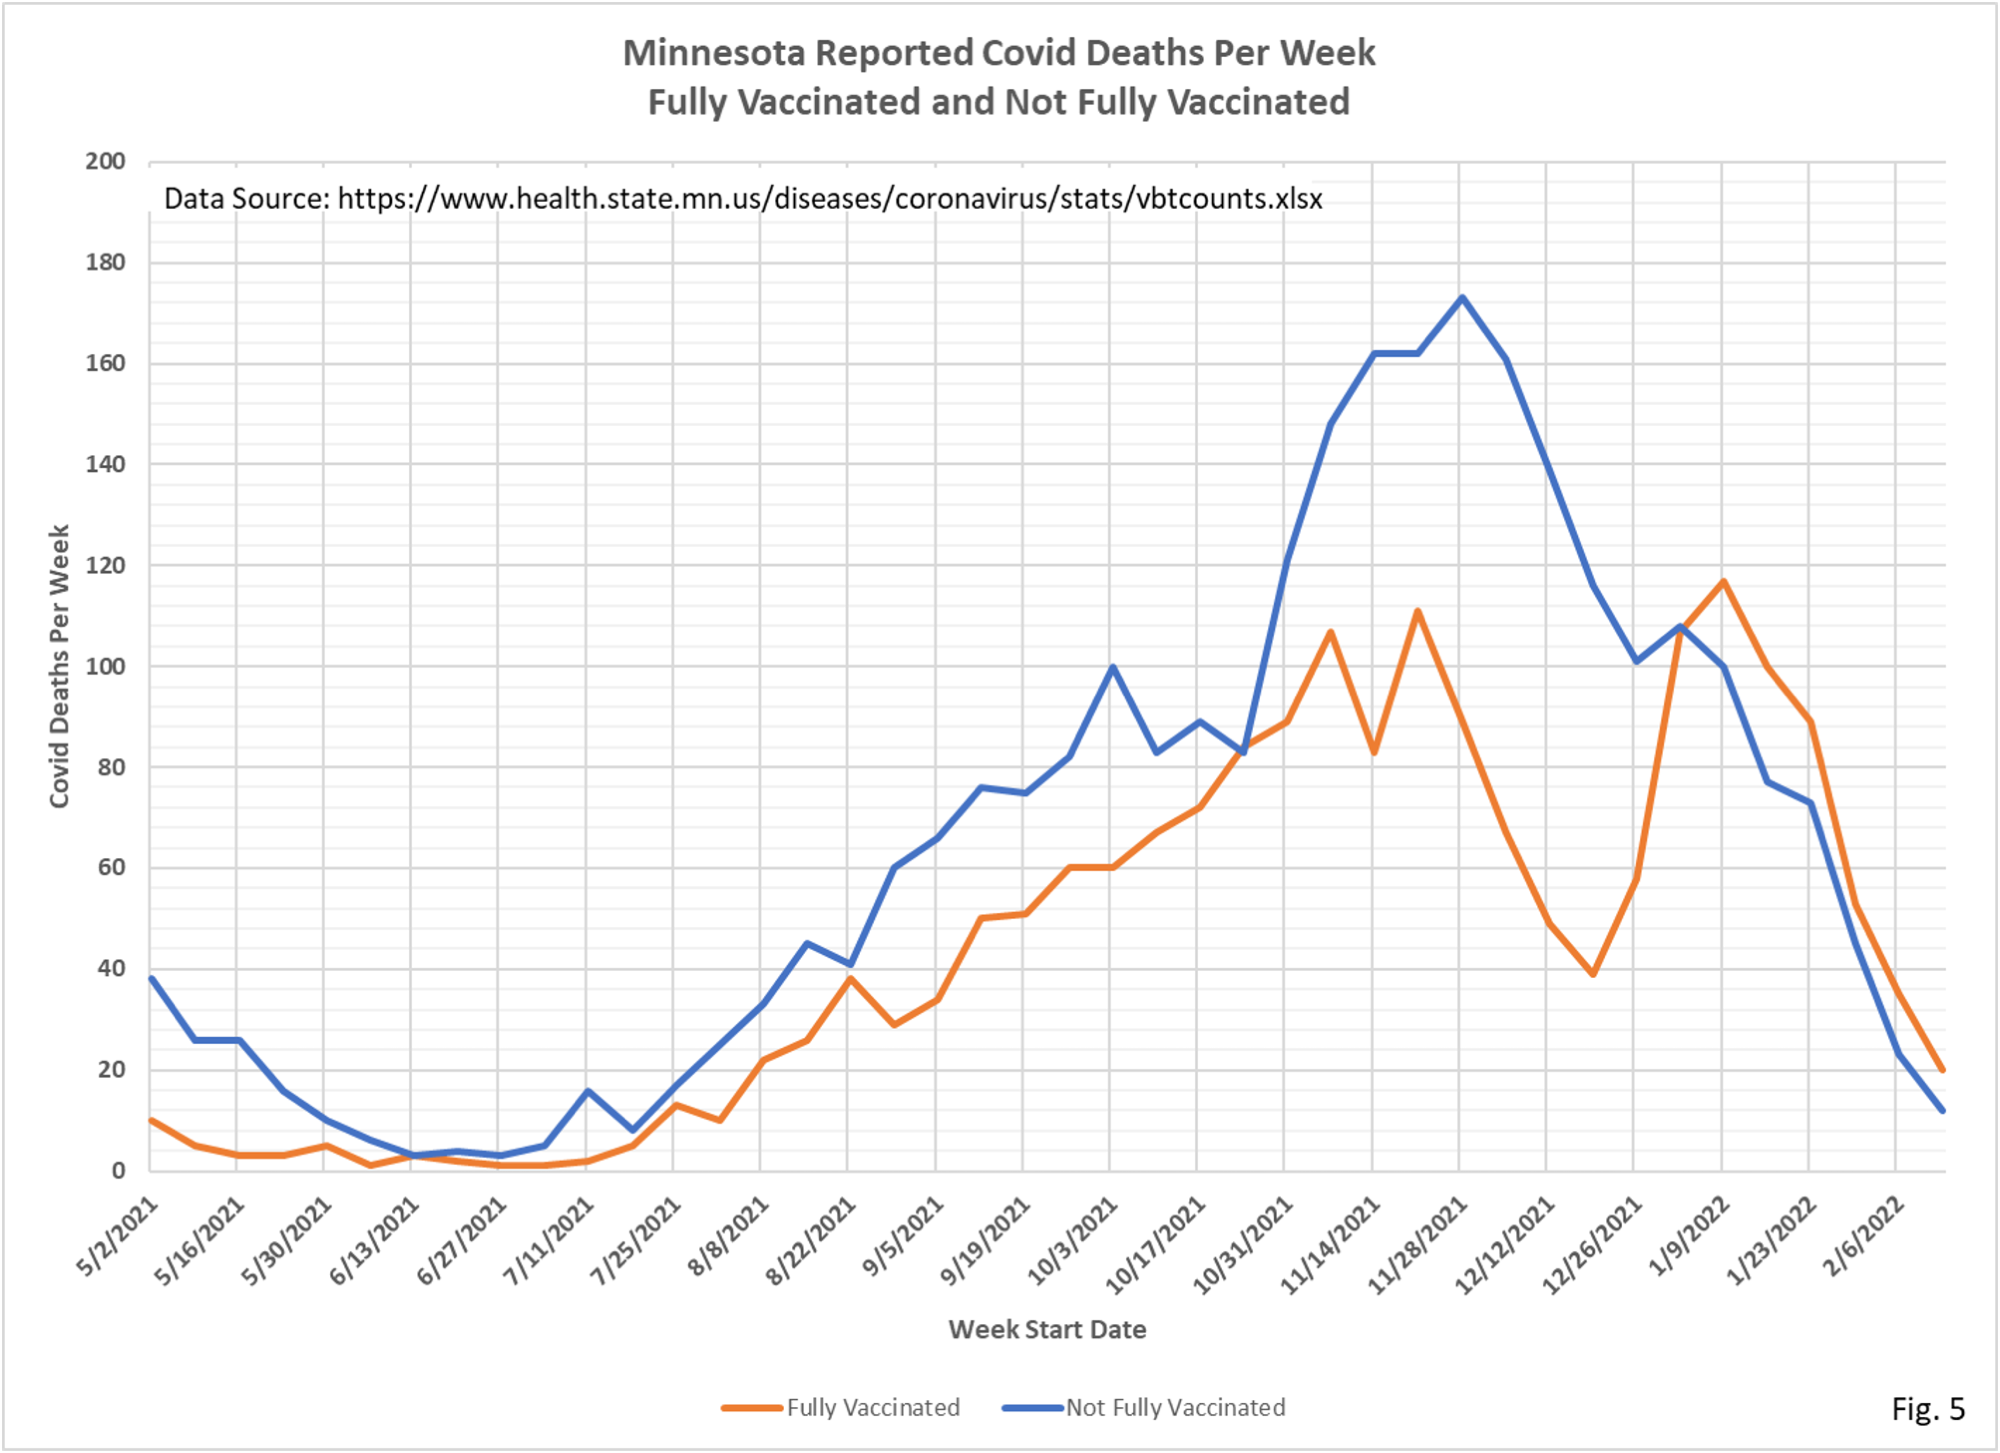
- Fig. 5: This is our last new chart for the week showing the vaccinated and unvaccinated deaths each week from the data in Fig. 2. Note that the deaths each week are roughly equal until November 2021, when unvaccinated deaths continue increasing while vaccinated deaths drop sharply. In early 2022 the deaths per week converge again. We don’t know if the divergence in late 2021 is a real epidemiological effect, or incomplete reporting from MDH during the Omicron surge in cases.
- The table and charts are updated for new data released by Minnesota Department of Health (MDH) on 3/14/2022, adding data for the week starting 2/06/2022 and ending 2/12/2022.
- The data source for the data on Fig. 1 is the cumulative breakthrough cases, hospitalizations, and deaths published on the MDH COVID-19 Vaccine Breakthrough Weekly Update https://www.health.state.mn.us/diseases/coronavirus/stats/vbt.html
- The data source for Fig. 2 is the data file https://www.health.state.mn.us/diseases/coronavirus/stats/vbtcounts.xlsx found on MDH web page https://www.health.state.mn.us/diseases/coronavirus/stats/vbt.html. The data provided in the data file vbtcounts.xlsx is used without modification, other than to sum the weekly events and compute the breakthrough proportion. Vbtcounts.xlsx provides breakthrough and non-breakthrough cases, hospital admissions, and deaths for each week listed.
- The charts in Fig. 3 through Fig. 6 are plots of the data in Fig. 2.
- MDH defines a breakthrough event as a Covid case, hospital admission, or death that occurs 14 or more days after completing the vaccination series (not including boosters.
