An updated Year-Over-Year look. As you see, last year at this time we had a case bump, no sign of that yet this year. Another interesting thing to note is the comparison of tests to cases in the two big waves. I think the higher “positivity” rate is purely a reflection of the extent of home testing during the Omicron wave, with people being positive but having mild cases and never getting a reported test. The hospitalization pattern I believe reflects an increasing number of incidental hosps, driven by very mild Omicron cases in people hosped for other reasons. Hospitals have every incentive to call everything they can a CV-19 case.
 Dave’s notes:
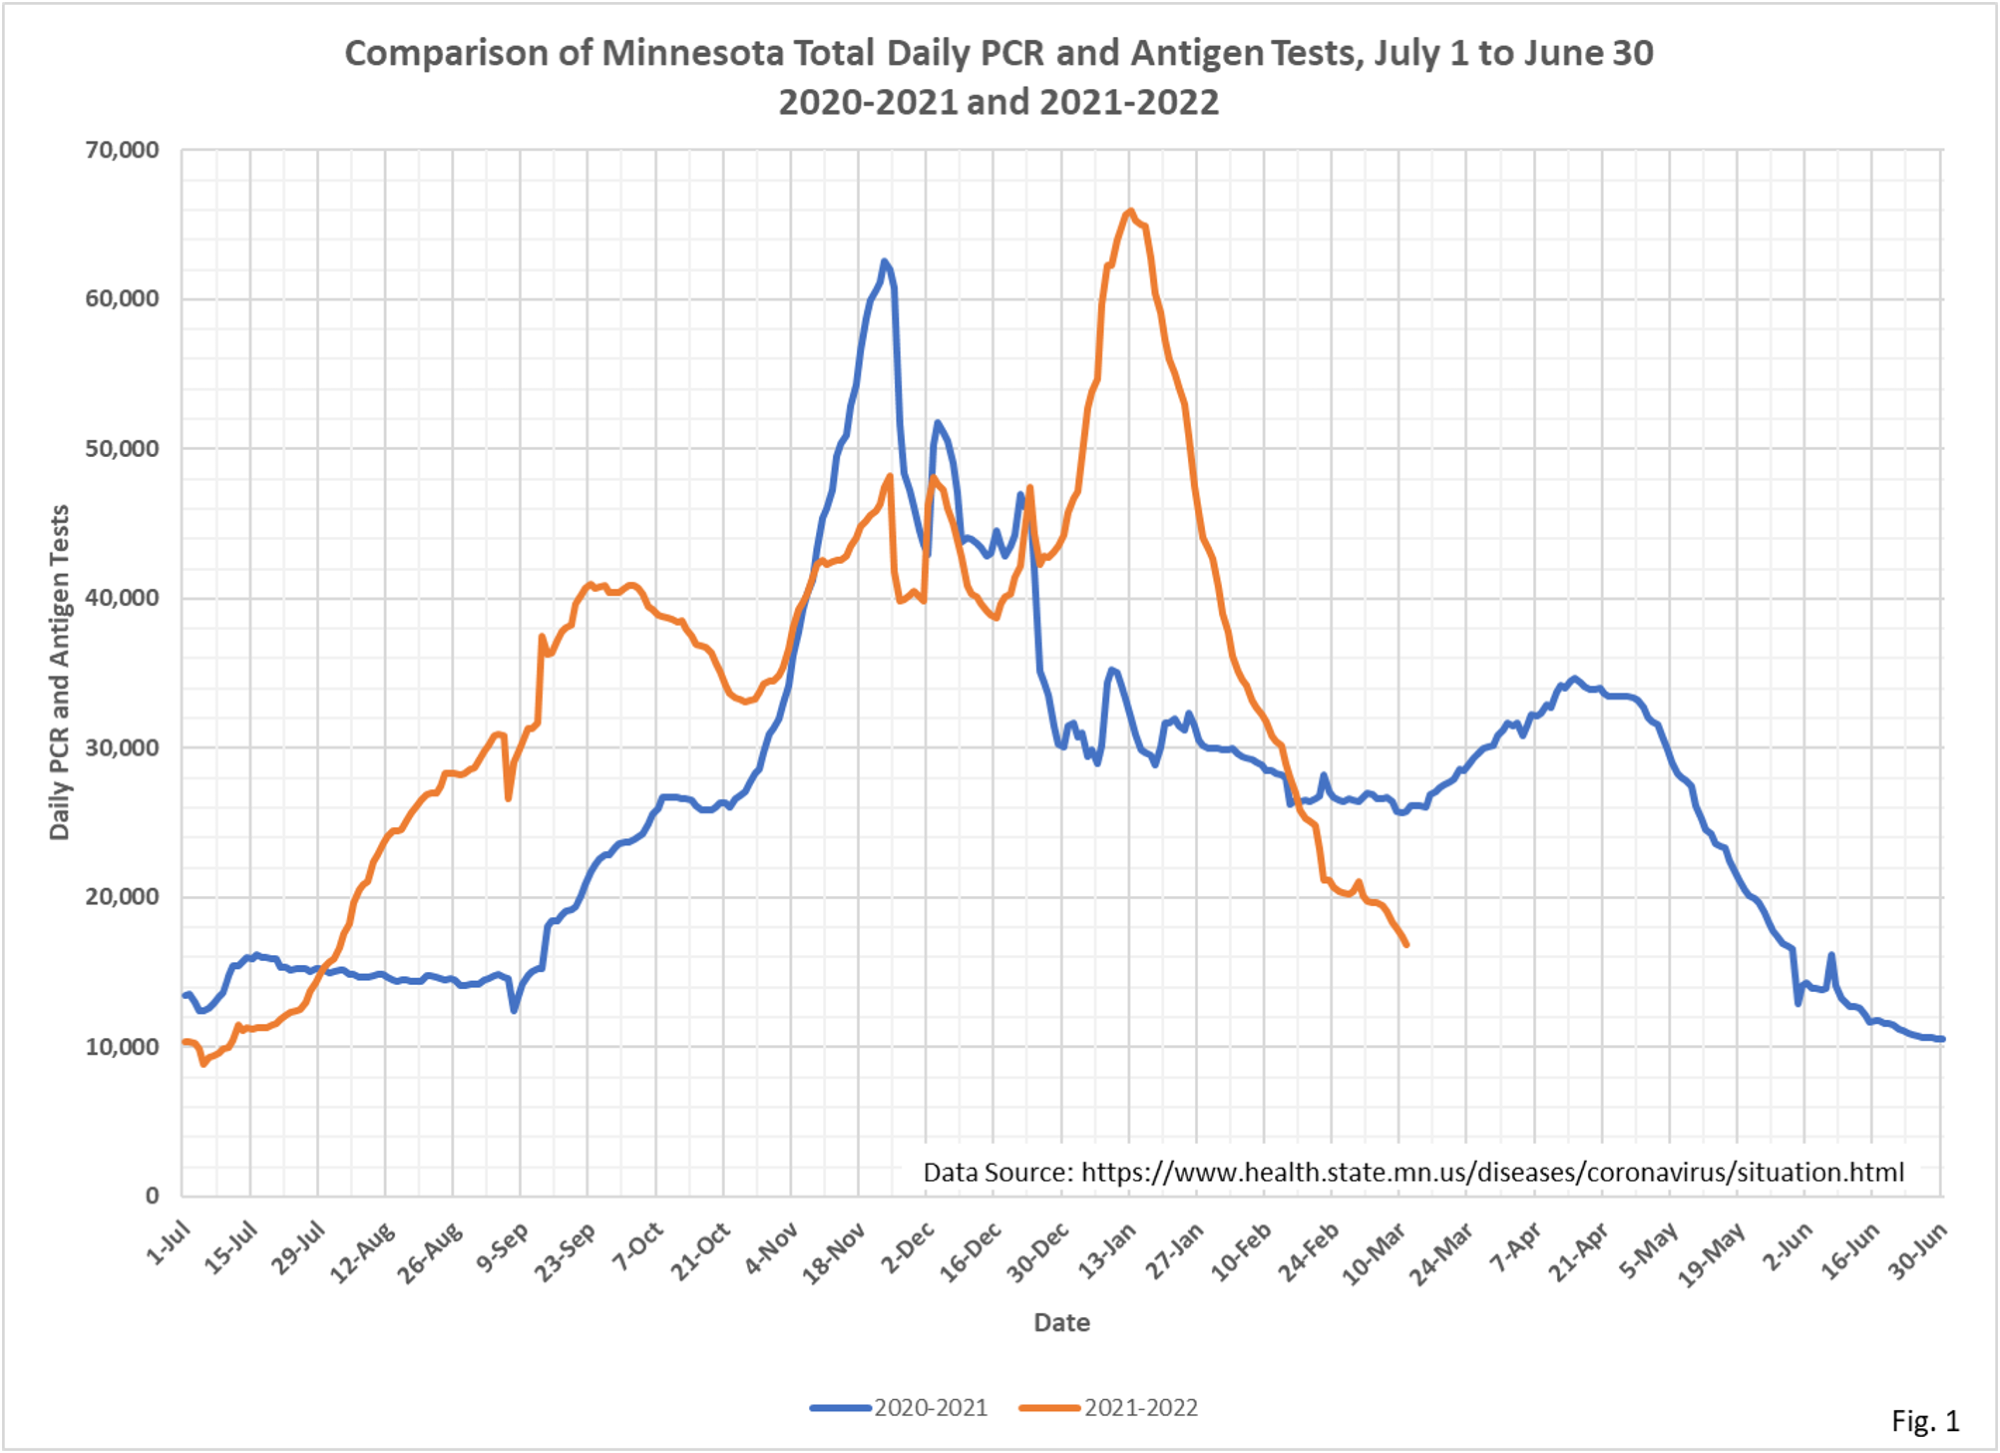
- Fig. 1: Average tests per day continue to drop sharply, falling to an average of 16,837 tests per day.
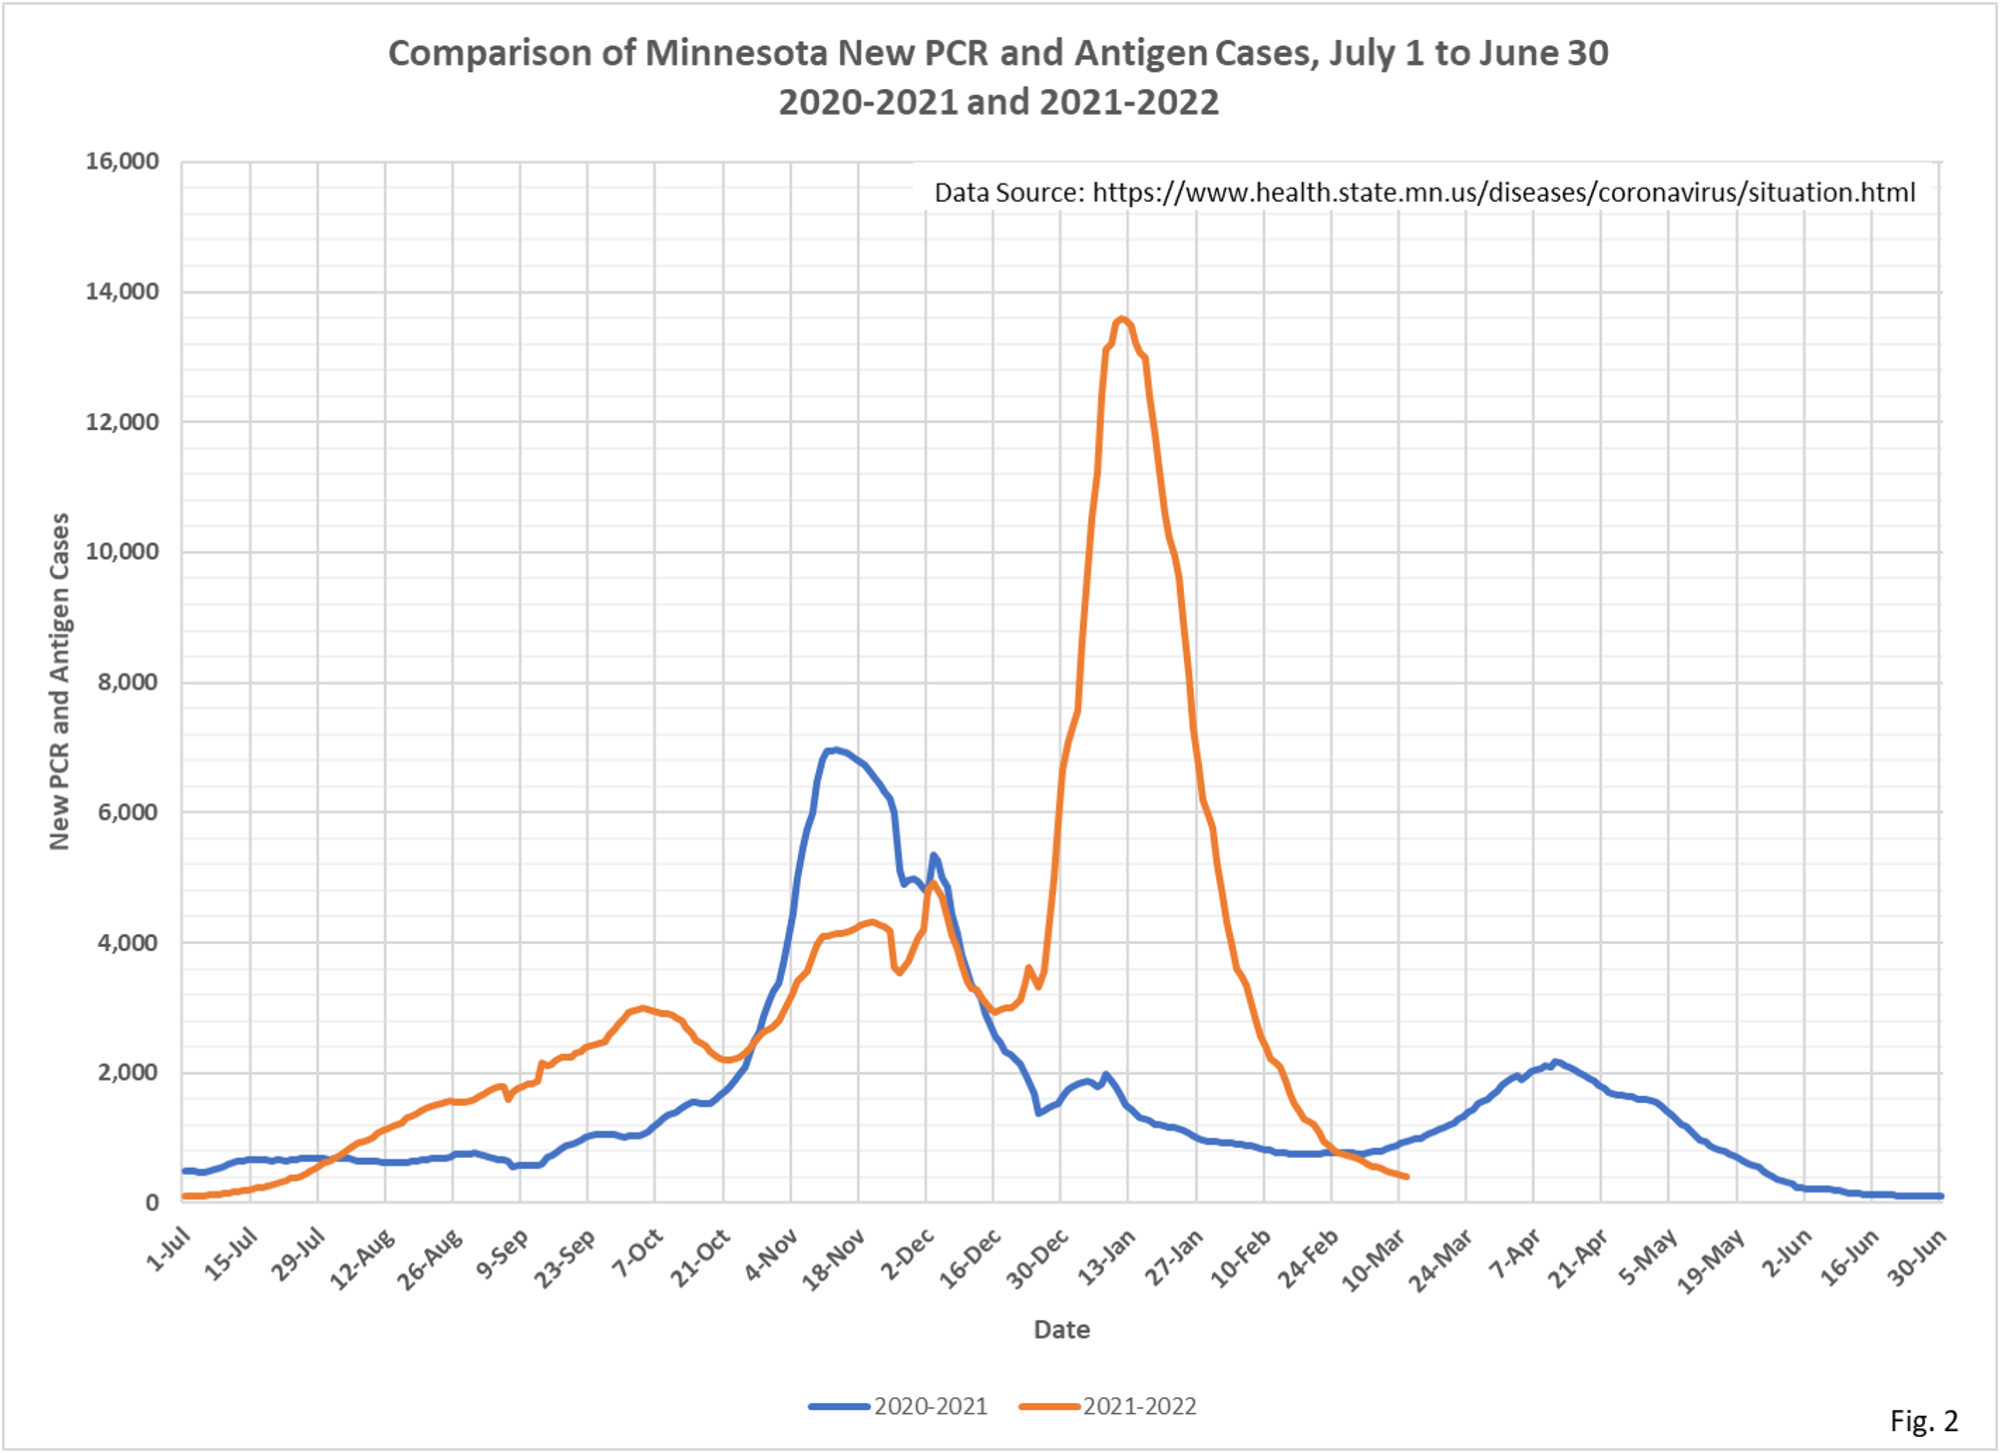
- Fig. 2: New daily cases per day are now starting to level out at a very low level, 402 cases per day, but still falling. Last year at this time Minnesota was just starting to rise into the small Spring wave of cases.
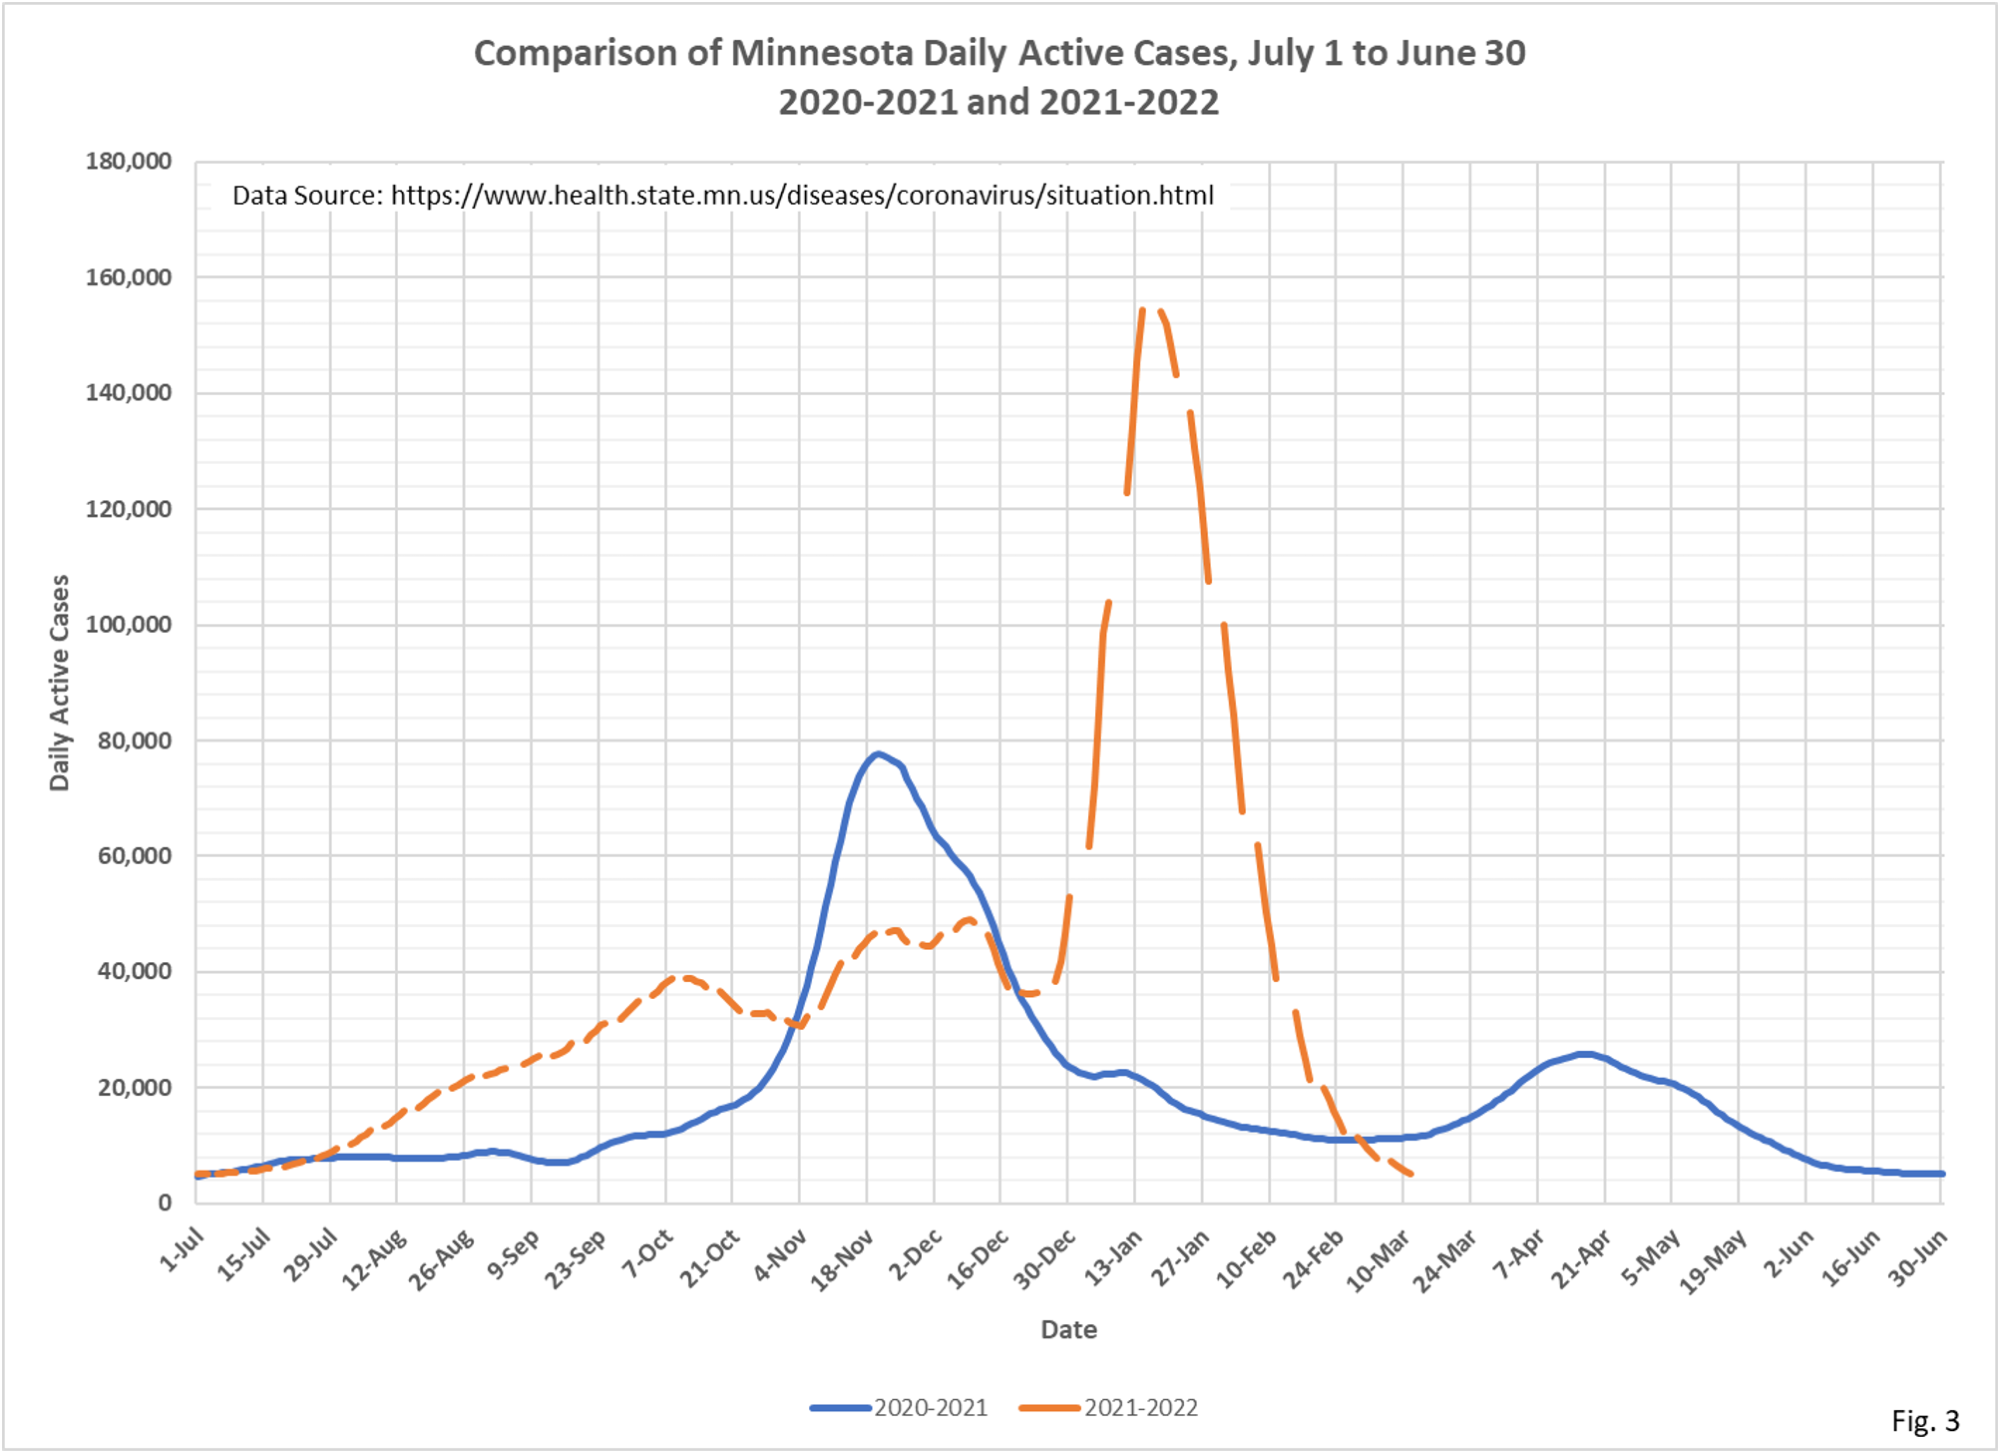
- Fig. 3: Active cases are now also starting to level off, lagging slightly behind new daily cases per day.
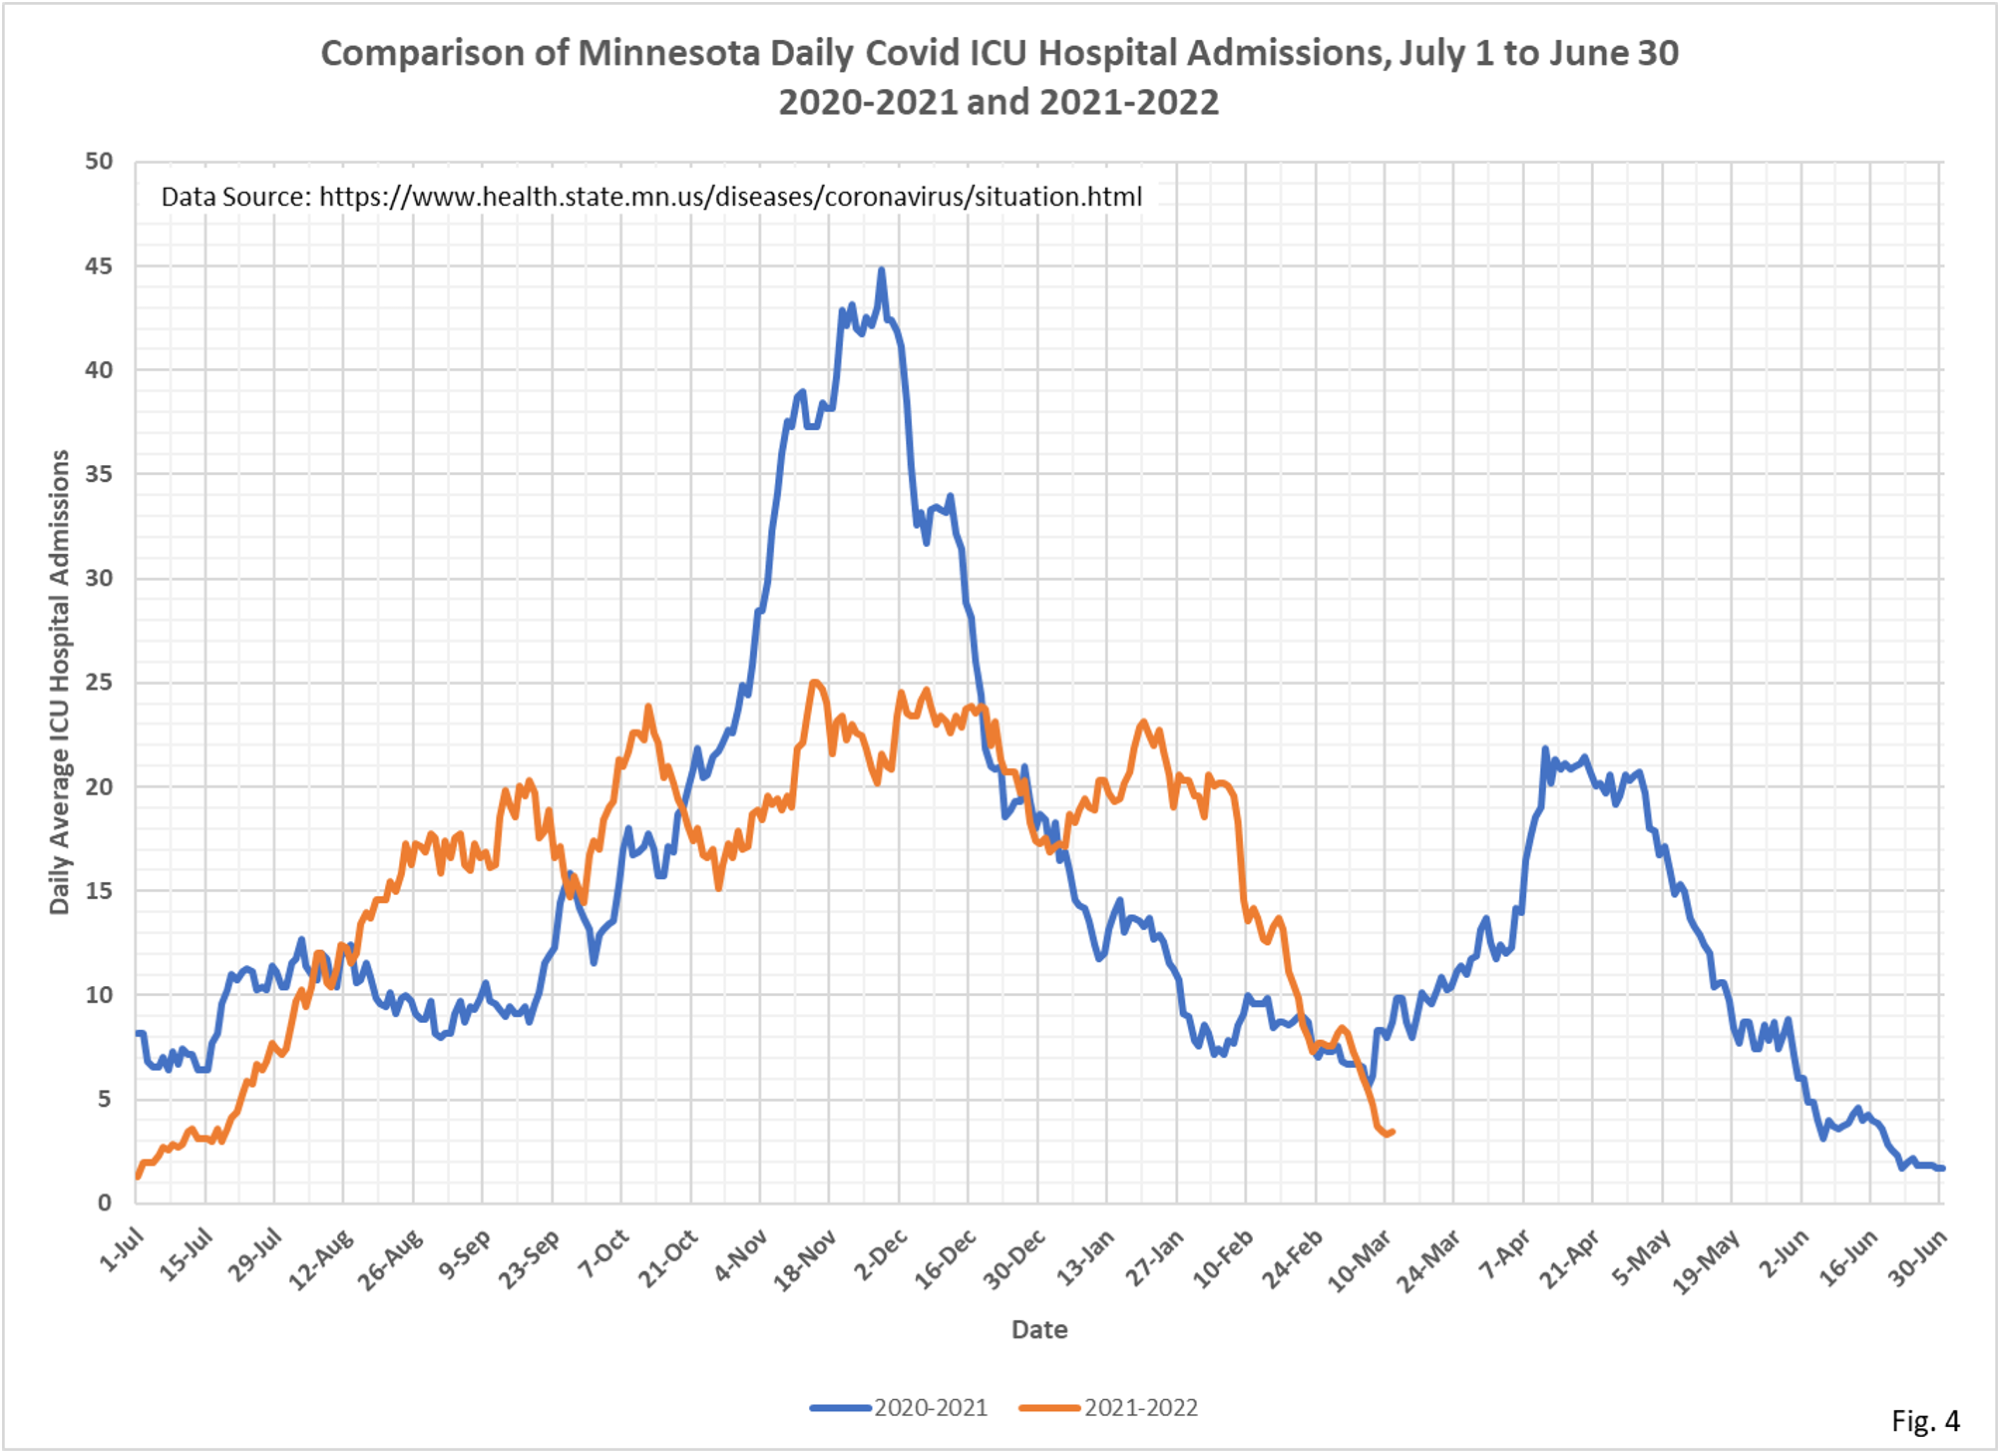
- Fig. 4: Covid ICU admissions per day are still dropping sharply, now averaging just 3 Covid ICU admissions statewide per day.
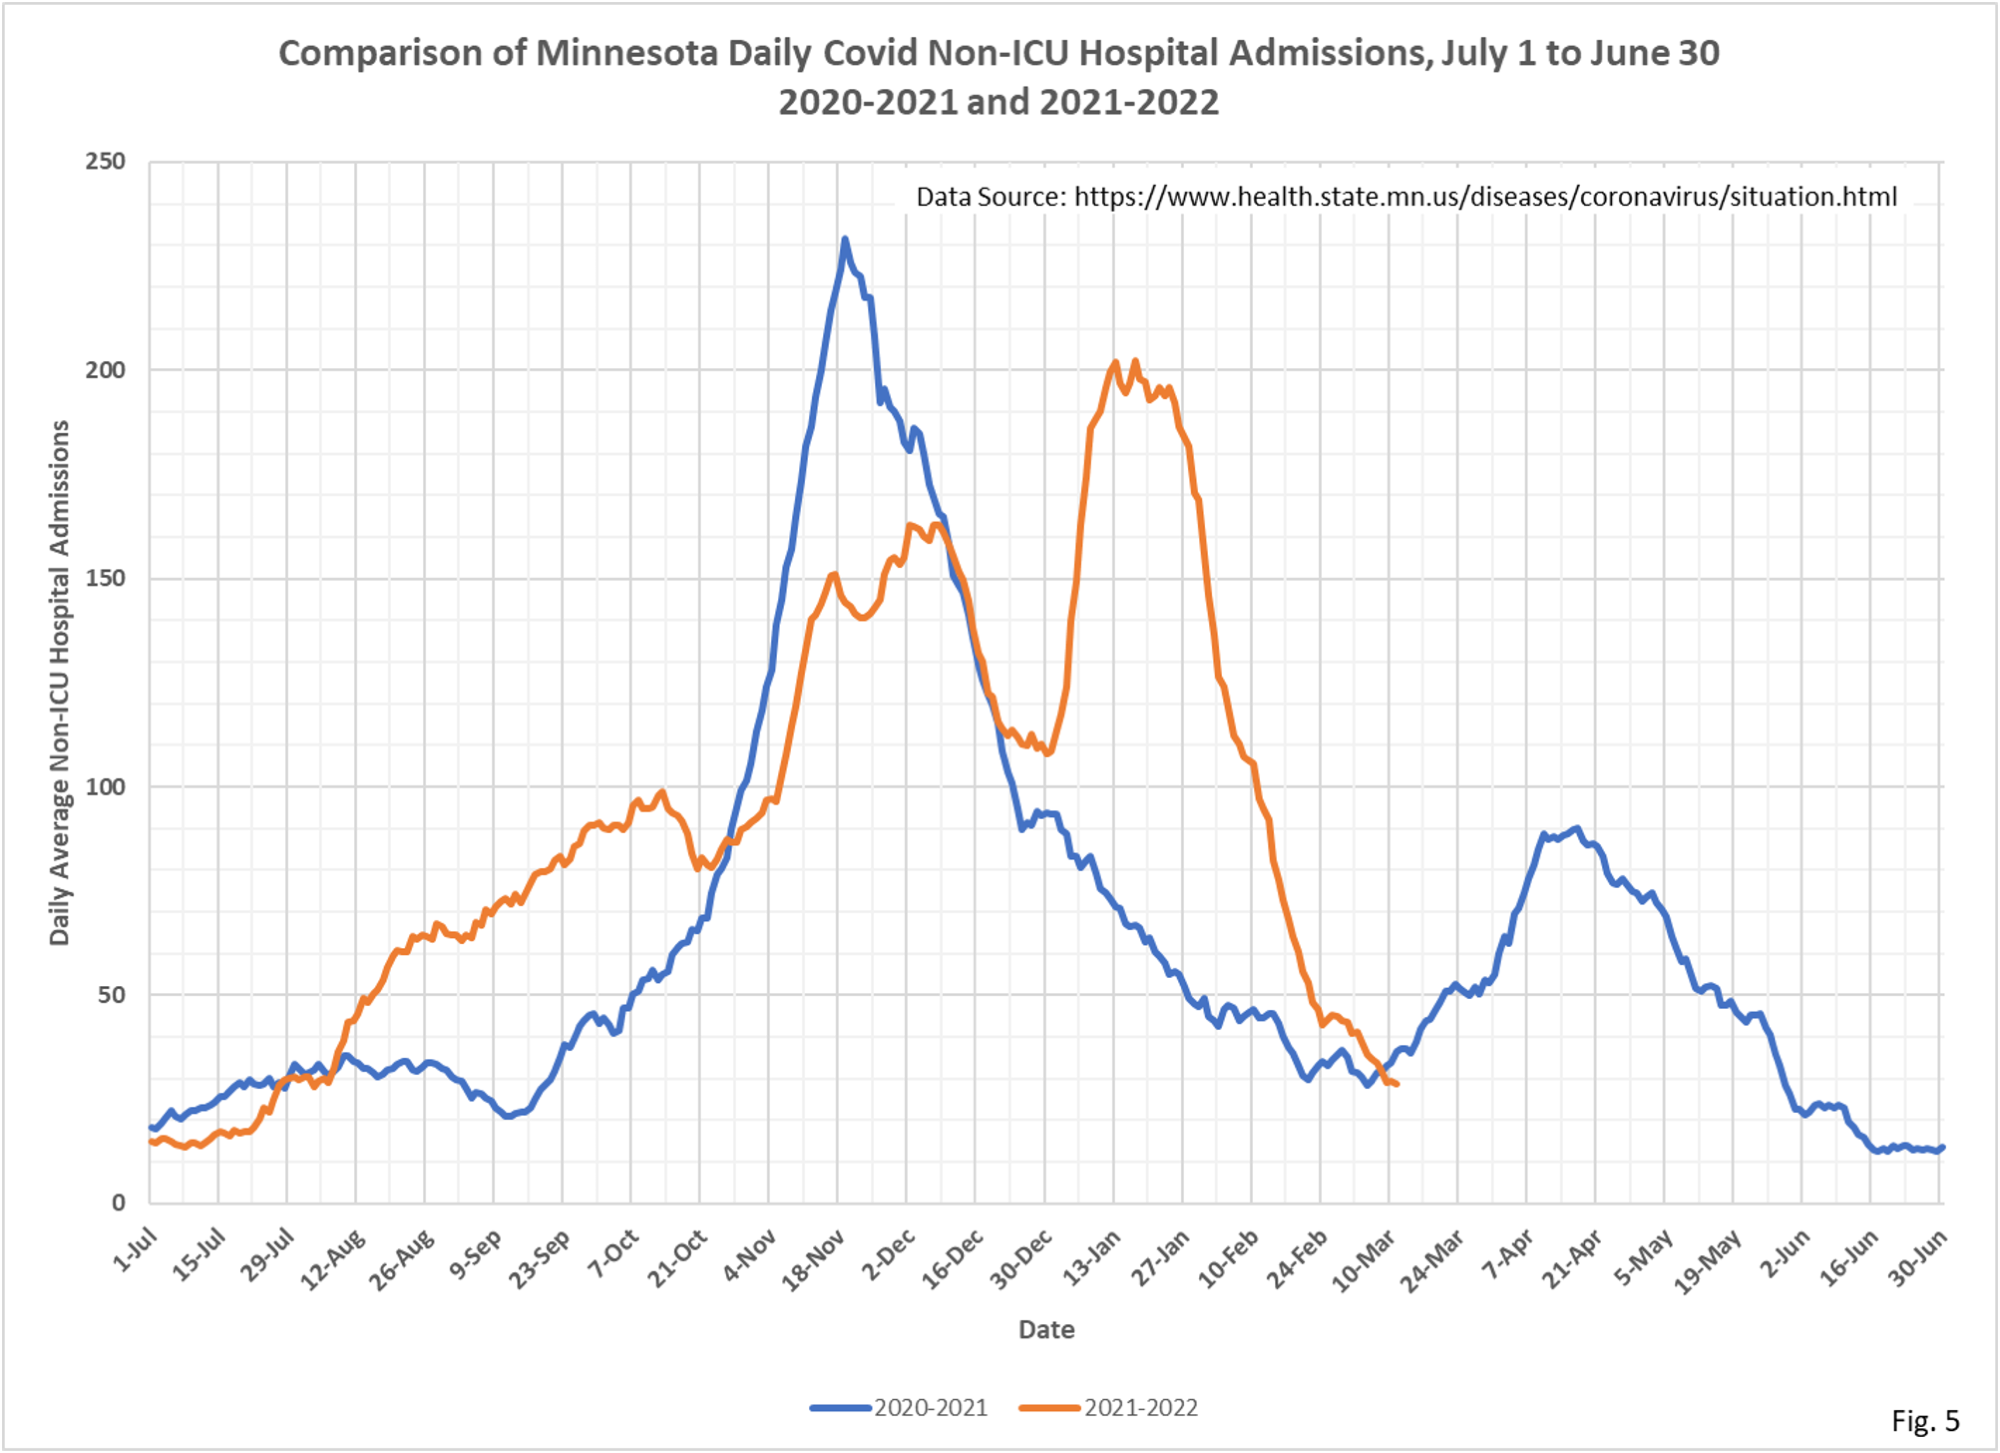
- Fig. 5: Covid Non-ICU admissions are also declining sharply, averaging 29 admissions per day.
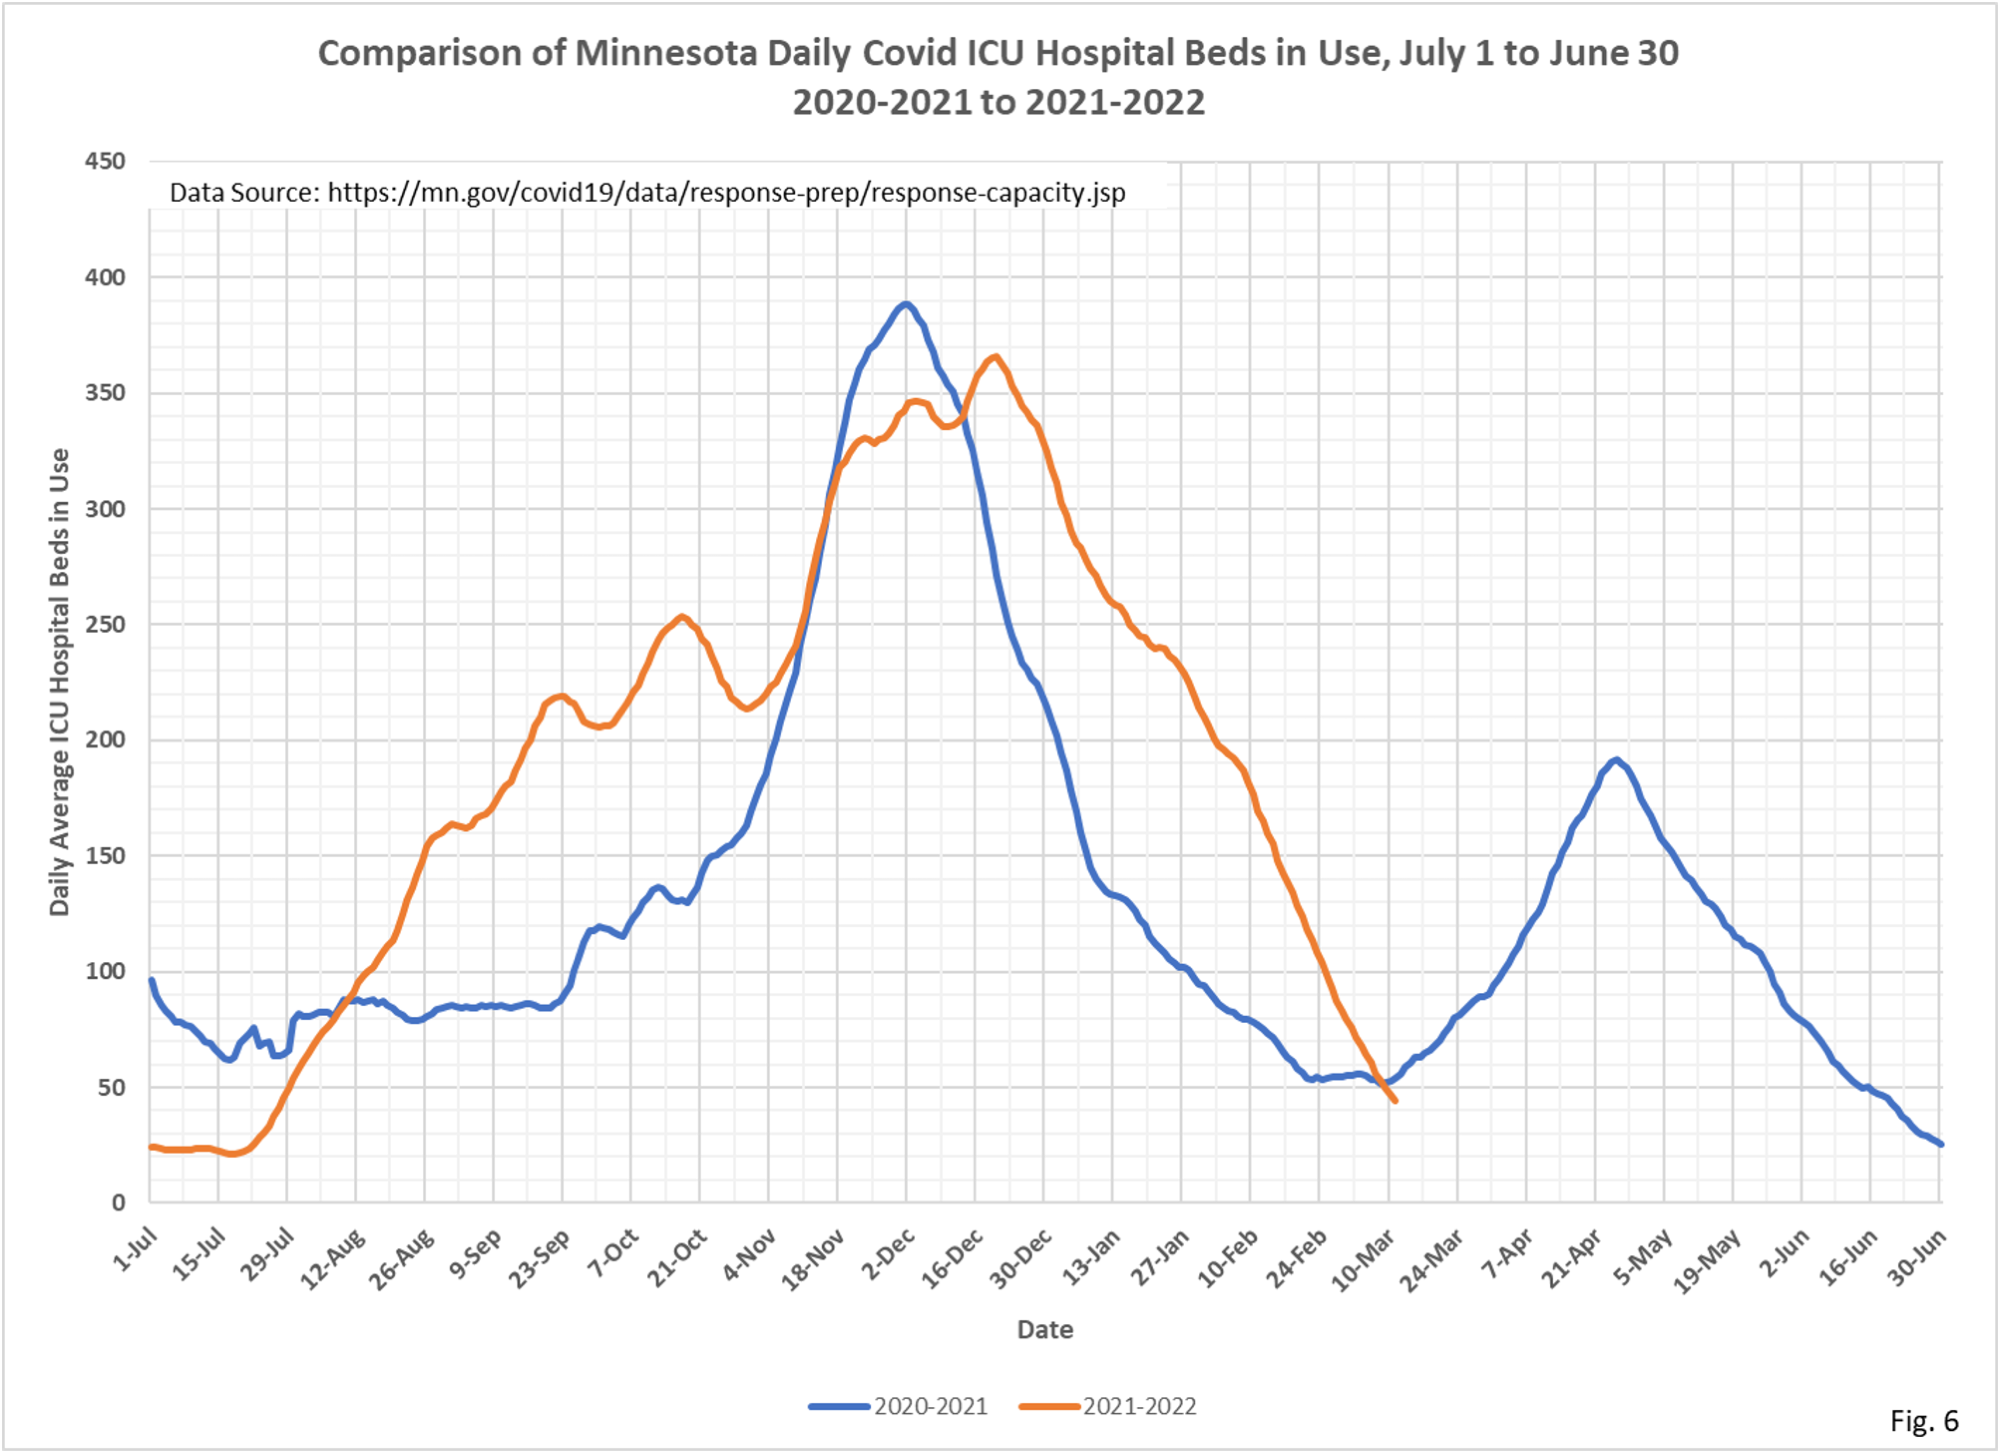
- Fig. 6: ICU Covid hospital beds in use continuing to fall, now averaging 44 ICU beds in use.
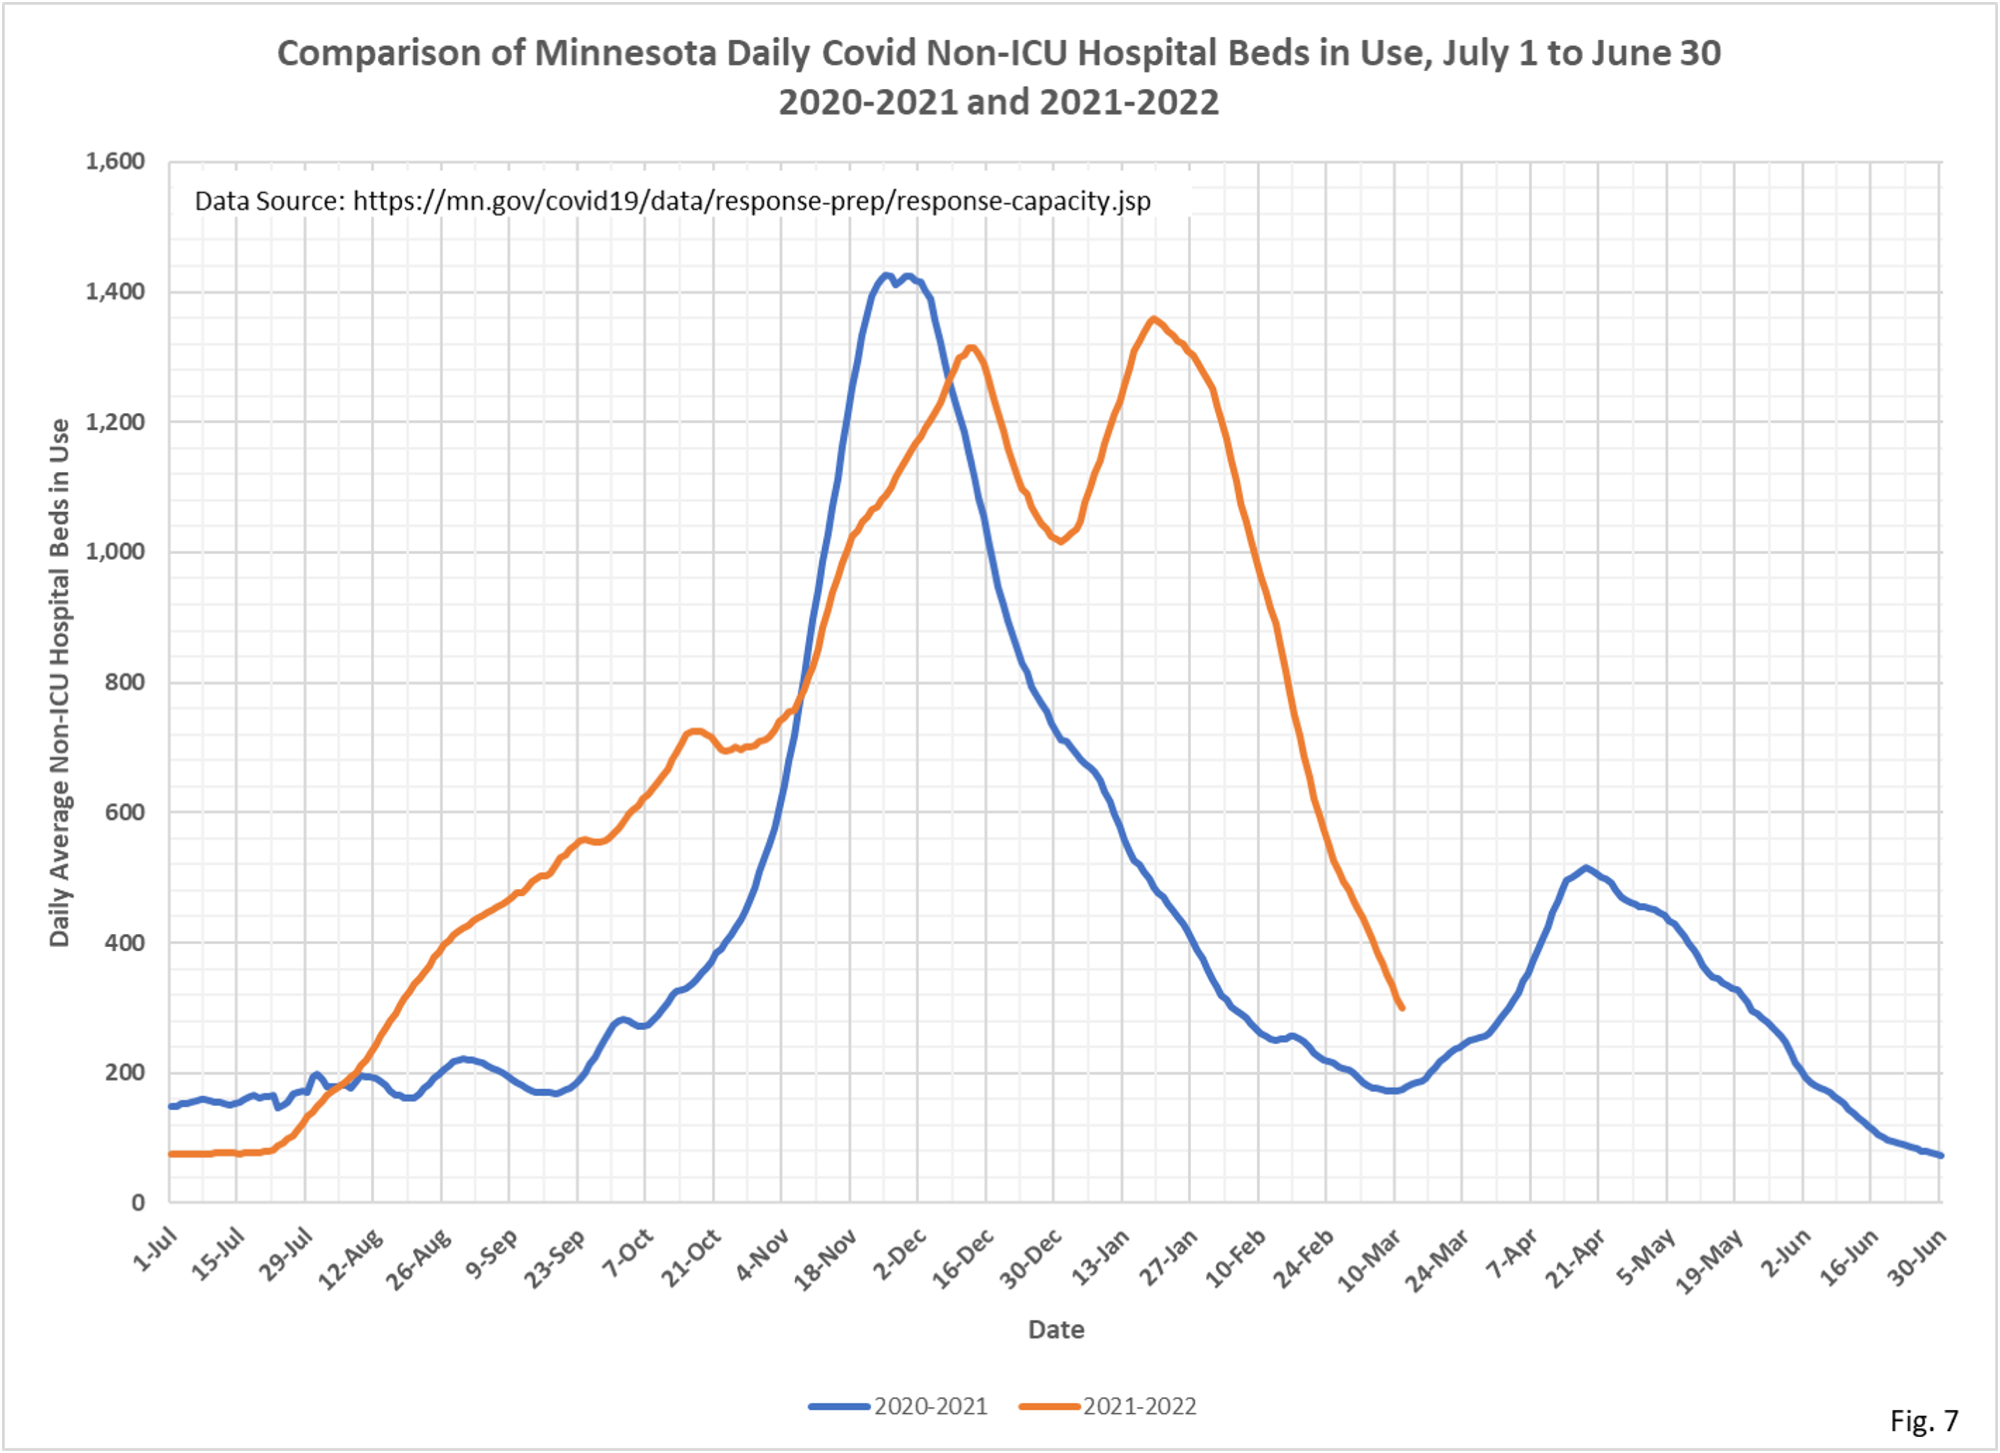
- Fig. 7: Non-ICU Covid hospital beds in use are falling, but still lagging the drop in cases and admissions. It still appears that Non-ICU length of stay is somewhat elevated.
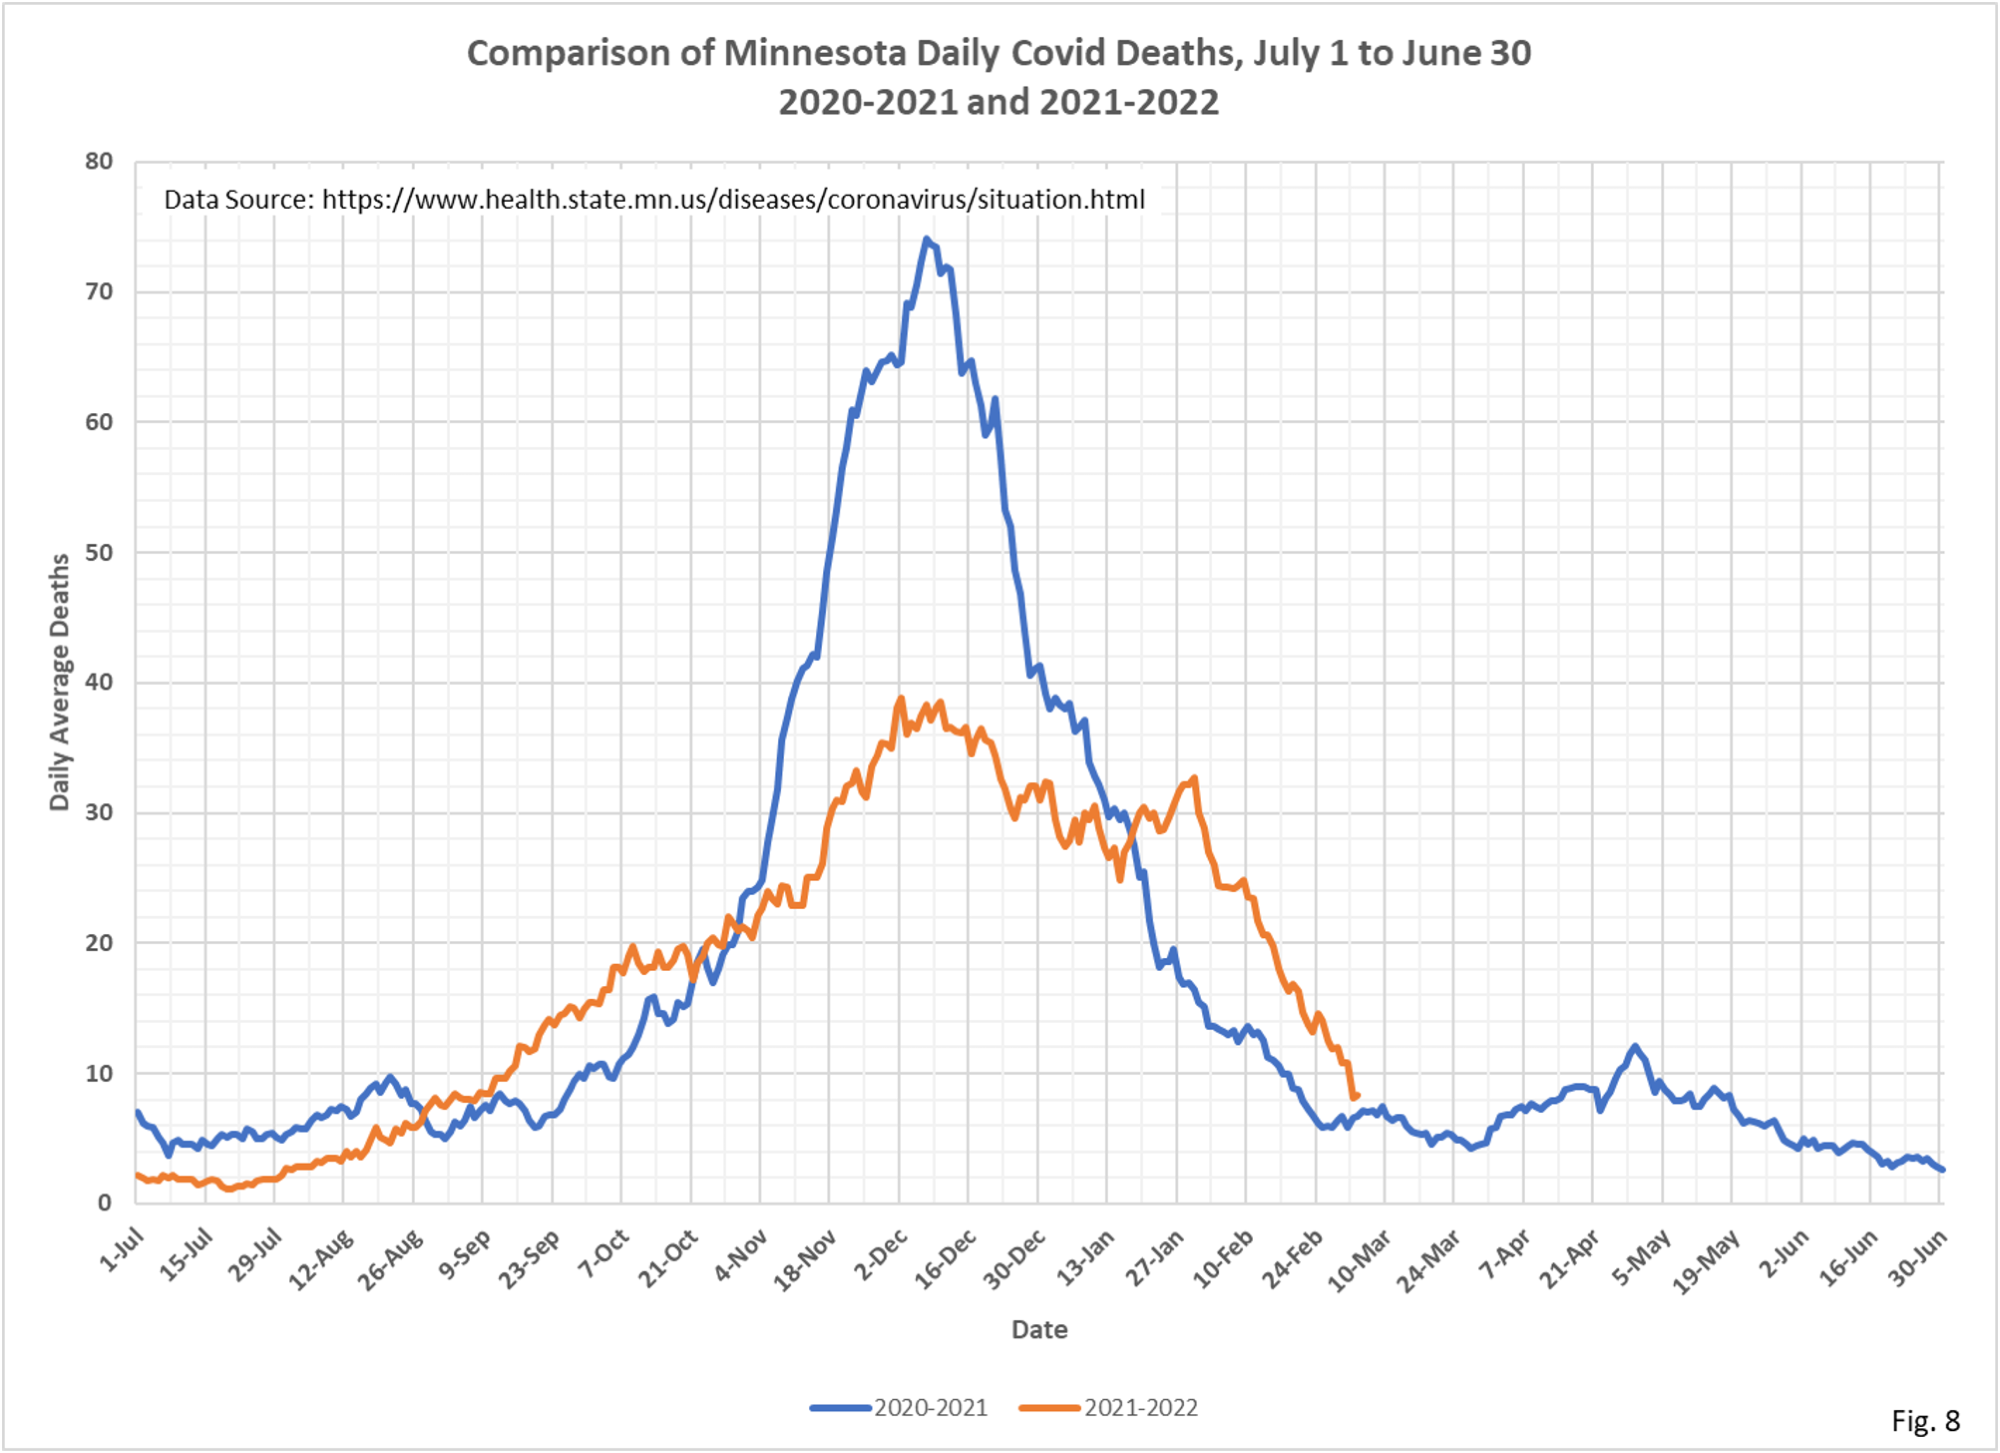
- Fig. 8: Deaths attributed to Covid continue to drift generally lower to an average of 8.3 deaths per day.
- For this version of the yearly comparison charts the date axis is formatted to display from July 1 to June 30, for 2020-2021 and 2021-2022. Data prior to July 1, 2020 is not shown.
- For all charts the last 7 days of data is excluded to avoid charting incomplete data. For the deaths chart data from the last 14 days is excluded. Note however that reporting by MDH has been lagging more than usual since January, and they are still adding cases from before Feb. 1.
- All data is taken from the Minnesota Department of Health Situation Update for OCVID-19 web page https://www.health.state.mn.
us/diseases/coronavirus/ situation.html and from the Response and Preparation web page https://mn.gov/covid19/data/ response-prep/response- capacity.jsp. - All data is shown as 7 day running averages.
