I have no idea why DOH, with all the money that has been given to them, is having trouble with processing data. Dave noted a week or so ago that the per capita rates seemed to be jumping around. DOH actually responded by saying they had screwed up and it should be fixed by today. And indeed, today’s release is back to where it previously was. If they had explained the issue right away, they would have spared a lot of confusion. And there still are very serious issues with how they do these per capita calculations. They are not likely accurate. Dave’s notes:
- In two posts we discussed the fact that the Minnesota Department of Health (MDH) had lowered the unvaccinated per capita rates for cases, hospitalizations, and deaths on 2/28/2022. The first post here https://healthy-skeptic.com/
2022/03/02/doh-and-per-capita- rates-incompetence-or-data- fiddling/ described our initial observation of the changes. This post https://healthy-skeptic.com/ 2022/03/03/more-on-per-capita- rates/ provided some charts to illustrate the changes in the per capita rates for the 65+ age group as an example, and provided MDH’s response. MDH had informed us that the reductions in per capita rates was due to updates being done to the vaccination database, and that these reductions would be corrected on 3/07/2022. Finally, this post https://healthy-skeptic.com/ 2022/03/06/per-capita-rates- another-update/ provided our estimate for what the per capita unvaccinated rates should be, based on data obtained from MDH through a Data Practices Act request. - We can now report, with the data published by MDH on 3/07/2022, that the per capita rates for the unvaccinated have been effectively returned to their status the week before 2/28/2022, with only some minor reductions as more older events were shifted from the unvaccinated to the vaccinated category.
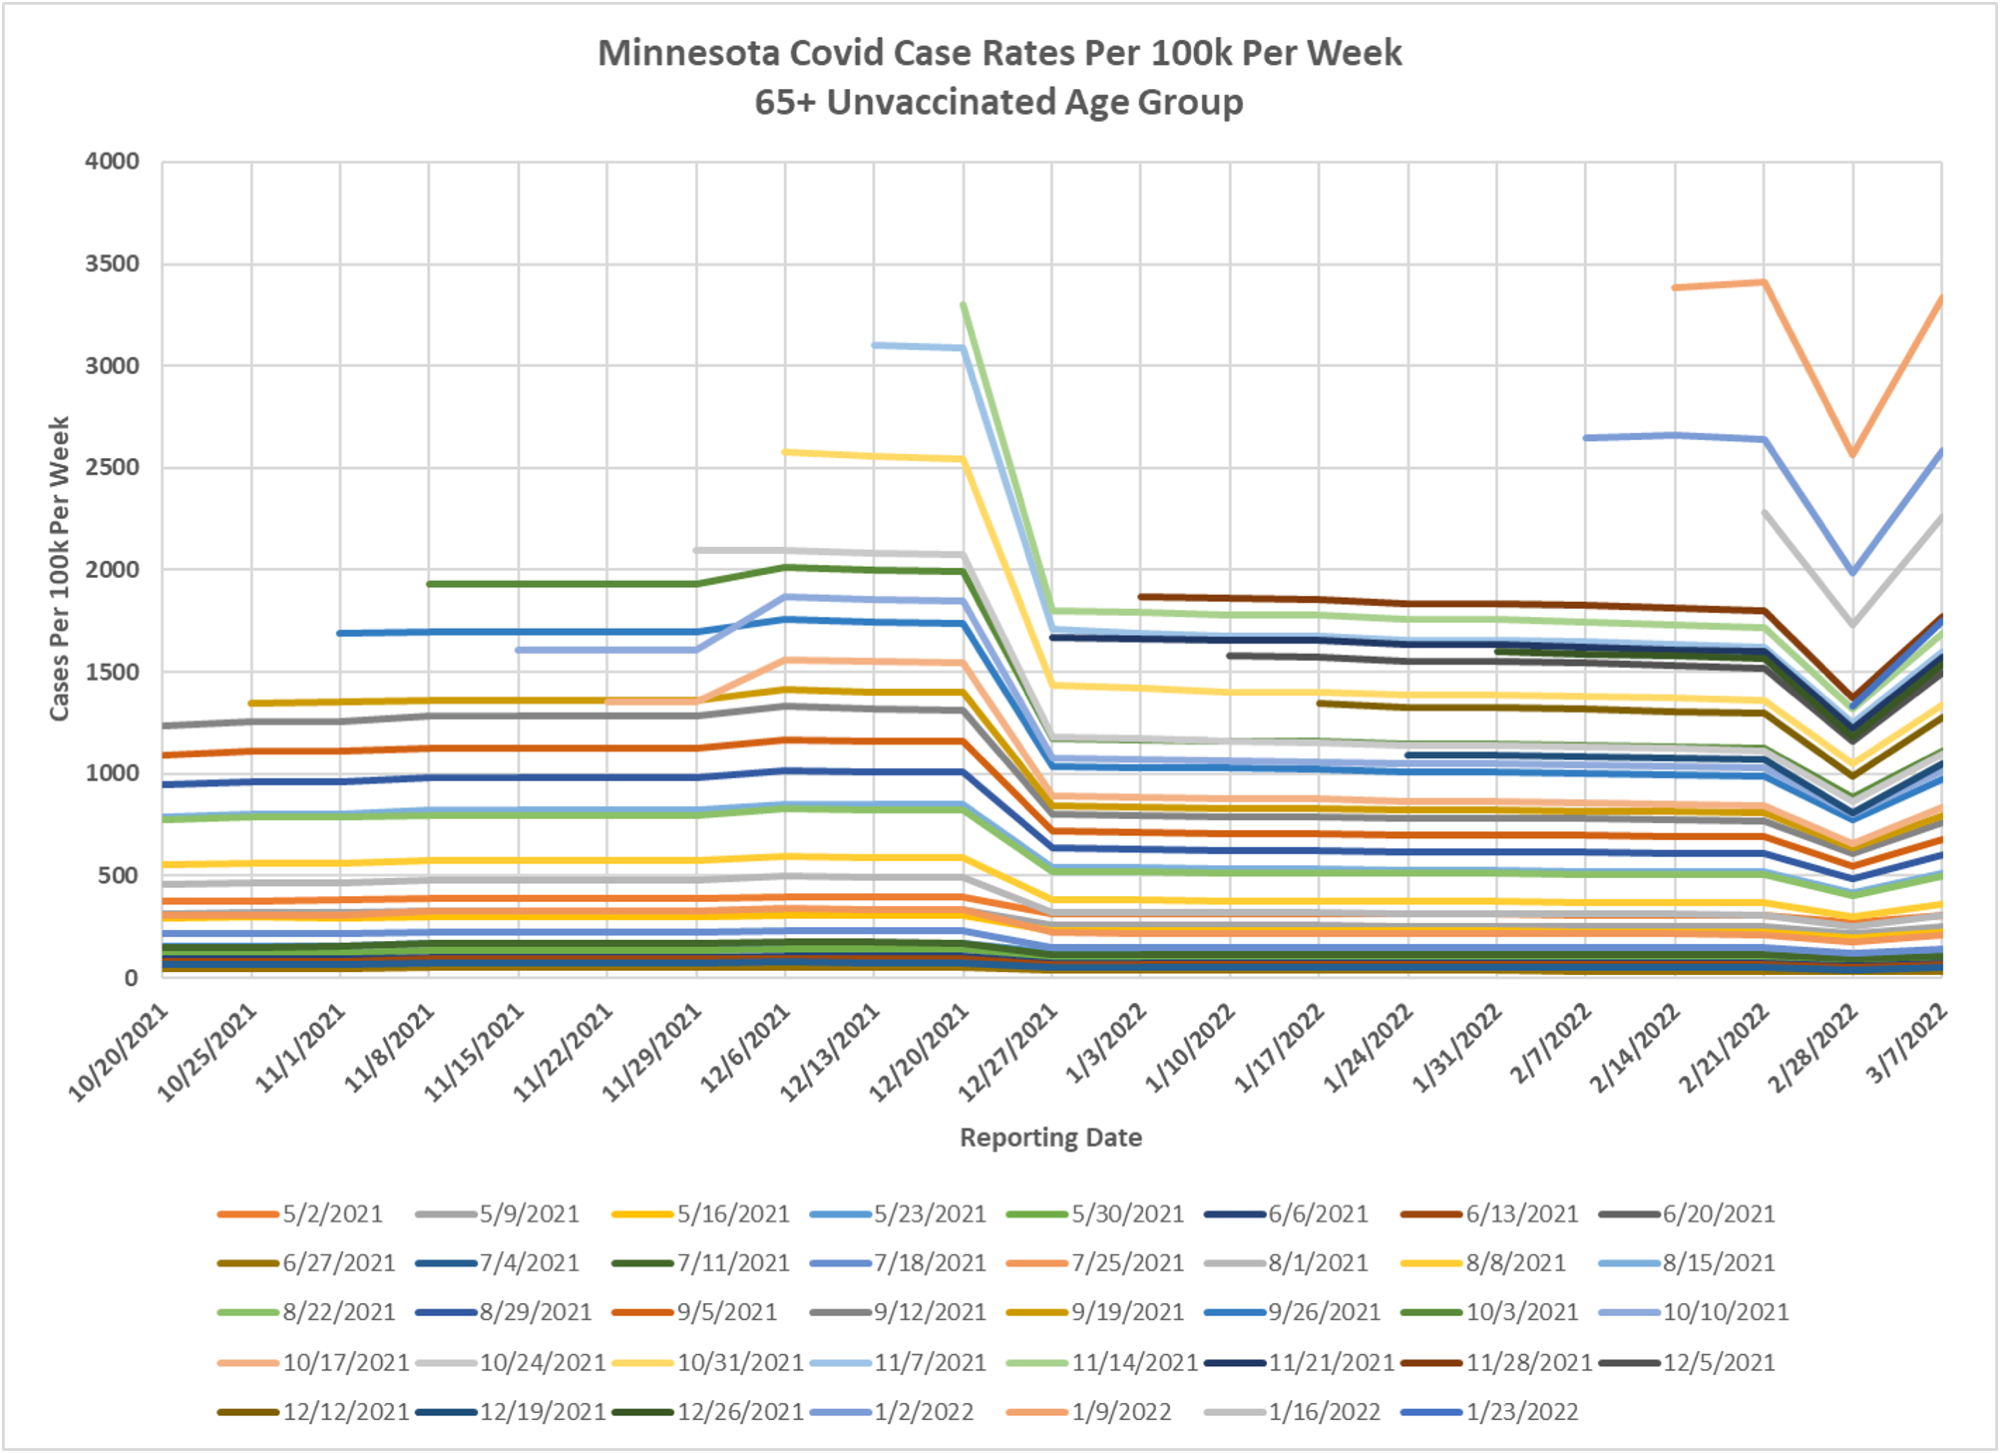
- The first slide displays the per capita rates for the unvaccinated 65+ age group for each week, and how each week’s reported rate changed over time. The 10% to 20% reduction on 2/28/2022 and then the reversal on 3/07/2022 can be clearly seen for all weeks.
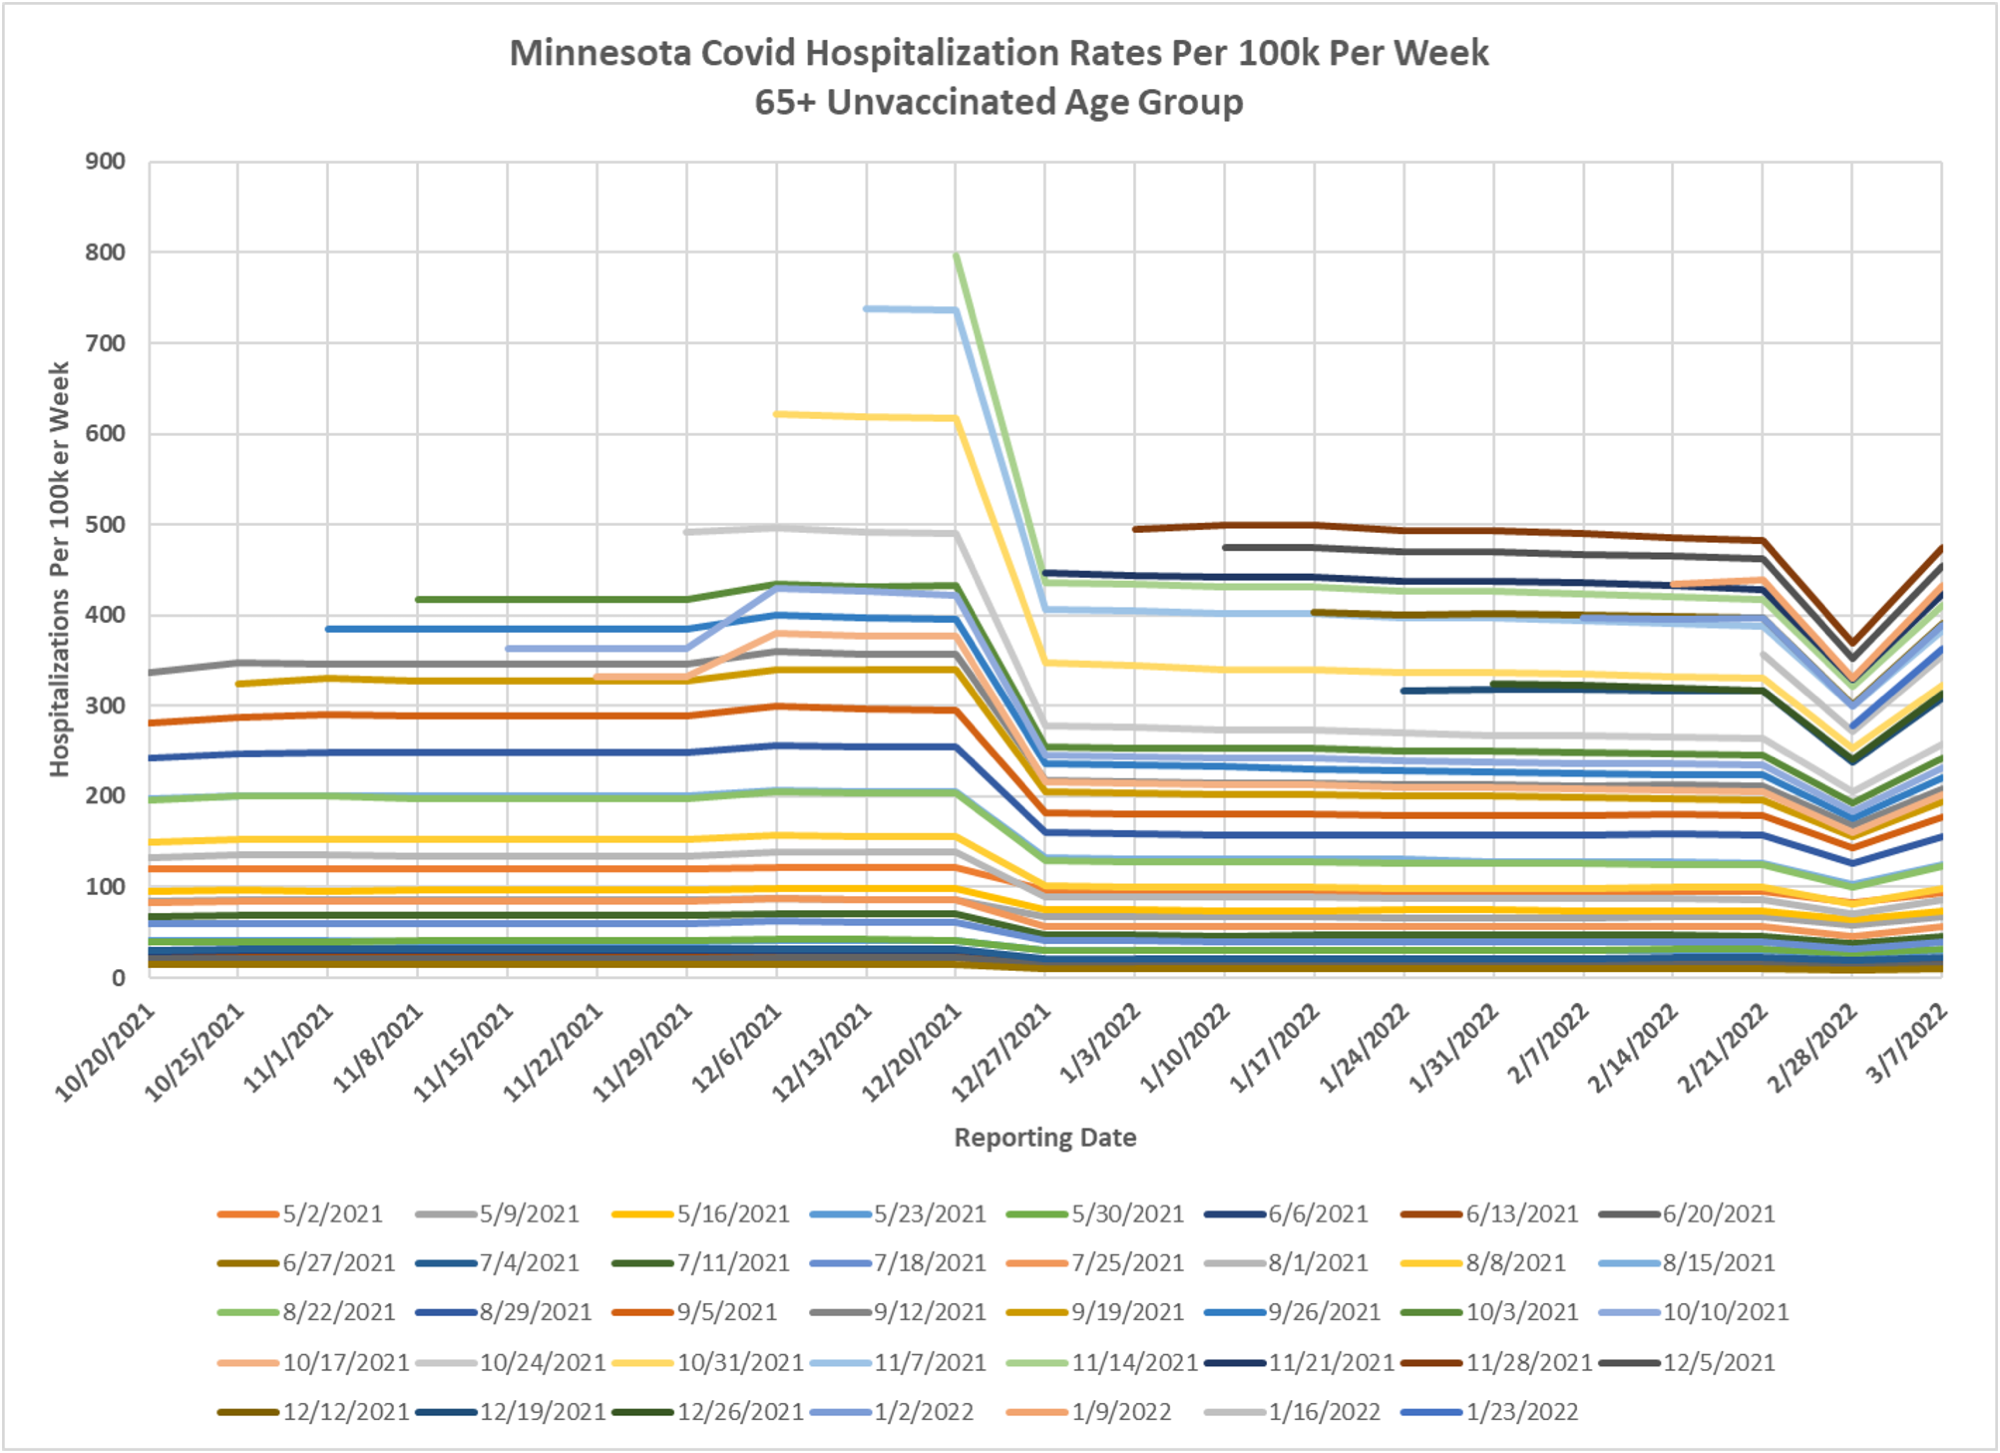
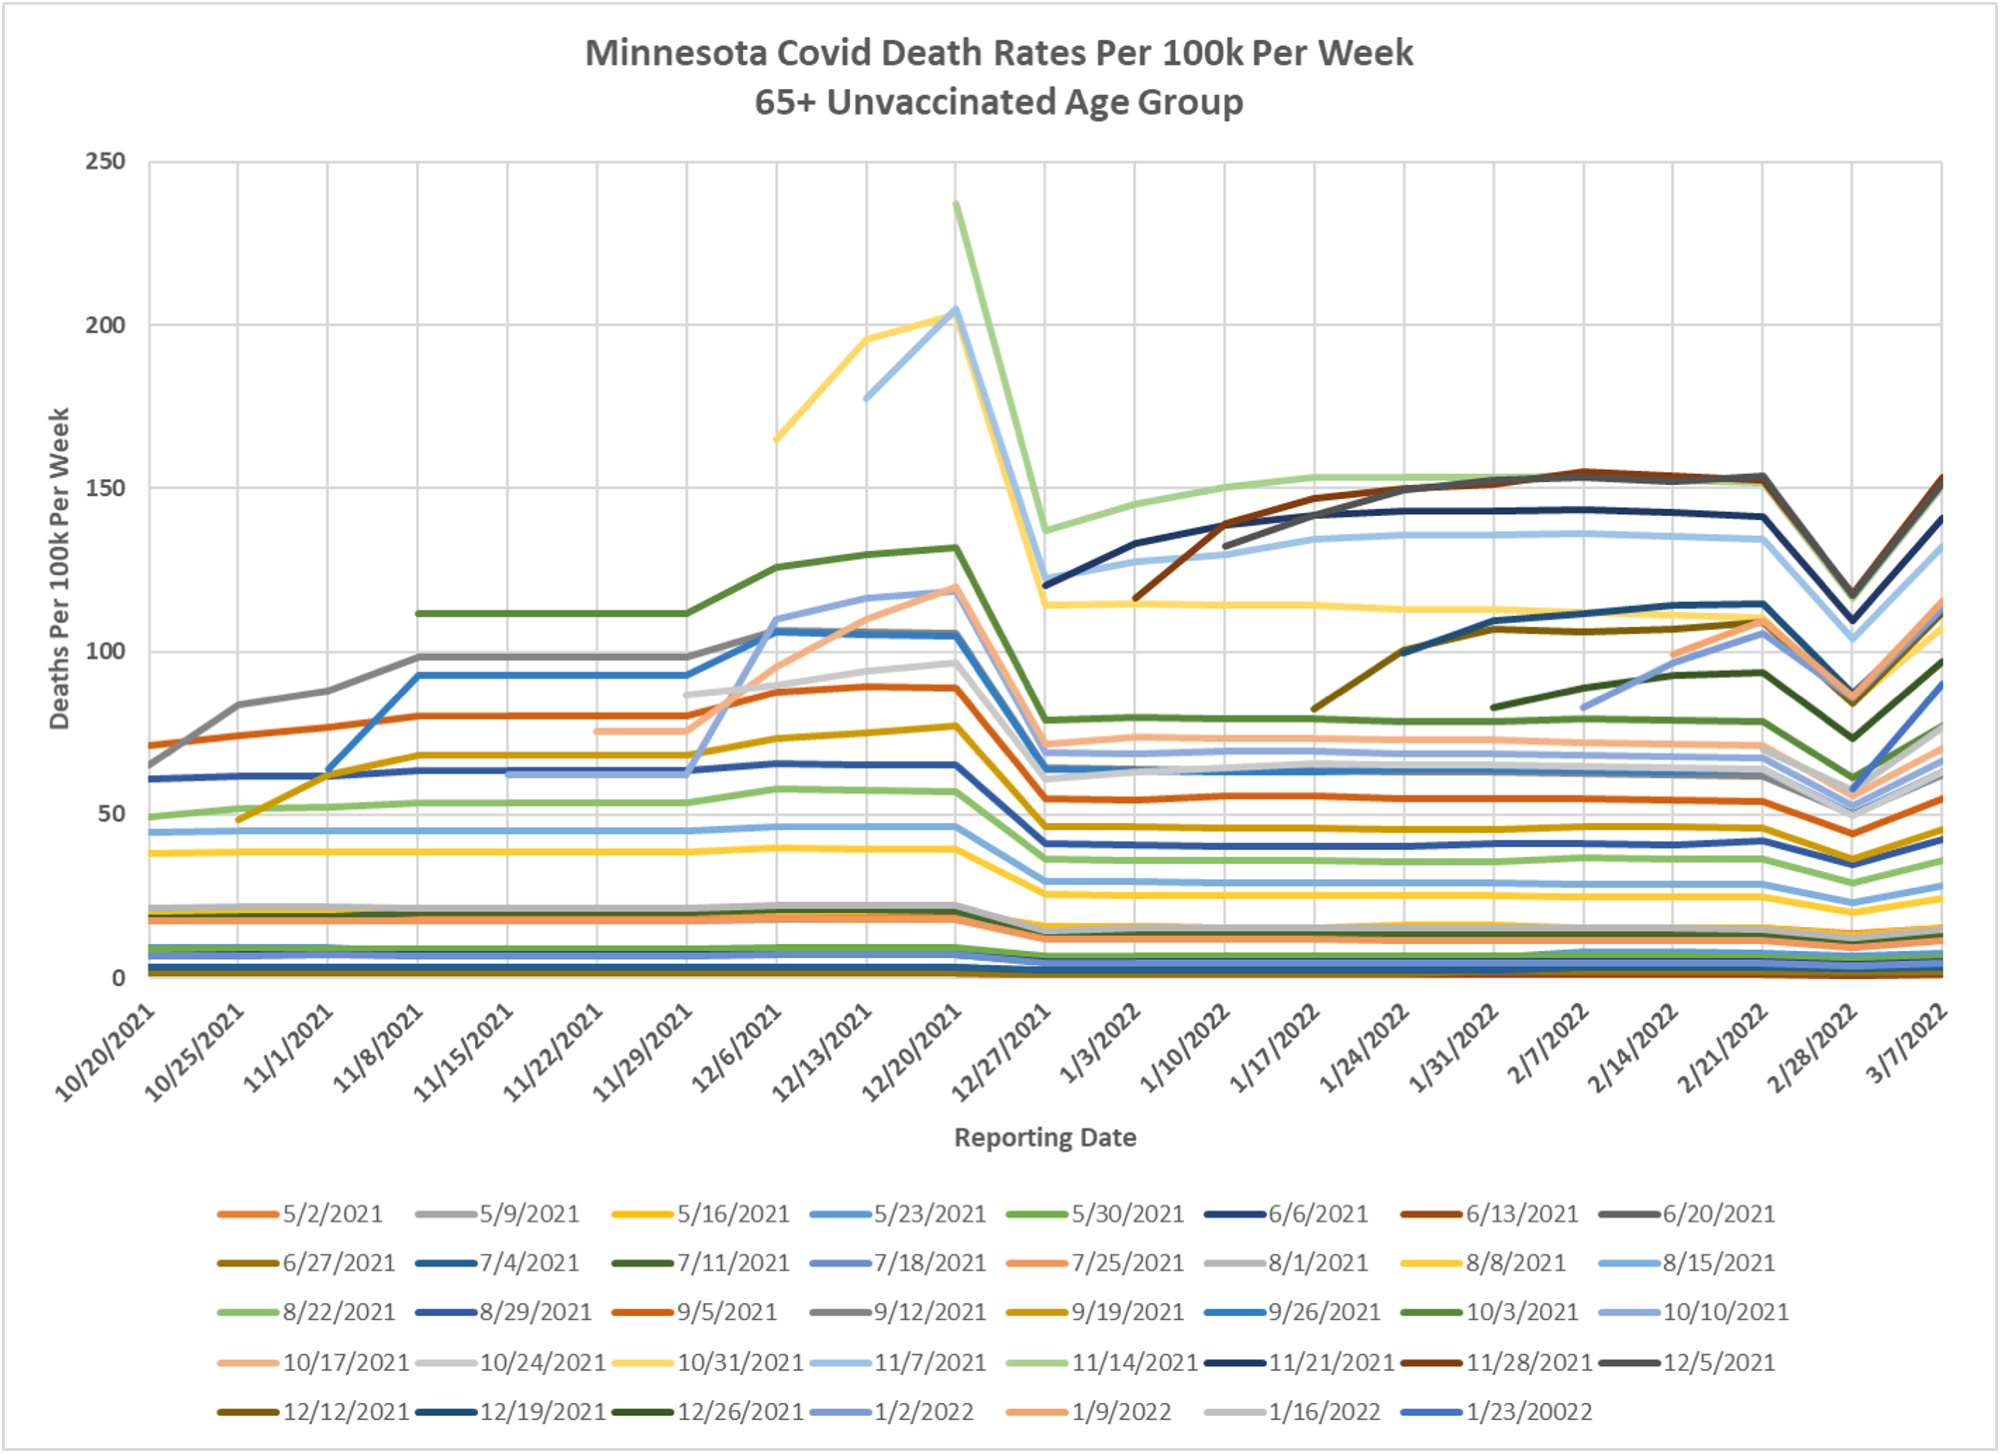
- The second slide, per capita hospitalization rates for the unvaccinated 65+ age group, and the third slide, per capita death rates for the unvaccinated 65+ age group, show the same pattern of changes the past 2 weeks.

So the most recent drop was “corrected” but the previous similar drop (end of December) was valid? I think the safest bet is to not trust anything from DOH.
I think you are right. There is something wrong in the numbers, giving a rate of unvaxed deaths during Omicron that really isn’t believable