Dave has diligently tried to replicate the DOH charts. We will need to wait for the next refresh of the DOH data next week, but it appears that the explanation about errors in data pulling are likely accurate. Dave’s notes:
- We recently published charts and notes describing how the Minnesota Department of Health (MDH) has lowered the case, hospitalization, and death per capita rates for the unvaccinated over time, here: https://healthy-skeptic.com/2022/03/03/more-on-per-capita-rates/ This post was prompted by MDH publishing lower per capita case rates for the unvaccinated, by between 10% and 20%, last Monday, 2/28/2022. MDH ascribed this particular change to database revisions that were occurring, and would be corrected with the next update on breakthrough data on 3/7/2022. We have been investigating these changes to try to understand what MDH is doing.
- We had submitted a Data Practices Act Request for breakthrough data, receiving the most data set on 2/24/2022. This data set includes the data and age of all breakthrough cases. Using this data, the cases by data and specimen collection date published here https://www.health.state.mn.us/diseases/coronavirus/stats/index.htmland, and the vaccination data published on the MDH Vaccine Data web page https://mn.gov/covid19/vaccine/data/index.jsp, we are able to calculate per capita case rates for the vaccinated and unvaccinated populations over time, replicating the case rates that MDH publishes. These charts, for the 50-64 and 65+ age groups, are below.
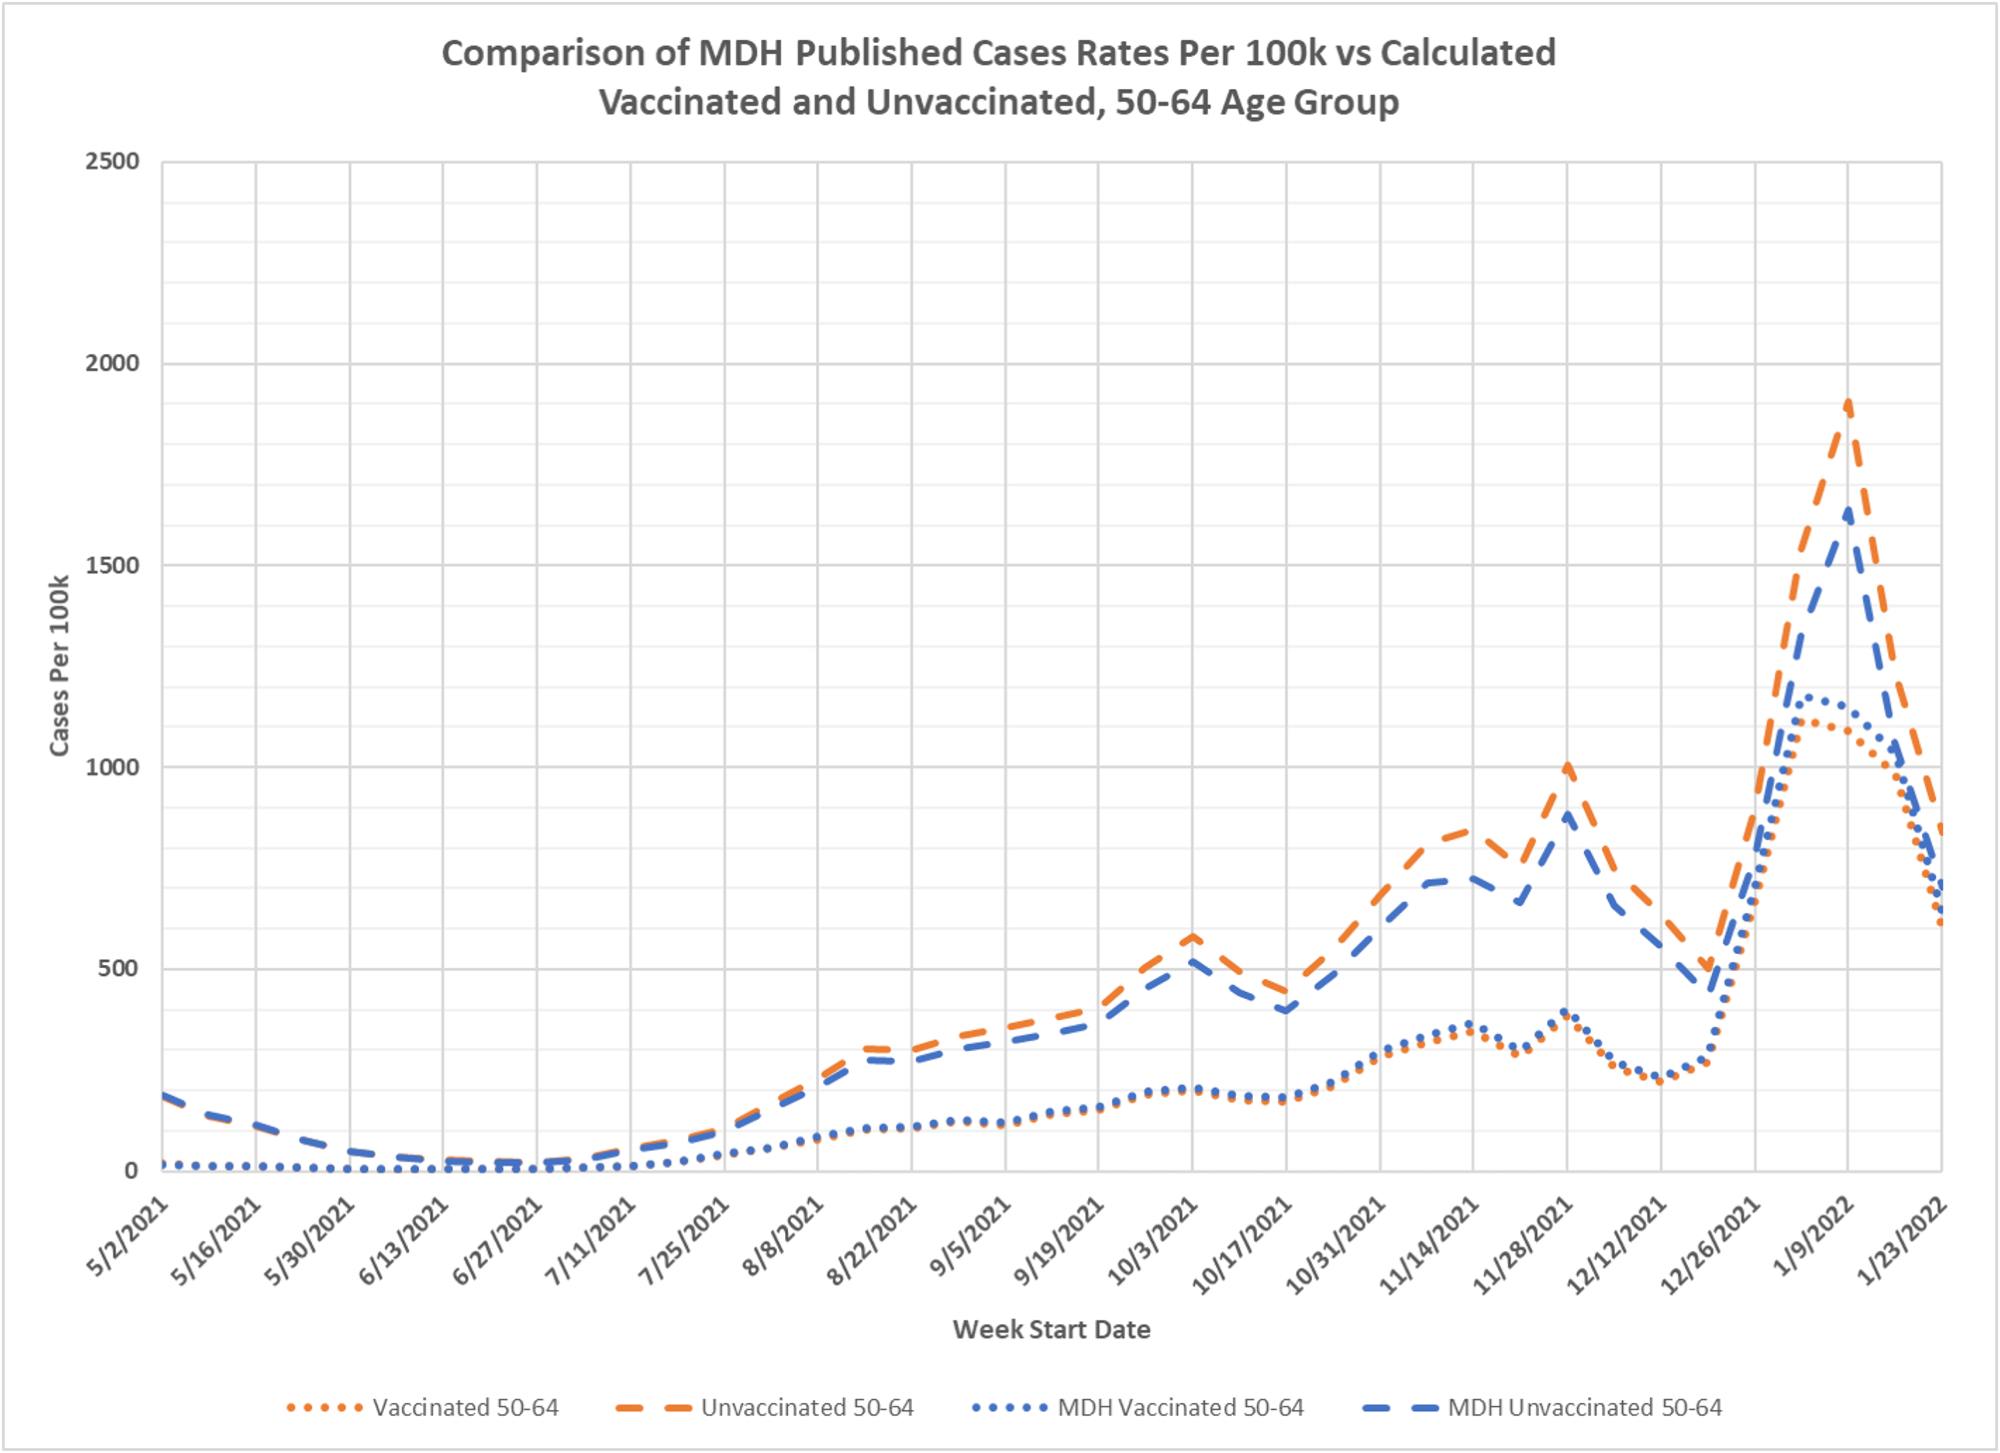
- In the first chart, for the 50-64 age group, the published MDH per capita case rates are plotted in blue without any modification, and our replicated per capita case rates are shown in orange. The per capita rates for the unvaccinated are shown as dashed lines, and the per capita rates for the vaccinated are shown as dotted lines. We can see that for the unvaccinated (dashed lines) our replicated per capita rate peaks at 1907 per 100k on 1/9/2022, while MDH’s case rate peaks at 1639 per 100k. Our replicated per capita rate is therefore 14% higher than MDH’s published per capita rate, which supports their claim that that the 10% to 20% reductions in per capita rates that MDH published on 2/28/2022 were in fact incorrect.
- Also on the 50-64 chart, the per capita case rates for the vaccinated are shown as dotted lines. In this case our replicated rate is lower than the MDH published. Presumably MDH will lower the vaccinated per capita case rate with the next update, matching our rate in blue.
- Another interesting feature on the 50-64 chart is the huge increase in the vaccinated per capita case rate during the Omicron surge in cases in late 2021. At the peak of Omicron the vaccinated per capita case rate was 1176 per 100k, while the peak unvaccinated per capita case rate 1907 per 100k, meaning that the unvaccinated were less than twice as likely to test positive as the vaccinated.
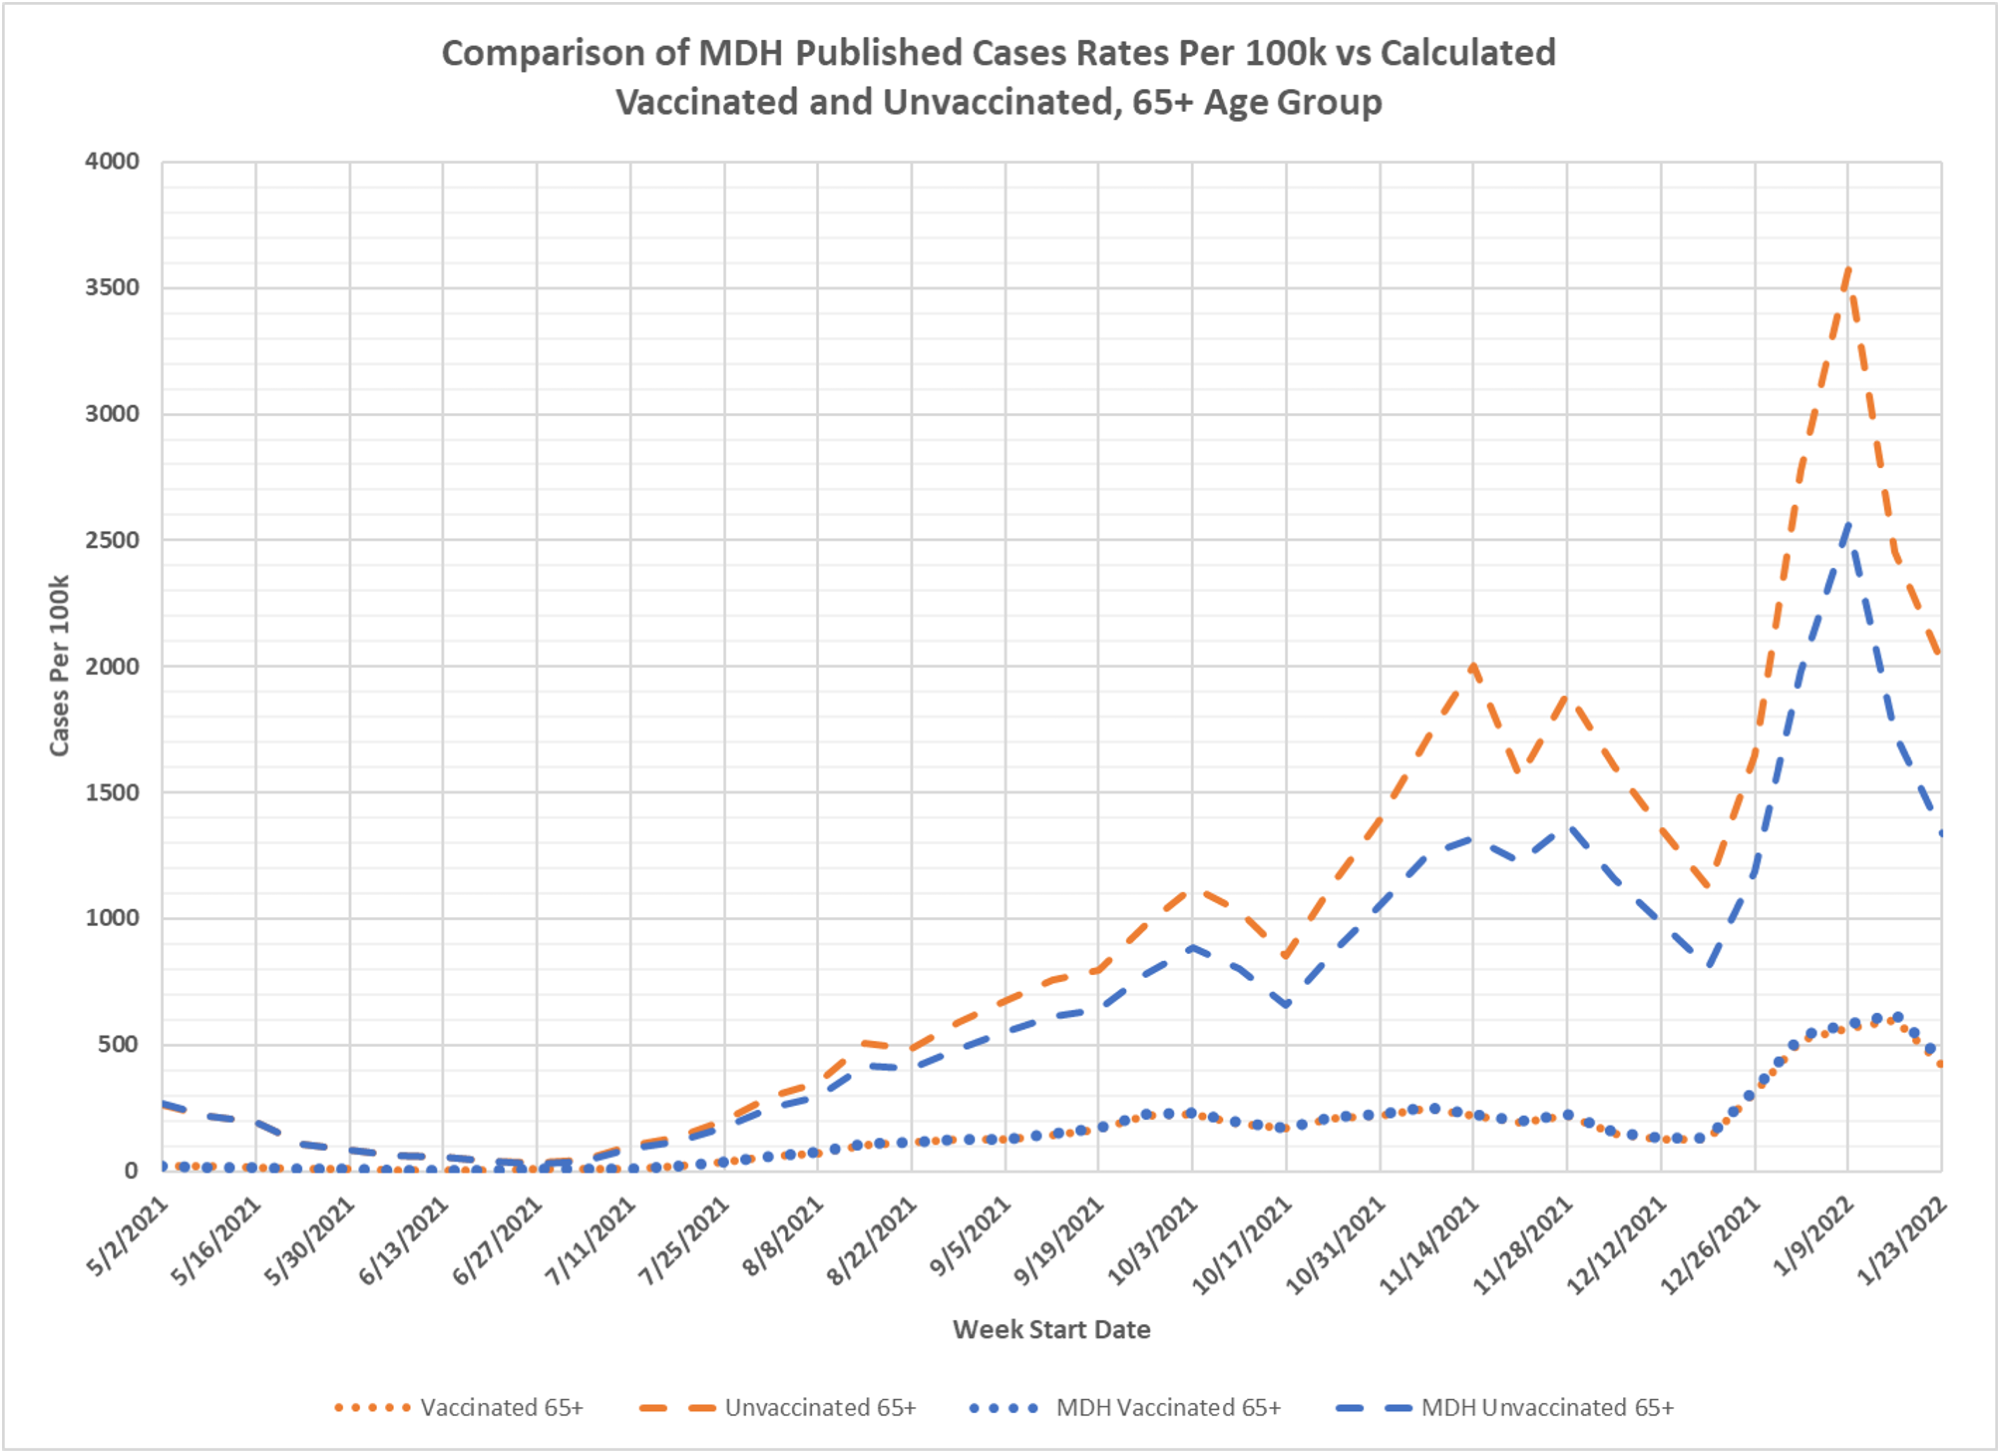
- We performed the same analysis for the 65+ age group, shown in the second chart, with MDH’s published per capita case rates in blue and our replicated per capita case rates in orange. We found that the unvaccinated per capita rate peaked at 3573 per 100k on 1/9/2022, while MDH’s published rate is 2563 per 100k. This difference will presumably be narrowed or eliminated when MDH publishes the next update, raising their published rate closer to our calculated rate. Note that for the 65+ there is almost no difference in per capita rates for the vaccinated, between our replicated rate (orange dots) and MDH’s published rate (blue dots). We speculate that this is because a very large proportion of the 65+ age group is vaccinated. A relatively small discrepancy in the number of people vaccinated will have no affect on the vaccinated per capita rates. However, this same small change in populations will have a very large effect on the per capita rate for the relatively small unvaccinated population size.
- Also note that the per capita case rates for the 65+ vaccinated population did not increase dramatically during the Omicron surge, unlike the 50-64 vaccinated age group. Is this because the 65+ age group is more likely to have received one or more booster shots? We have requested data on the age distribution of people receiving booster shots over time, but have not yet received anything.
- We should also note that other errors and discrepancies likely dwarf the 10% to 20% revisions in the unvaccinated per capita rates that MHD published on 2,28/2022. For example, we still do not know how many breakthrough cases are missed because MDH does not receive vaccination data from the Veterans Administration, tribal health agencies, or from other states except for states neighboring Minnesota. As the unvaccinated population sizes get smaller as more and more people get vaccinated these missed vaccinations have a larger and larger effect on the unvaccinated per capita case rates. MDH claims that they try to ascertain the vaccination status of positive cases during contact tracing interviews, but the sheer number of cases during Omicron likely meant a very small percentage of people were actually interviewed. The effect of missed breakthroughs is to exaggerate the relative risk of the unvaccinated compared to the vaccinated.