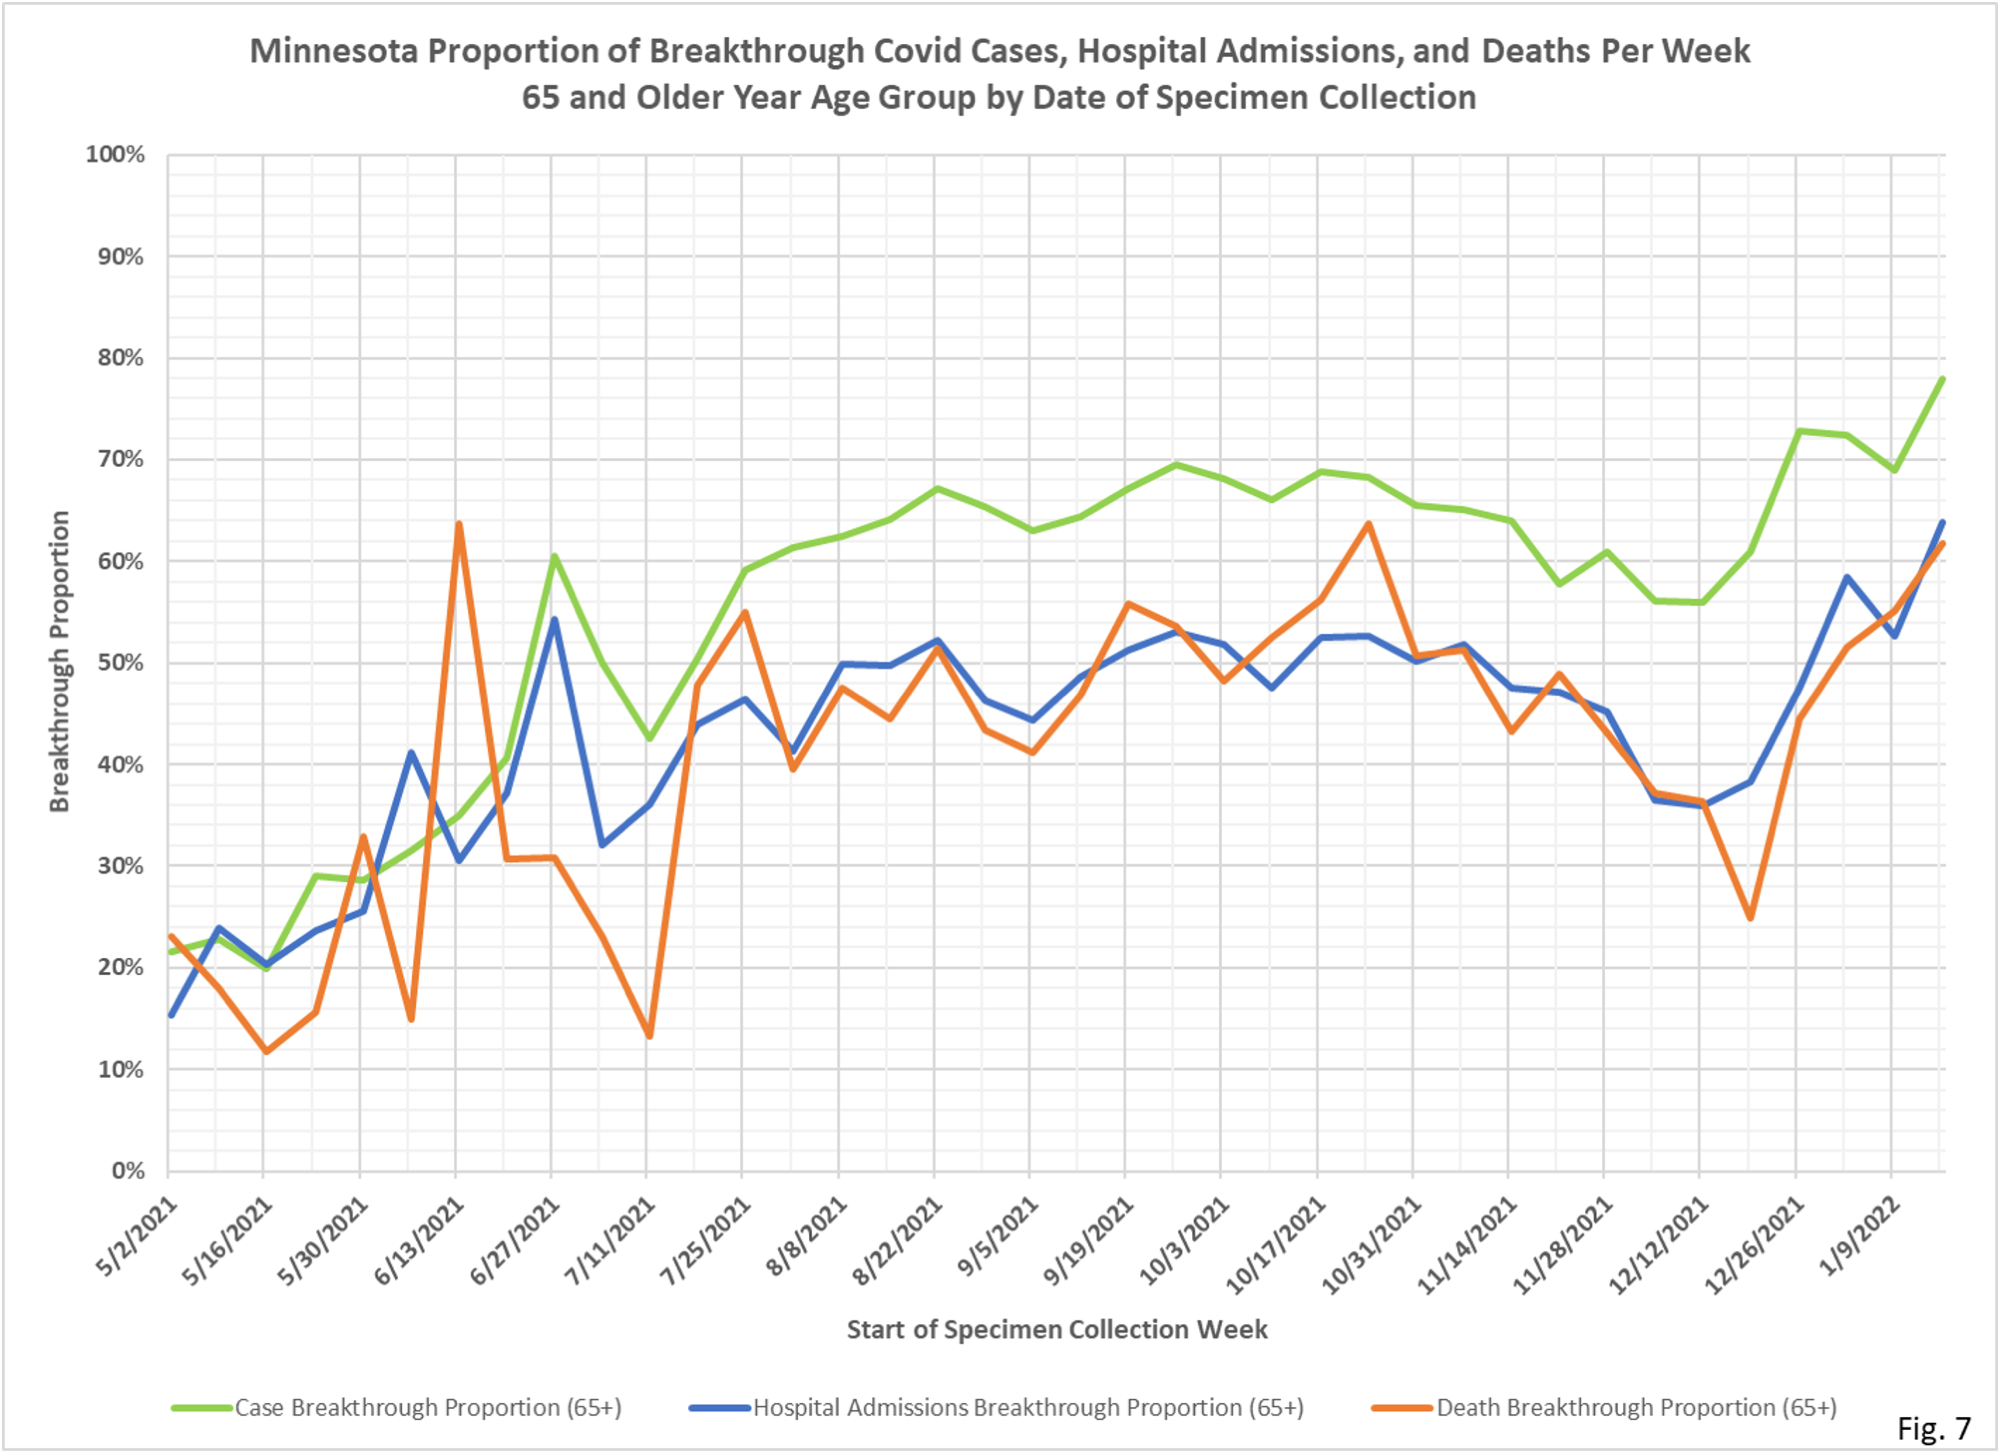
A couple of things I will mention before Dave’s notes. One is that you see falling breakthru events as all events are crashing. The second is that we have a total of about 361,000 breakthru cases, with a lag and an undercount. People have only been able to get vaxed for a little over a year. But 27% of all reported cases in Minnesota, including a long period when people couldn’t get vaxed, are now in the fully vaxed. And here is another interesting milestone. About 62% of all Minnesotans over the age of 5 are considered fully vaxed. That is an undercount. 65% of all cases reported in the latest week were in the vaxed, again with a long lag. So I am telling you it is not possible that the per capita rates in the vaxed are much different from those in the unvaxed. Now what can be different is rates of prior infection that may provide better protection, but the state doesn’t release that data. All age groups had over 50% of cases in the fully vaxed. In the oldest age group, almost 80% of cases and over 60% of hospitalizations and deaths, as of the week of January 16, were in the fully vaxed. Again, you can do the math.
On to Dave’s notes:
- The table and charts are updated for new data released by Minnesota Department of Health (MDH) on 2/22/2022, adding data for the week starting 1/16/2022 and ending 1/22/2022. This time period starts just after the peak of the Omicron case surge in Minnesota, which occurred on 1/10/2022.
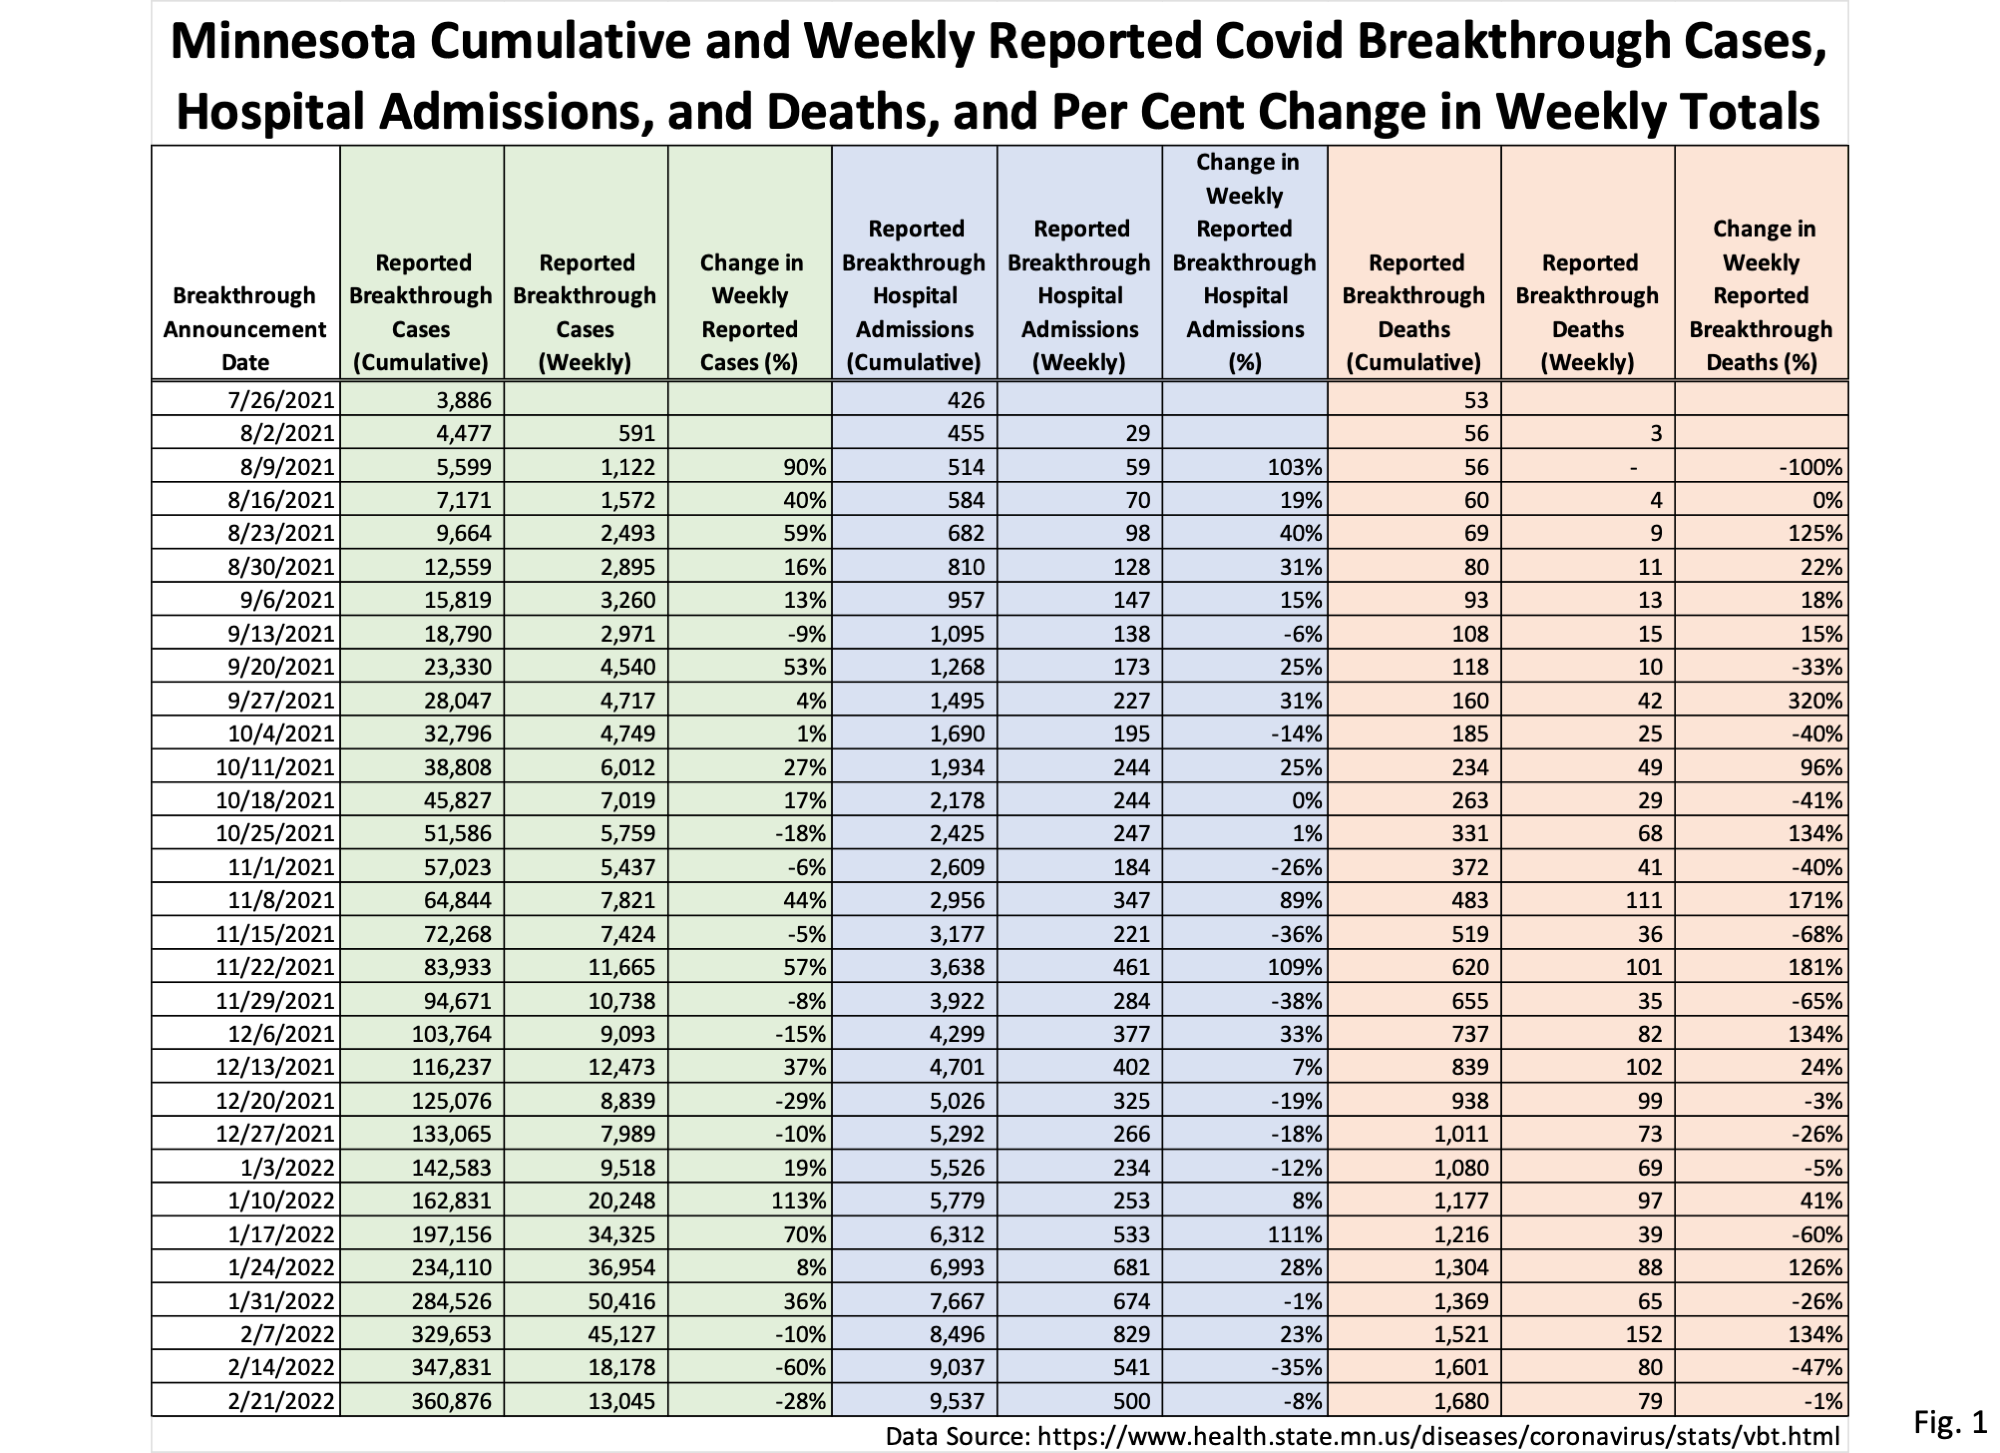
- The data source for the data on Fig. 1 is the cumulative breakthrough cases, hospitalizations, and deaths published on the MDH COVID-19 Vaccine Breakthrough Weekly Update https://www.health.state.mn.us/diseases/coronavirus/stats/vbt.html
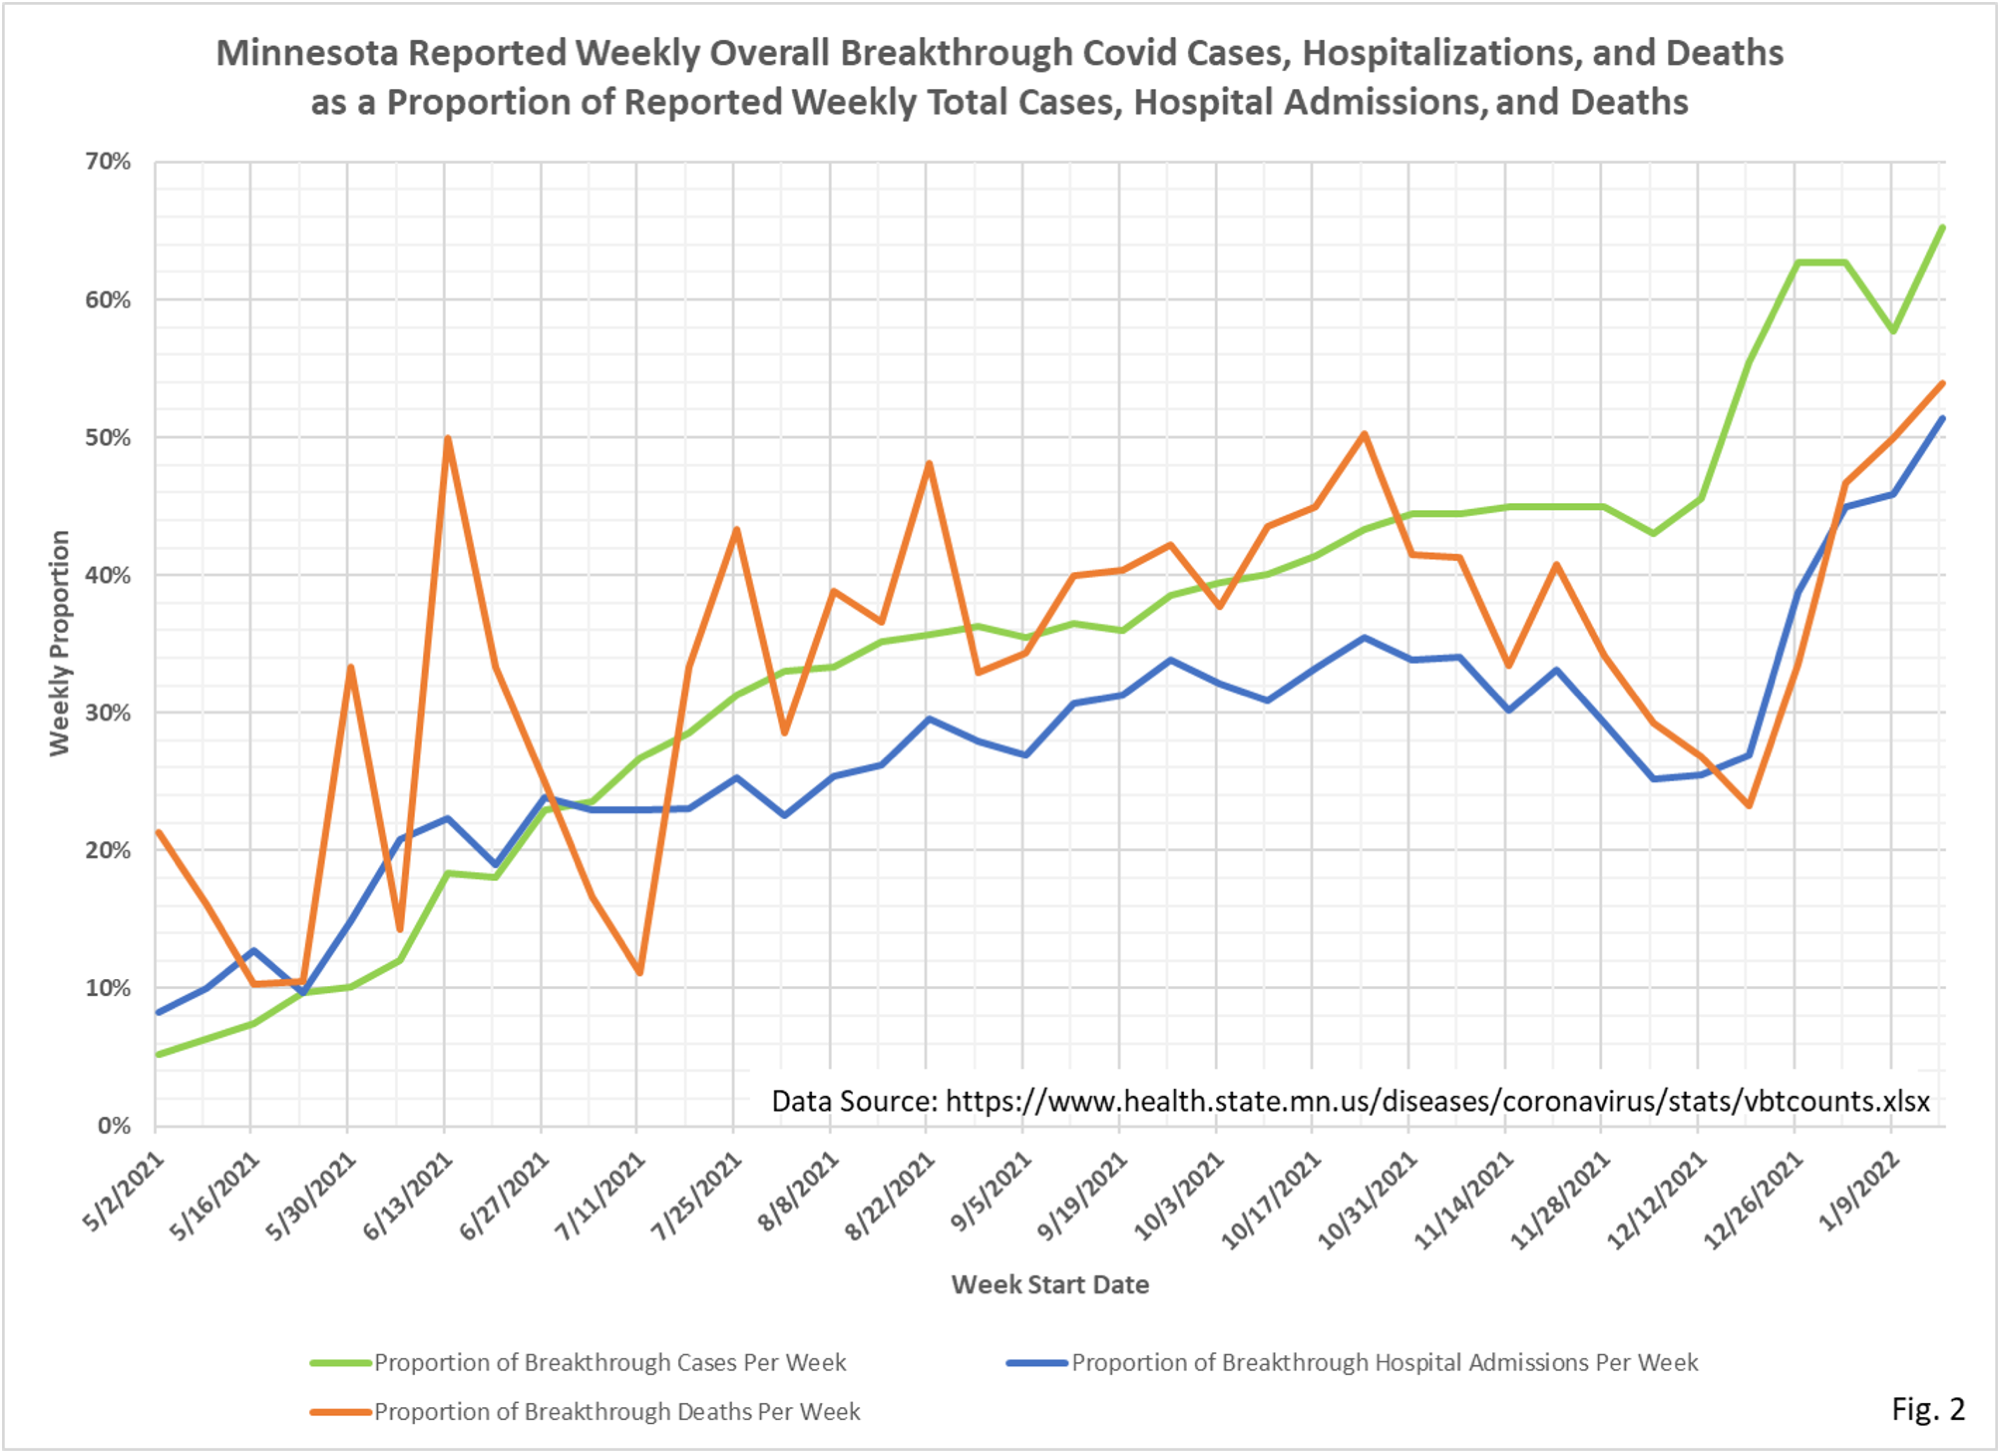
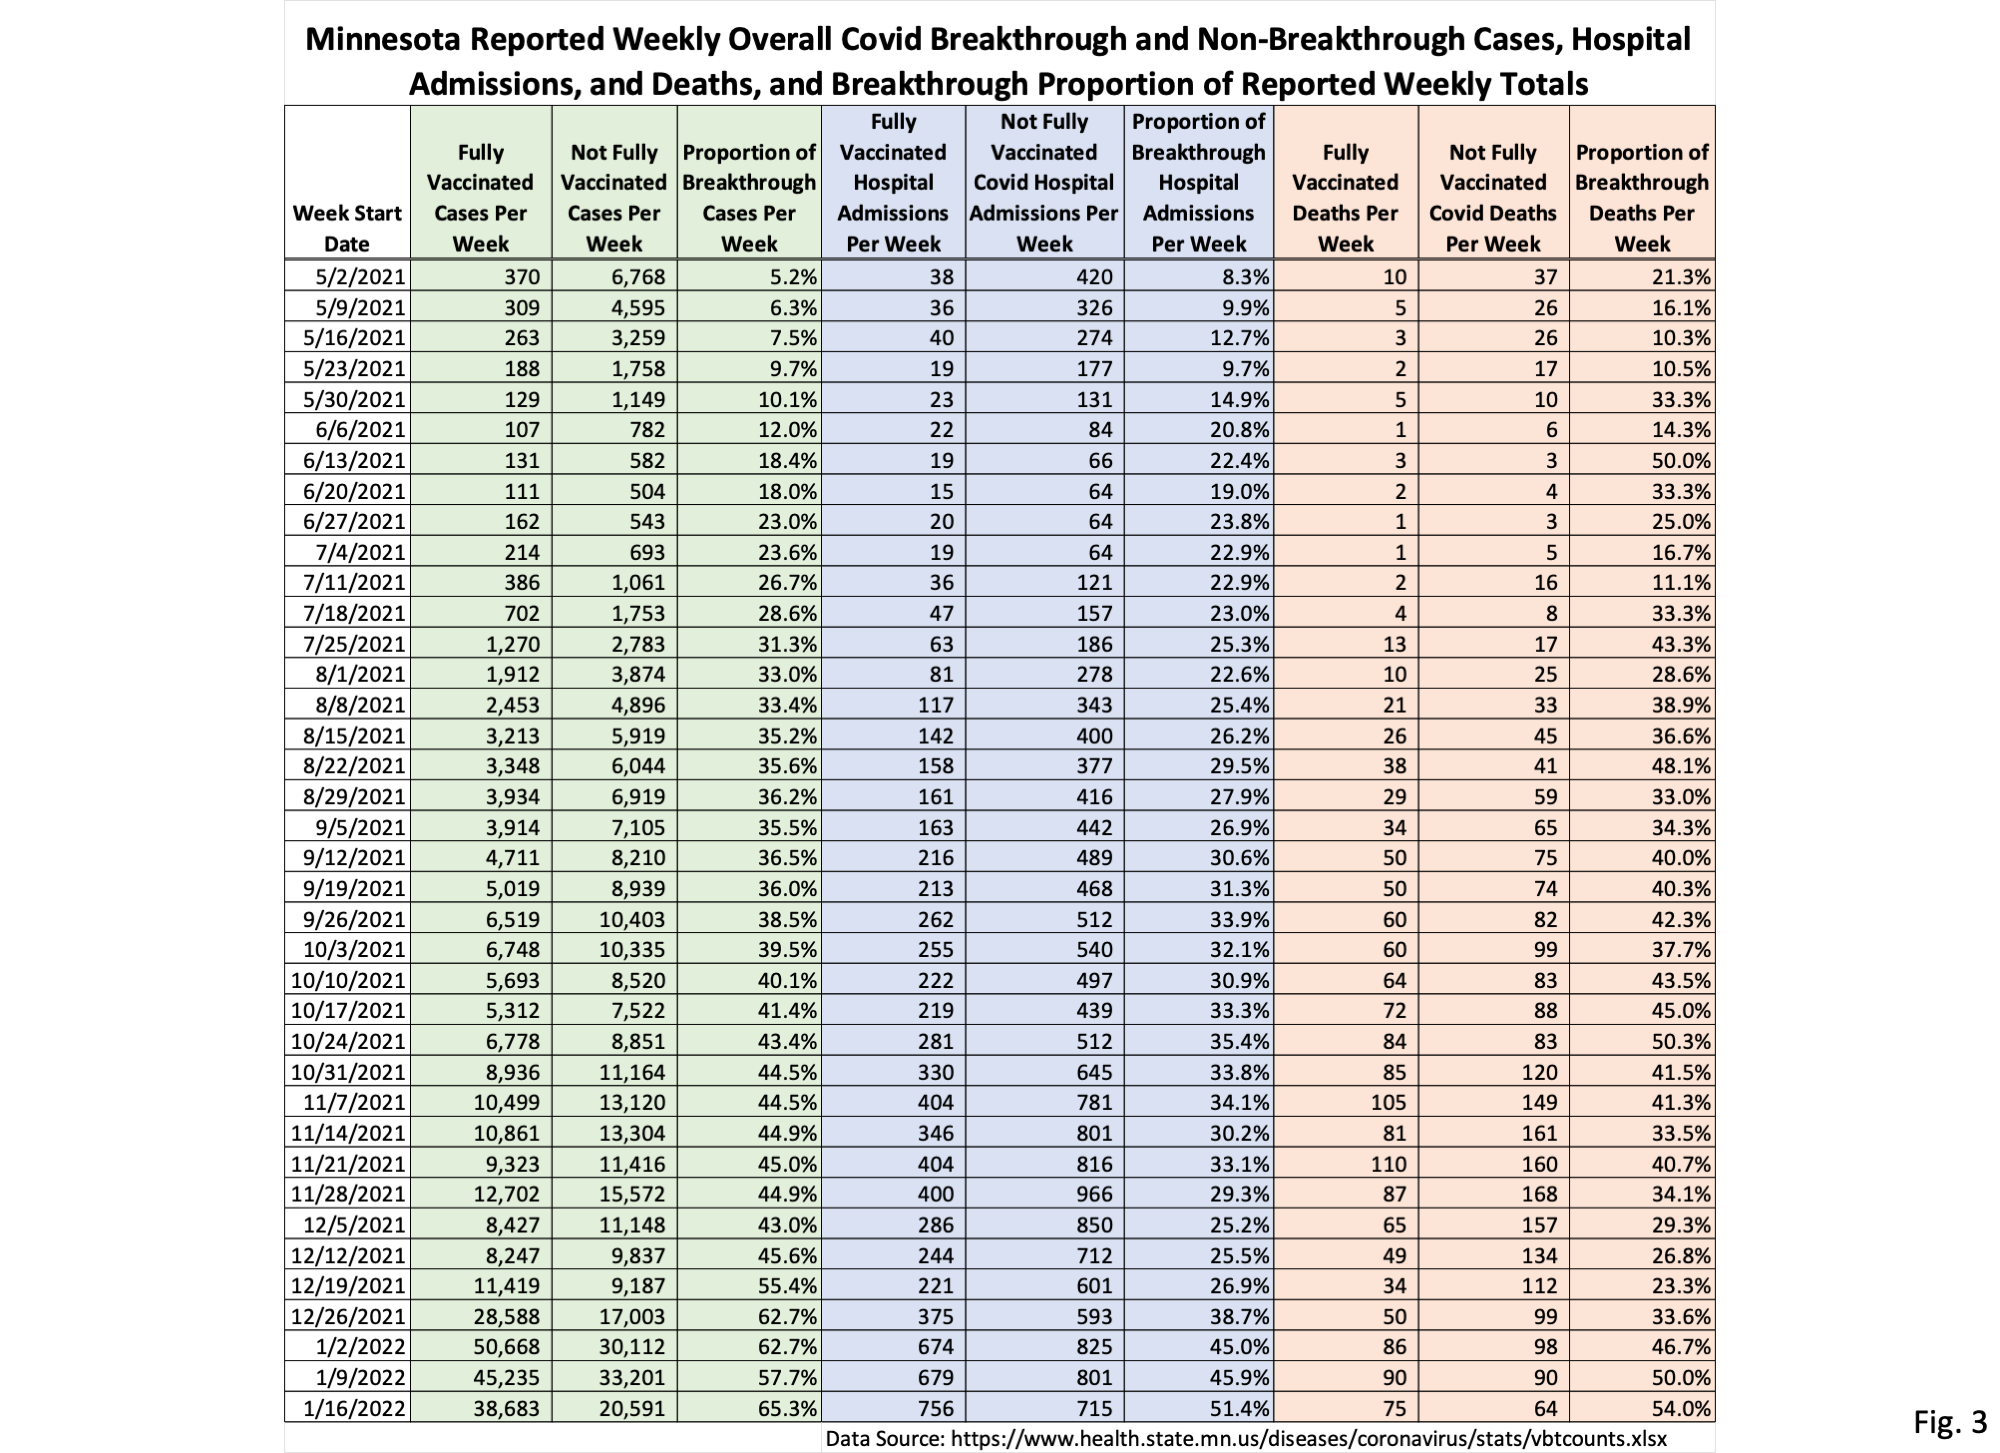
- The data source for Fig. 2 and Fig. 3 is the data file https://www.health.state.mn.us/diseases/coronavirus/stats/vbtcounts.xlsx found on MDH web page https://www.health.state.mn.us/diseases/coronavirus/stats/vbt.html. The data provided in the data file vbtcounts.xlsx is used without modification, other than to sum the weekly events and compute the breakthrough proportion. Vbtcounts.xlsx provides breakthrough and non-breakthrough cases, hospital admissions, and deaths for each week listed.
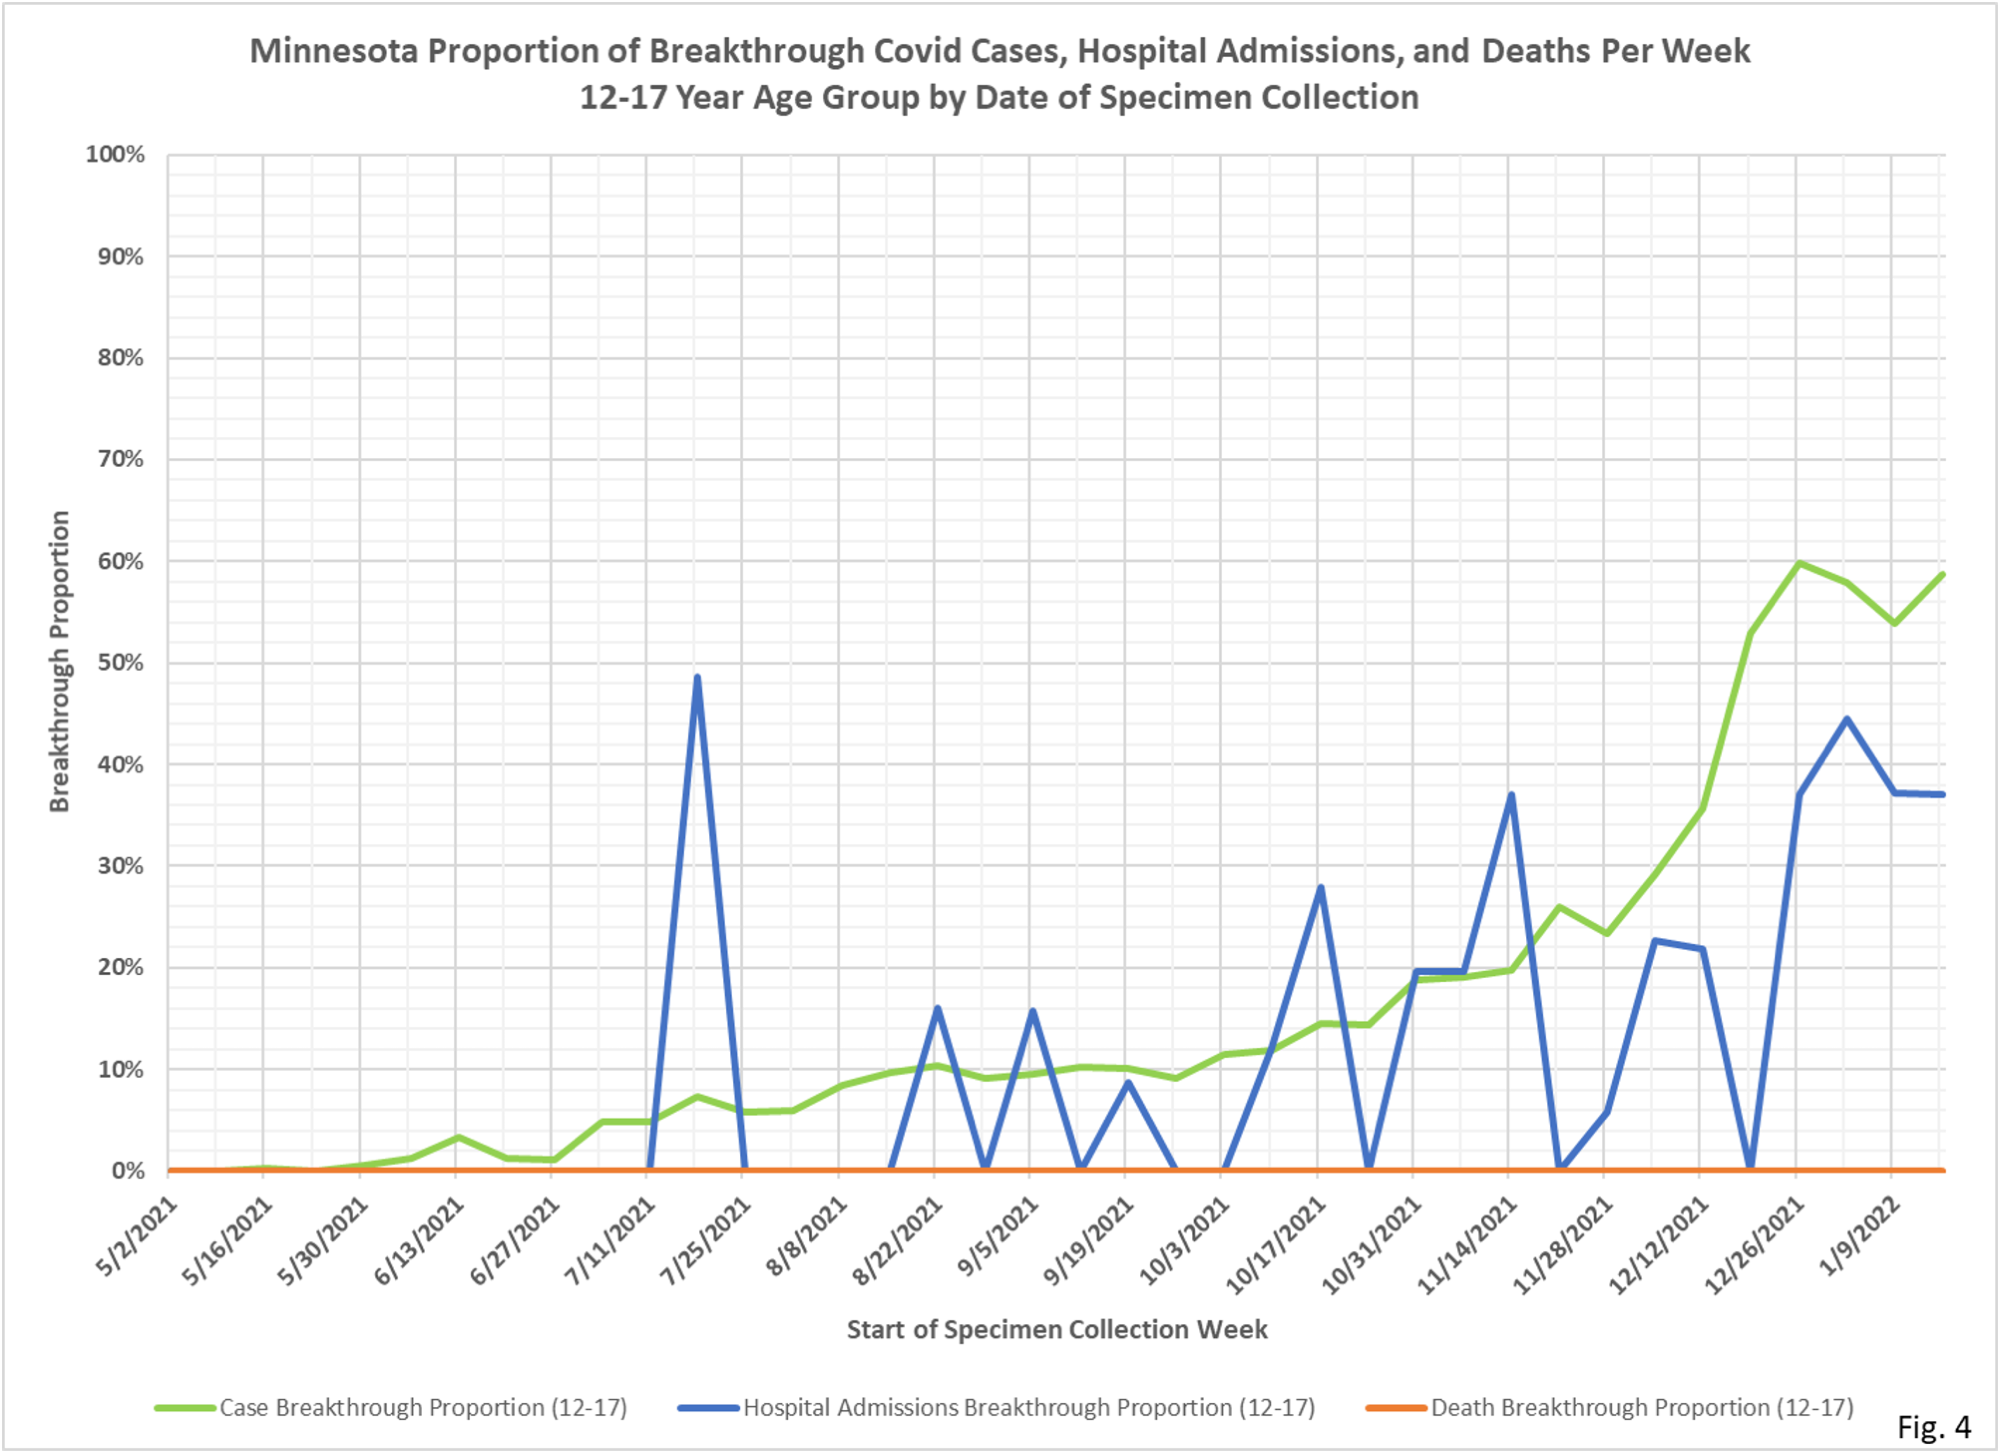
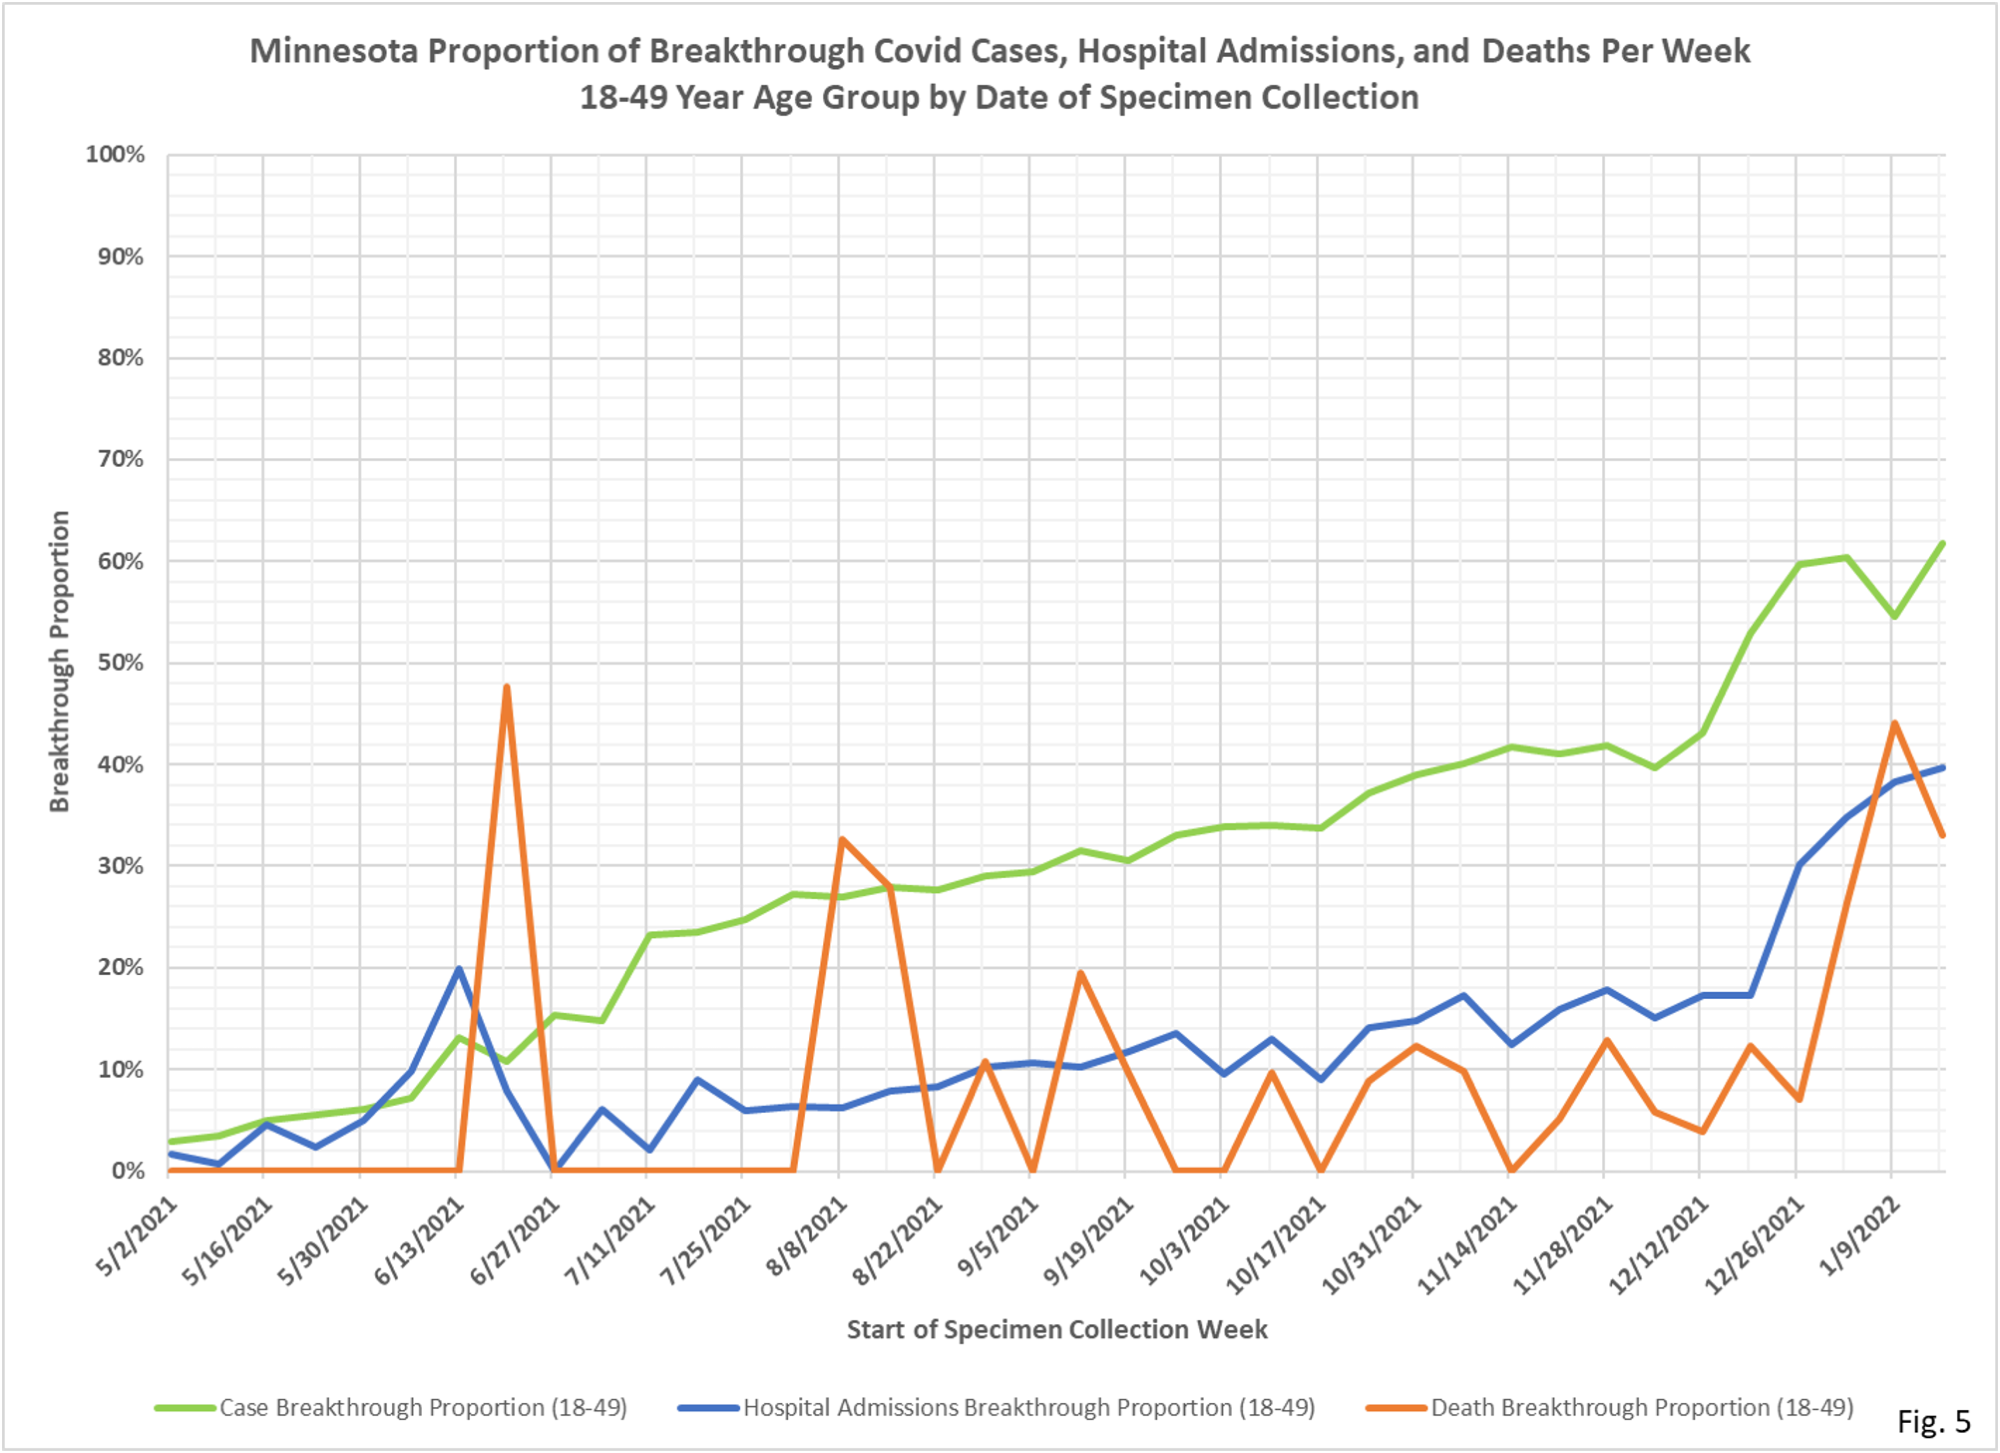
- The data source for the breakthrough proportions by age group (Fig. 4 through Fig. 7) is the data file vbtcirates.xlsx, found on the Minnesota Department of Health (MDH) web page: https://www.health.state.mn.us/diseases/coronavirus/stats/vbtcirates.xlsx . This data file gives the rates per 100k of cases, hospitalizations, and deaths in full vaccinated and not fully vaccinated people, broken out by age group. The rates per 100k in vbtcirates.xlsx are converted into cases, hospitalizations, and deaths by multiplying by the appropriate population. The number of vaccinated people by age group can found on the Vaccine Data page, https://mn.gov/covid19/vaccine/data/index.jsp , in the data file People Vaccinated by Age. The unvaccinated population is found by taking the US Census American Community Survey 5-Year Estimate (Data Table S0101, https://data.census.gov/cedsci/table) and subtracting the vaccinated population. The breakthrough proportion is then found by dividing the breakthrough events by the total of the breakthrough and non-breakthrough weekly events.
- MDH defines a breakthrough event as a Covid case, hospital admission, or death that occurs 14 or more days after completing the vaccination series (not including boosters).
- Fig 1: This table is the weekly announced cumulative breakthrough cases, hospital admissions, and deaths, as well as the weekly totals, and change in weekly totals. New breakthrough cases announced on 2/22/2022 total just 13,045. This number seems low given the overall testing and case level that has been reported for that time period. It seems likely that the recent backlog in cases, and the longer lag time in reporting cases, is causing a corresponding lag in reporting breakthrough cases as well. See our post here https://healthy-skeptic.com/2022/02/11/event-processing-lags/ for information about the increasing lag in reporting cases in recent weeks.
- Fig. 2 and Fig. 3, Overall Breakthrough Proportions: The overall proportion of breakthrough cases for the week starting 1/16/2022 was a new record high of 65.3%. The proportion of breakthrough hospitalizations also rose to a new record of 51.4% of all hospitalizations, while breakthrough deaths rose to another new record of 55.0% of the total weekly deaths. These percentages will only be revised higher as new breakthrough cases are identified as the backlog of cases is processed.
- Fig. 4 through Fig. 7: Breakthrough Proportions by Age Group: The breakthrough proportion of cases are generally trending in all age groups for the week starting 1/16/2022. It is quite clear that the older the age group the greater the proportion of breakthrough cases, hospitalizations, and deaths.


Thanks for the thankless job you and Dave do. I note that while you’re trying to take a couple days off, Scotland has announced that it’s going to stop reporting data because it might be misinterpreted or lead to misinformation or something, and the CDC has revealed that it has a lot of data that it’s not allowing the public to see. This is beginning to make Alex Berenson look reasonable. Thanks again!
Just a note: I think you meant to compare vaxed to non-vaxed in this statement in your post. Oddly enough, it still is logically correct as written.
“So I am telling you it is not possible that the per capita rates in the vaxed are much different from those in the vaxed. “