The recent difficulties of DOH in keeping up with processing of CV-19 events made Dave Dixon and I think it might be timely to publish and updated analysis of the typical reporting lags for these events. Dave’s notes:
1. In recent weeks the Minnesota Department of Health (MDH) has noted that the high volumes of laboratory test reports was leading a backlog of reports awaiting review by MDH. Although not stated by MDH, this has increased the length of time that passes from the date of specimen collection of a positive test, or hospital admission, or date of death, until being reported in the MDH Situation Update for COVID-19 web page: https://www.health.state.mn.
2. MDH publishes, for each date, the numbers of PCR tests, antigen tests, PCR cases, antigen cases, PCR reinfection cases, antigen reinfection cases, hospital admissions, and deaths by date of event. As past events are identified the totals for these past dates are updated. By comparing the totals of a date, as published from one day to the next, we can identify each day how many tests, cases, admissions, or deaths were added to which dates back in time. From the series of added events we can then determine the average number of calendar days MDH required to publish the new events each day.
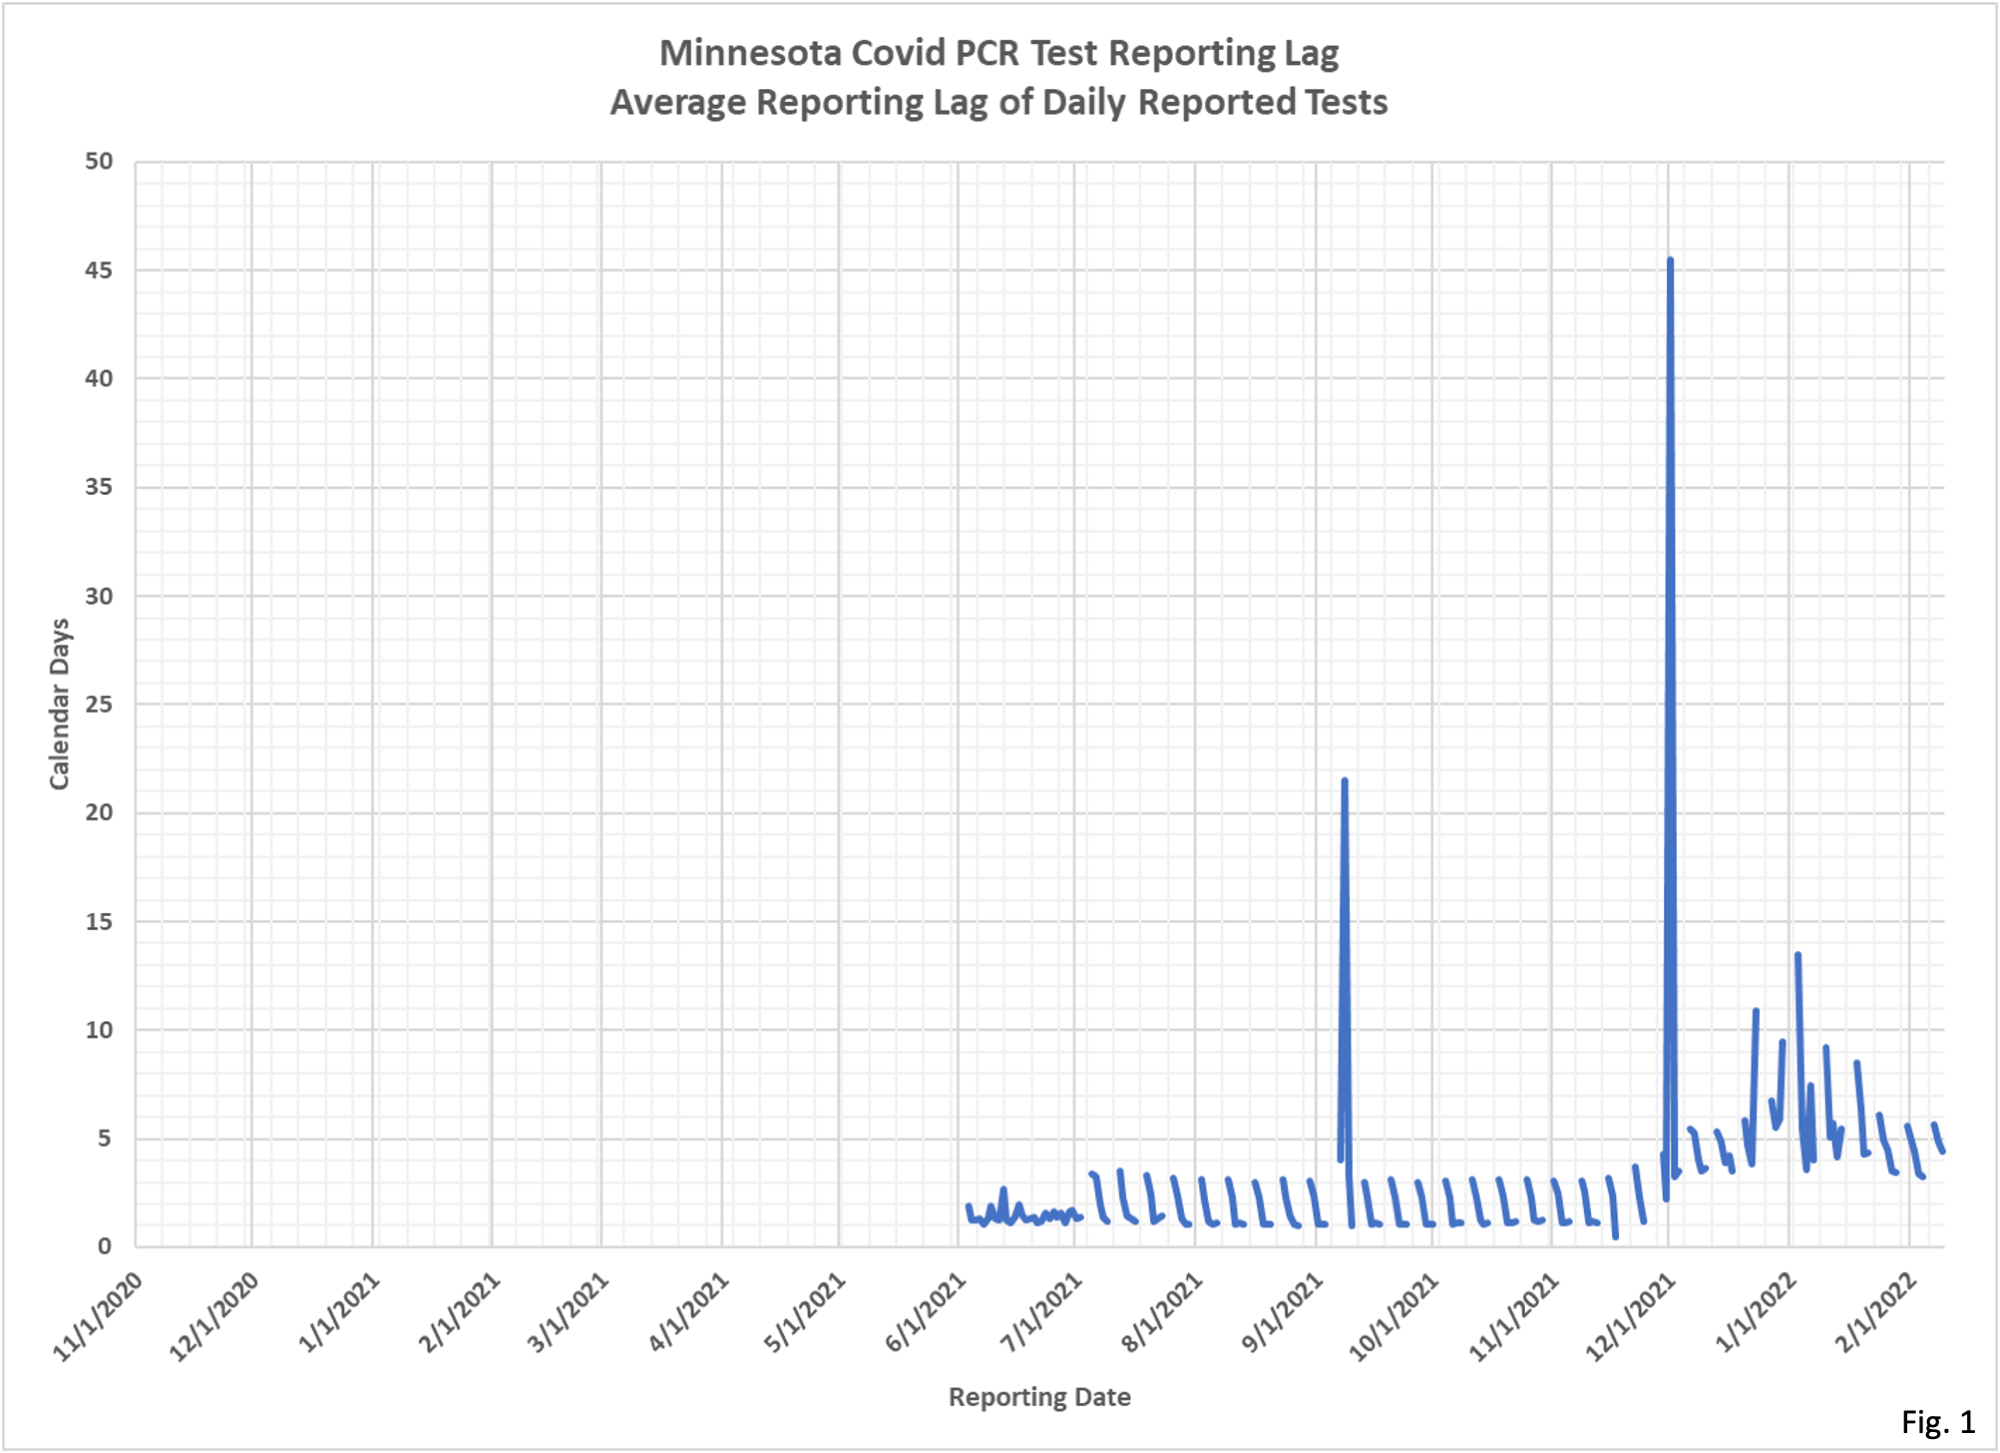
3. Fig. 1 displays the average number of calendar day reporting lag for the PCR tests that MDH reported each day. Note that these are reported tests, not reported positive cases. All 8 charts start on 11/1/2021, matching the data charted for PCR cases, the longest time series in this set of charts. We can see that prior to 7/1/2021 MDH reported new data 7 days a week. Starting 7/1/2021 MDH only reports data on weekdays, causing gaps in the data on weekends. Each Monday the reporting lag tends to be longer than for the other days of the week, because the data sits unreported over the weekend. As the week goes on, data from the same week starts to get reported, which shortens the average reporting lag.
4. Two tall spikes can be seen in Fig.1, on 9/08/2021 and 12/01/2021. On these dates MDH reported many tests which had occurred much earlier than typical reports, an average of 21.5 calendar days earlier on 9/08/2021, 45.5 calendar days on 12/01/2021. Similar spikes can be seen in the other charts as well.
5. Also seen in Fig. 1 is that leading up to the 12/01/2021 reporting spike the reporting lag time was starting to increase, increasing from a typical reporting lag of 1 to 3 days on average to what appears to be a new typical average reporting lag of 4 to 6 days, with even longer average reporting lags around the end of 2021.
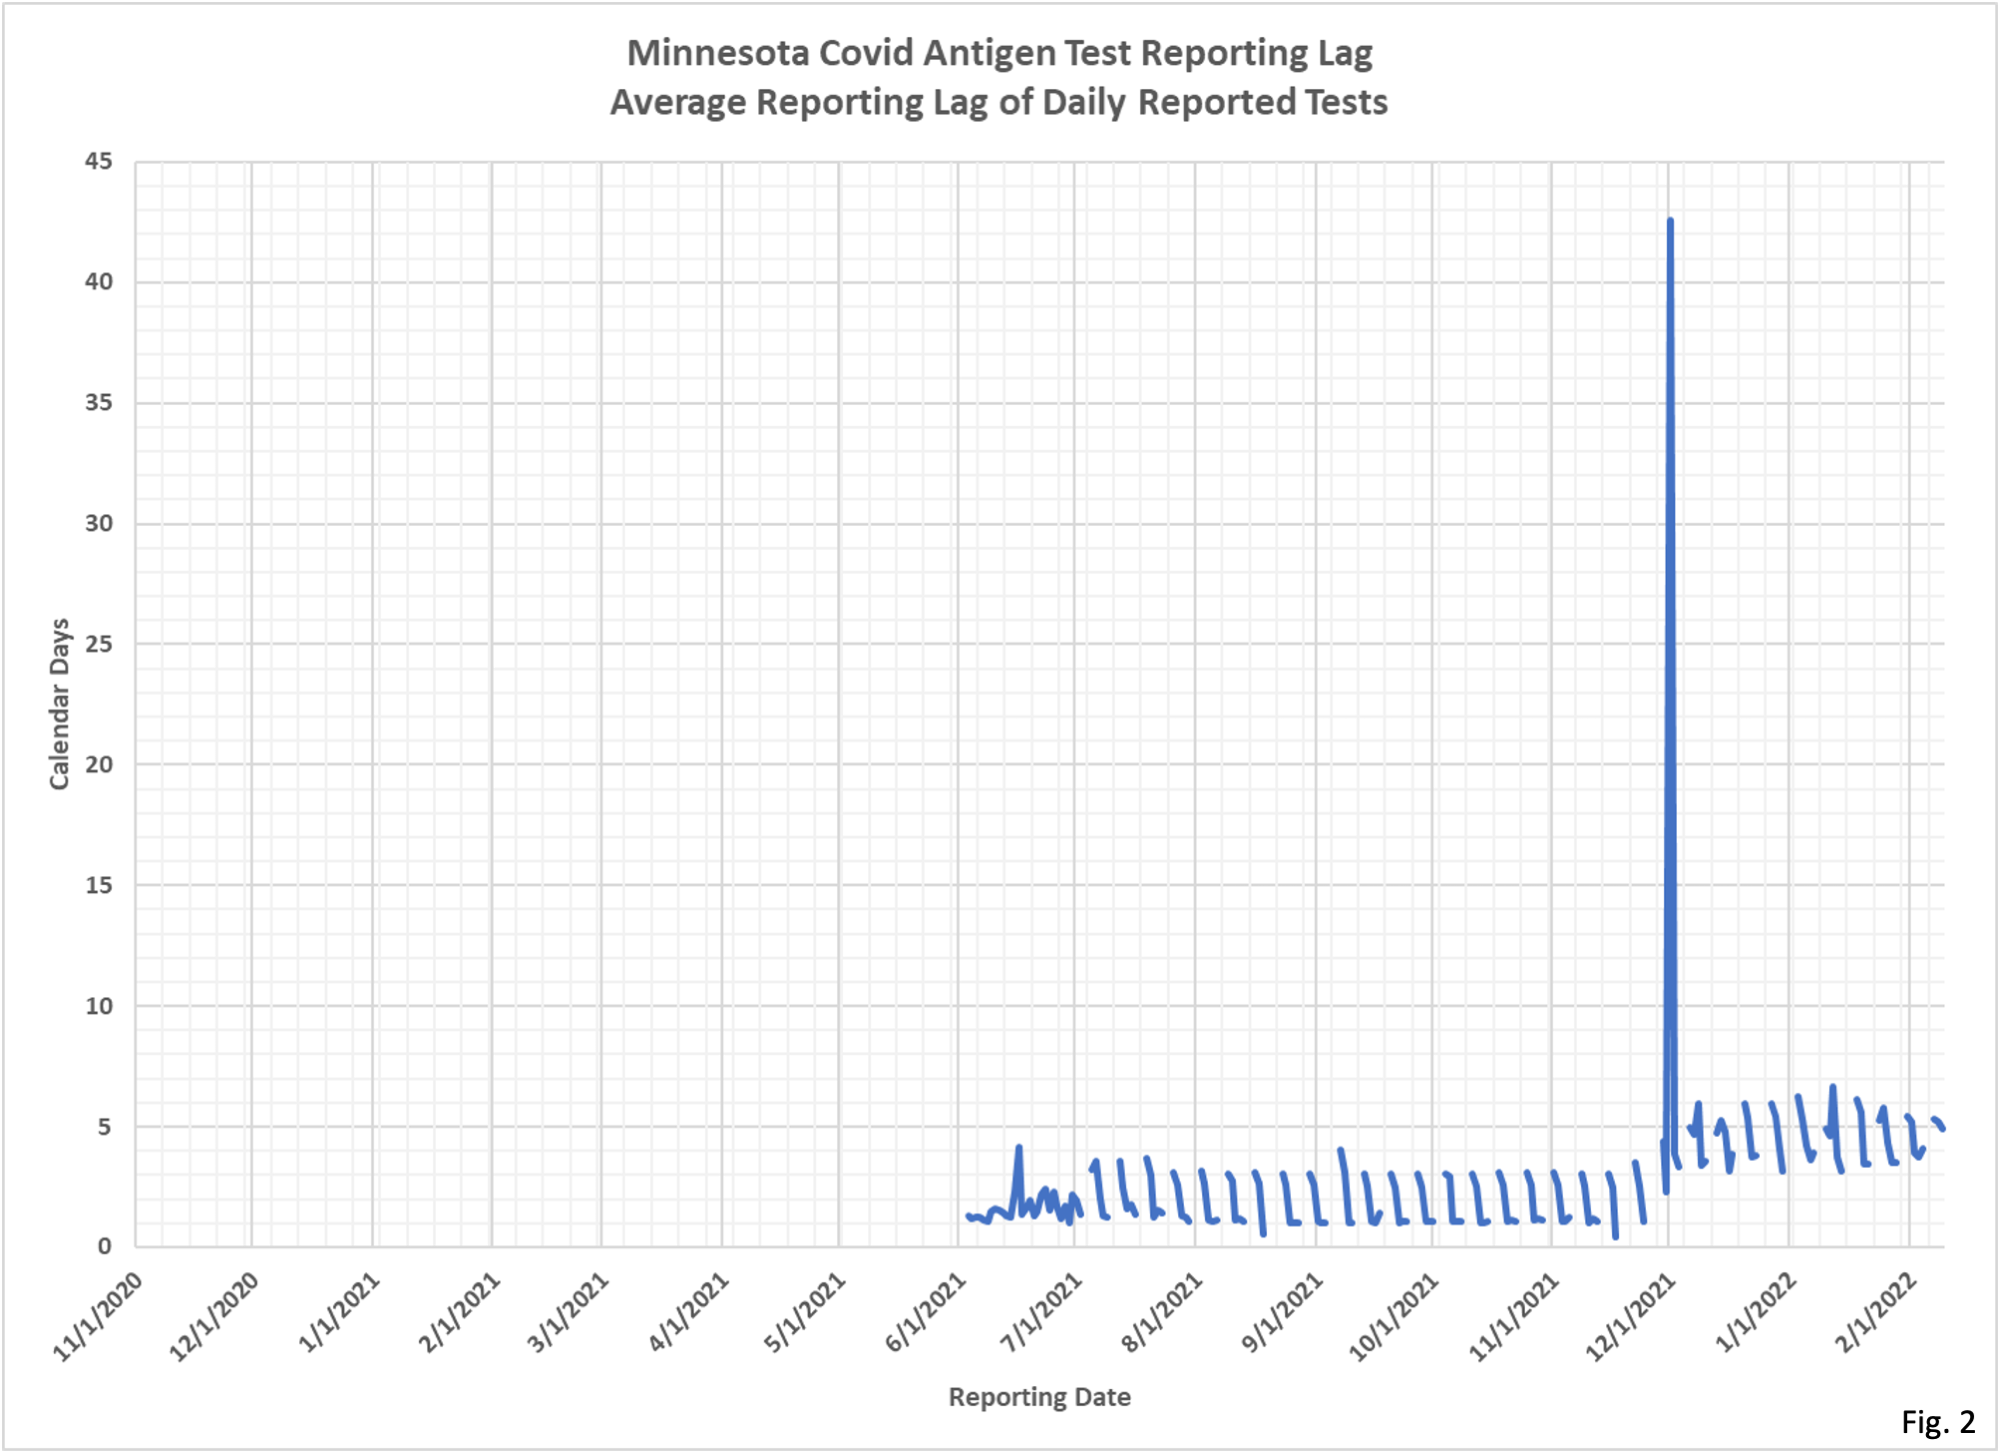
6. Fig. 2 displays the average reporting lag for antigen tests. Some of the same features as the PCR test reporting lag chart in Fig. 1 are visible, such as the characteristic weekly pattern after 7/1/2021, and a spike in average reporting lag on 12/02/2021. However, there is not spike in reporting time on 9/08/2021, and there is not major increase in average reporting lag at the end of 2021 as there is for PCR tests.
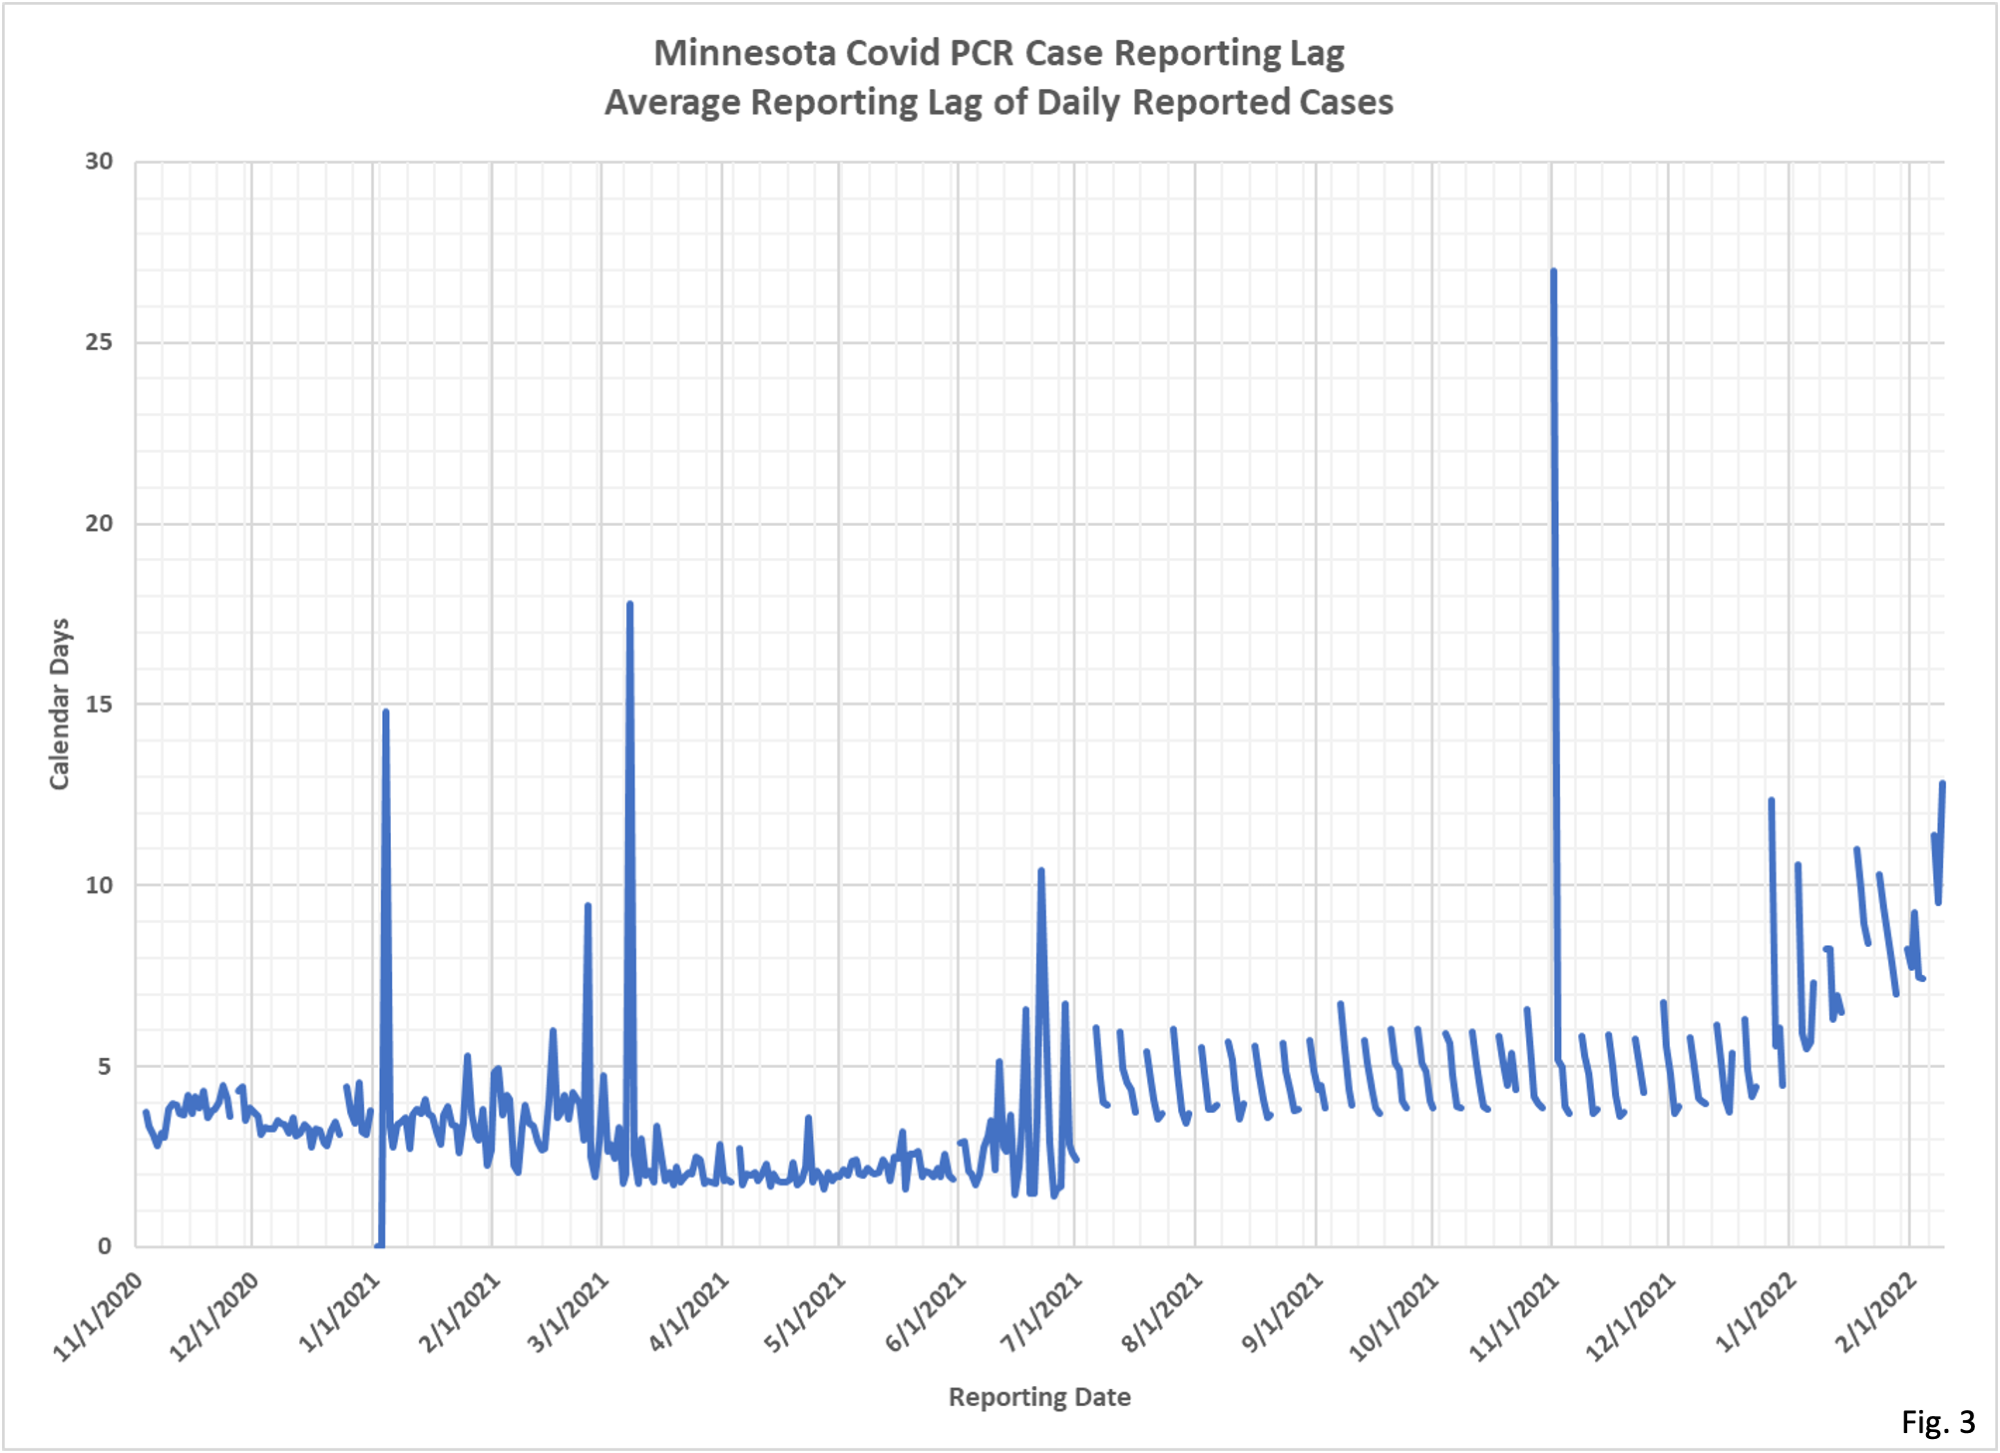
7. Fig. 3 displays the average reporting lag for daily reports of positive PCR Covid cases. This is the longest time series we have been tracking, with data 7 days a week from 11/1/2020 to 7/1/2021, except for holidays. The increase in average reporting lag on 7/1/2021 is significant, roughly doubling in time. In early 2022 we can see that average reporting lag time increases to between 6 and 12 days during the time period that MDH states they have an excessive backlog of reports to process. For the 3 days of data available so far for the week of 2/07/2022 the average reporting lag remains high, at 11.39 days, 9.54 days, and 12.82 days for the week, even though MDH no longer states that they have an excessive backlog of cases to process.
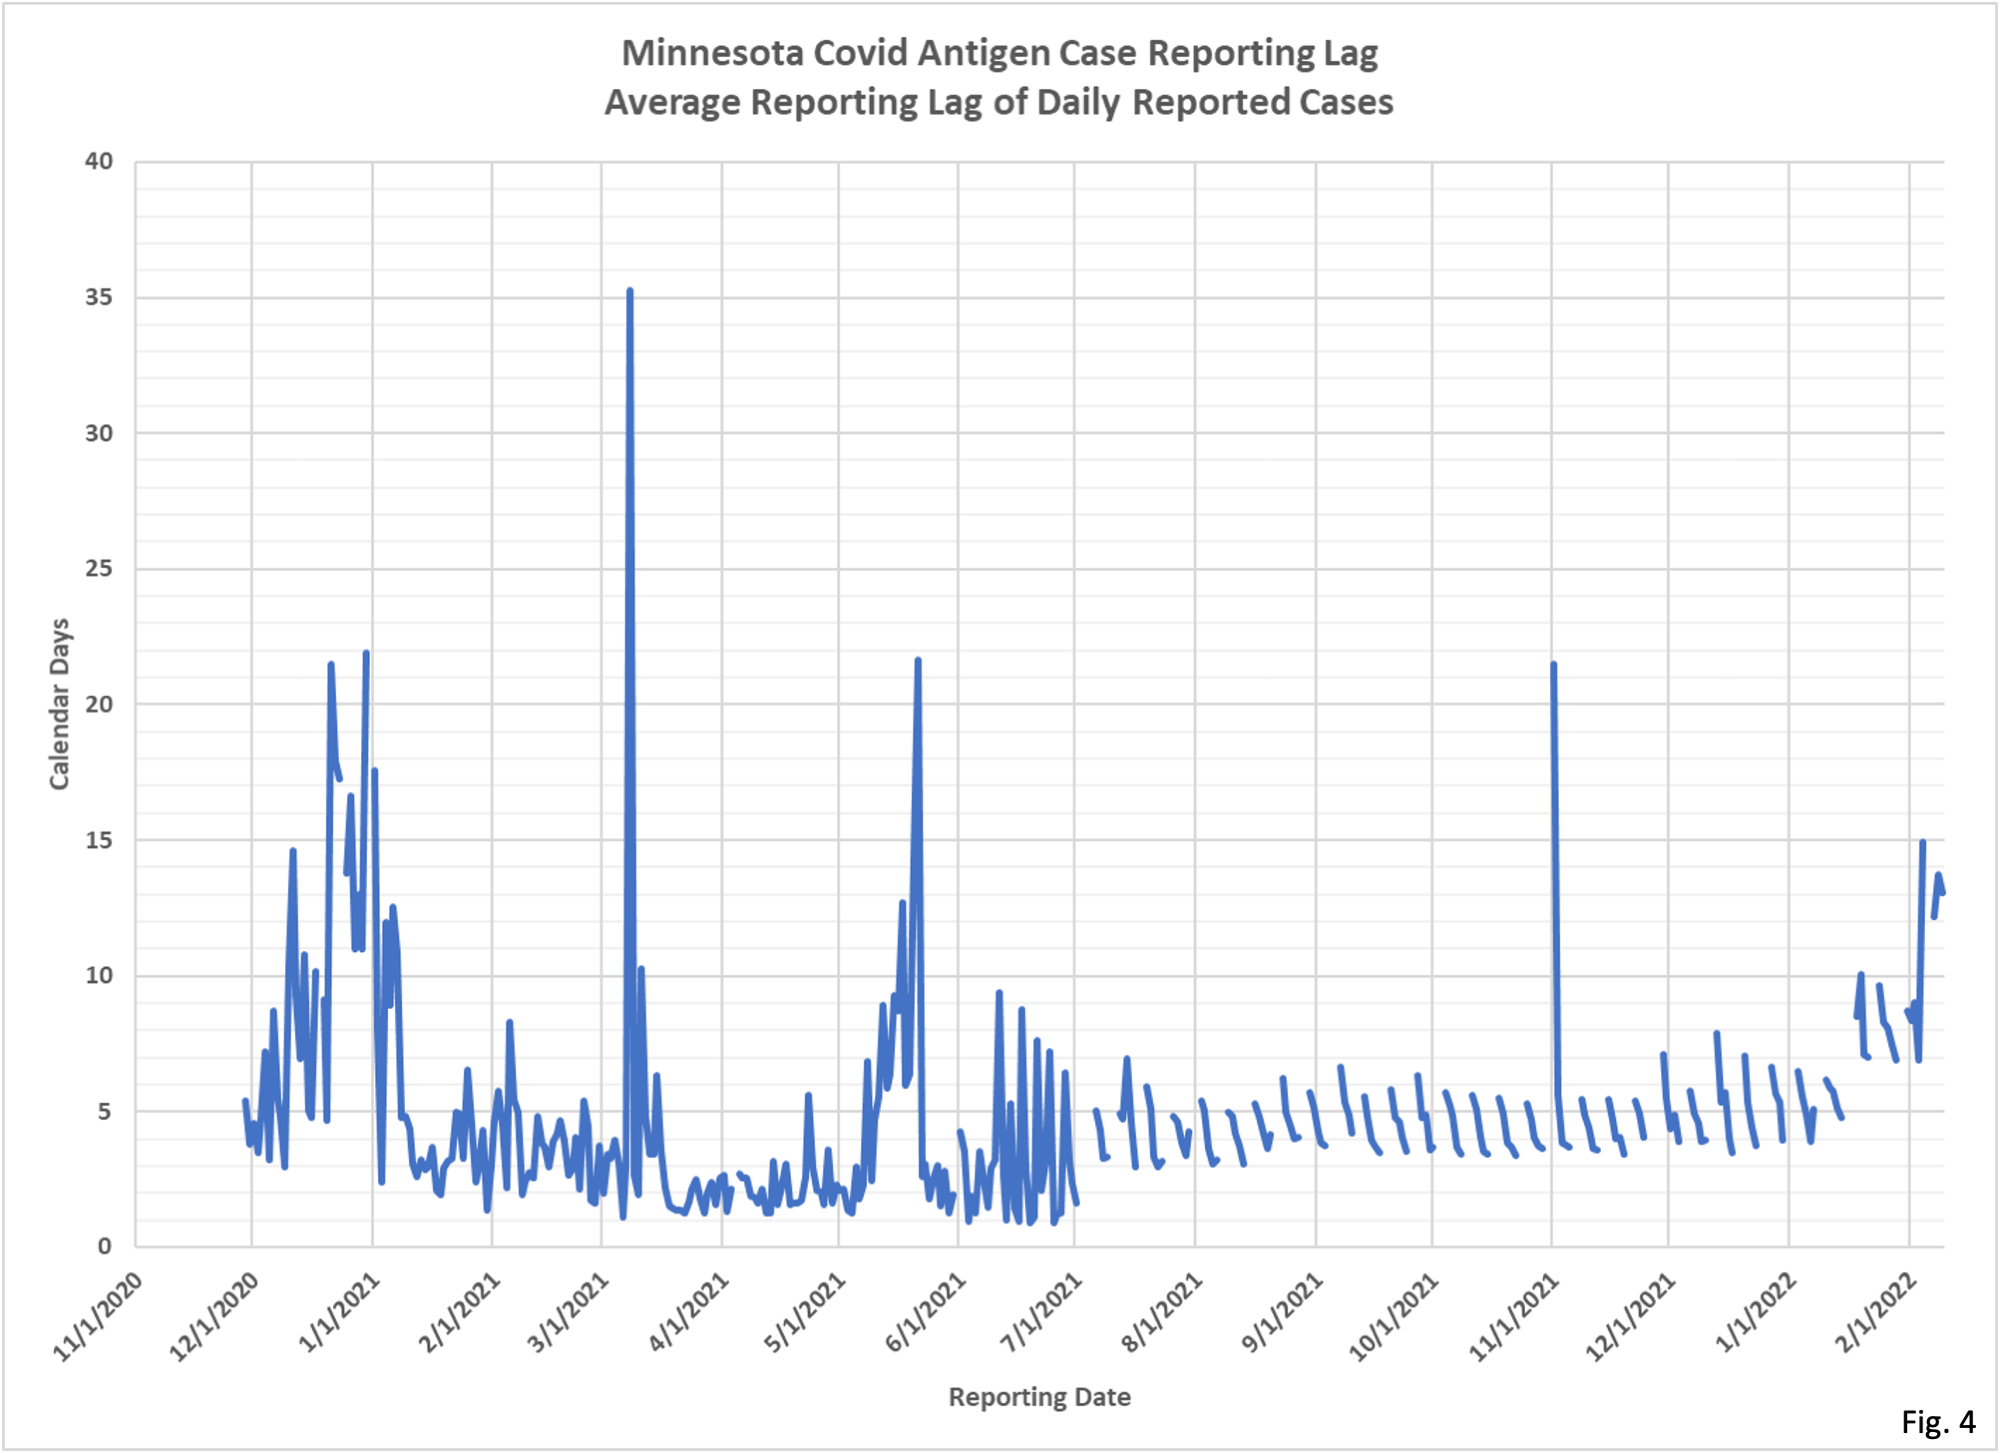
8. Fig. 4 displays the average reporting lag for positive antigen cases. Antigen case reporting is much more highly variable than PCR case reporting before 7/1/2021. After 7/01/2021 appears quite similar to PCR case reporting lags in Fig. 3.
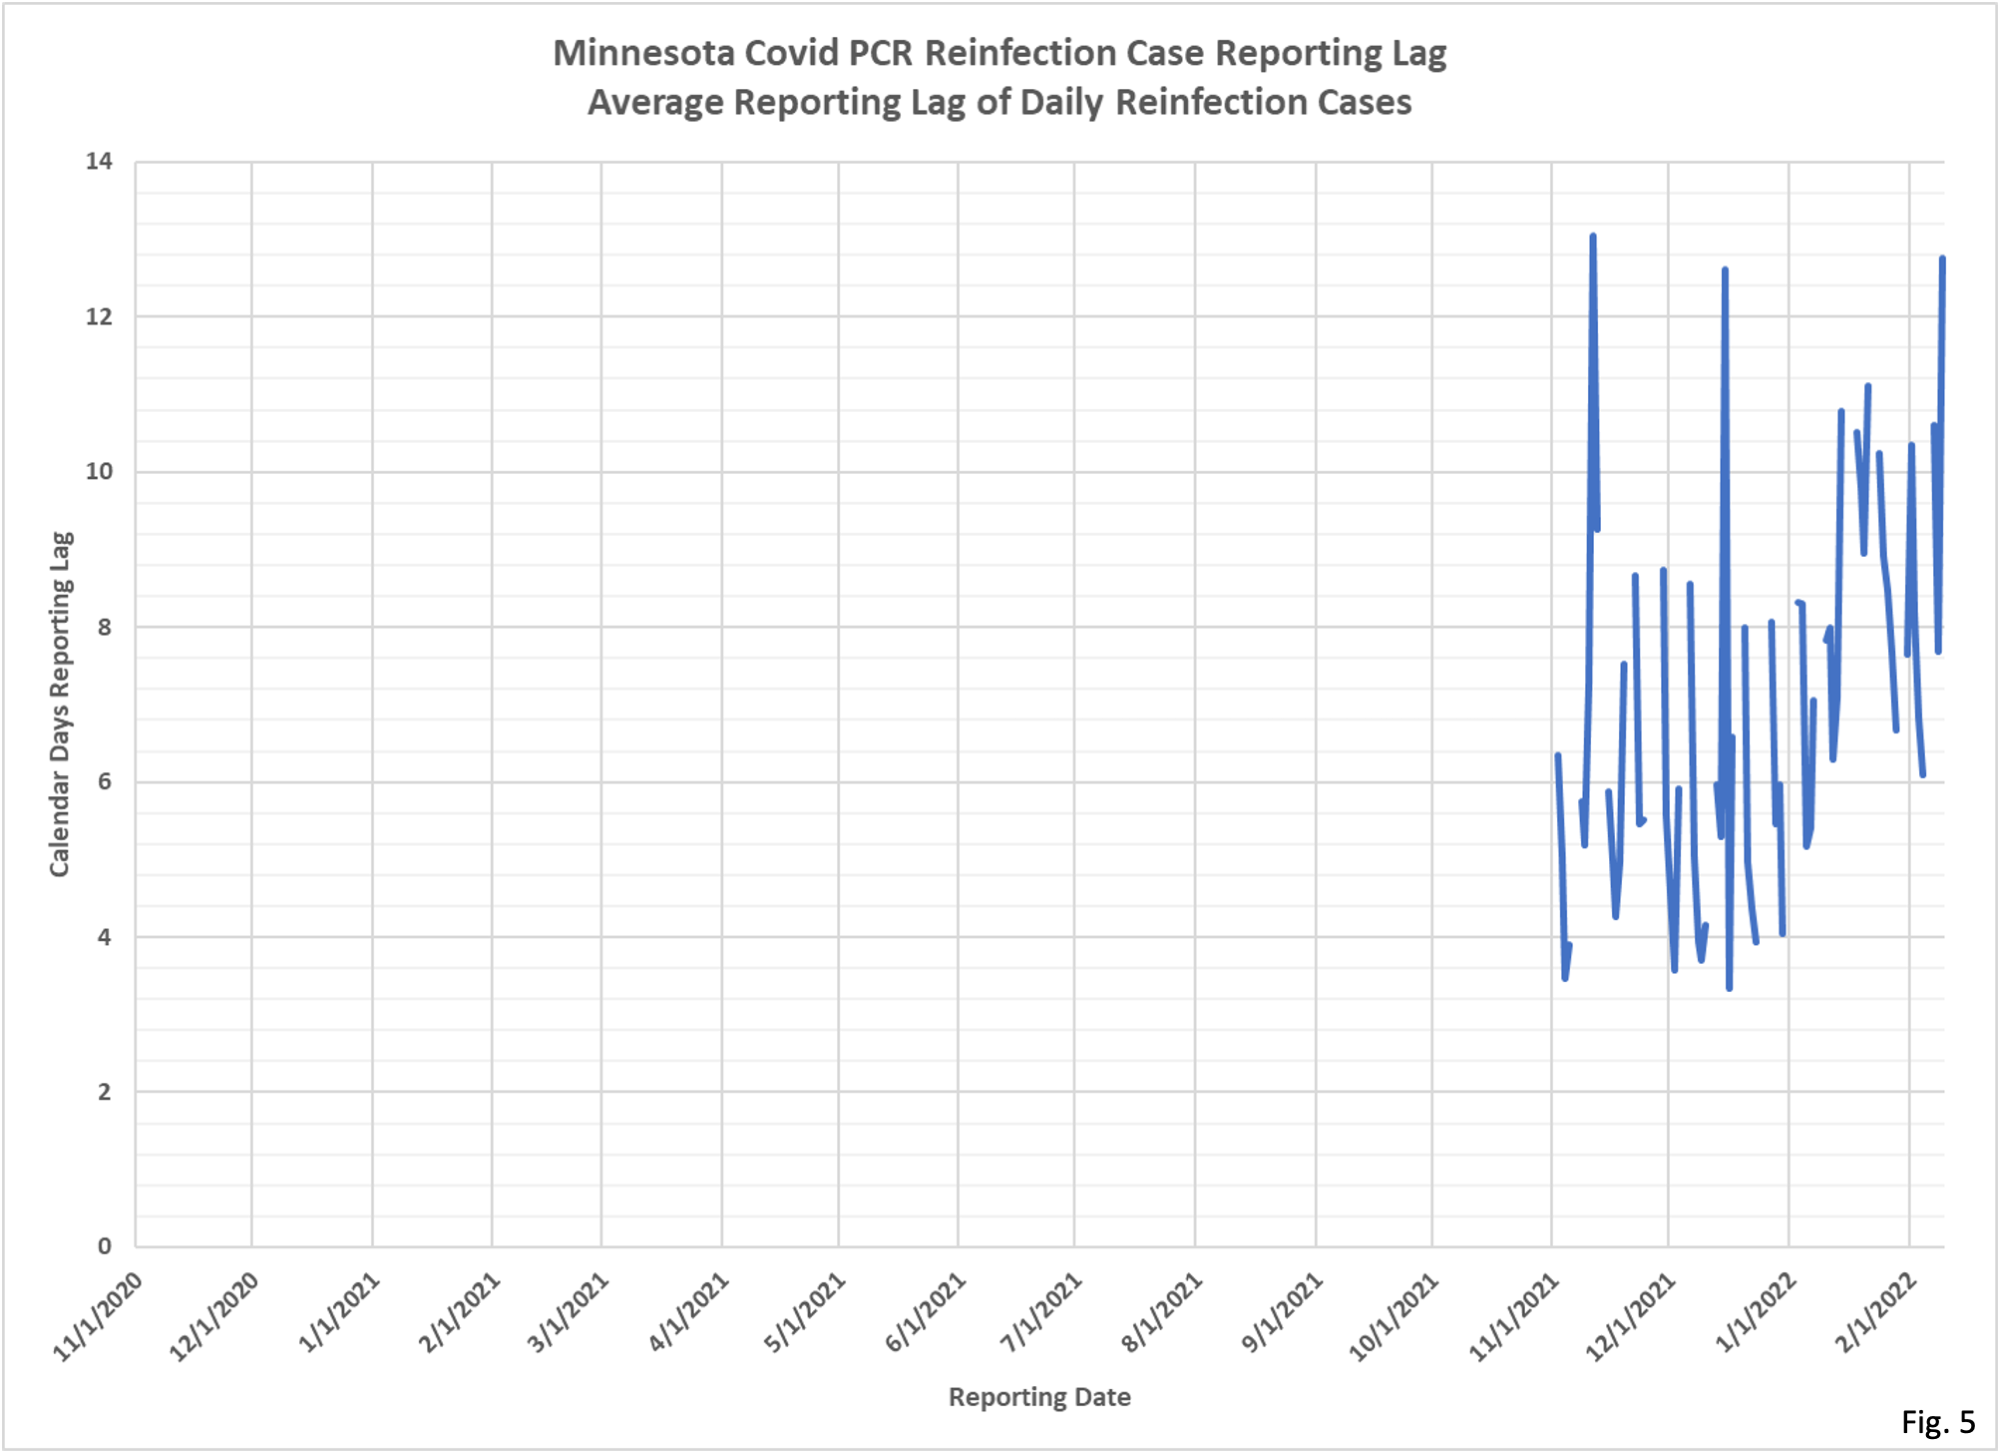
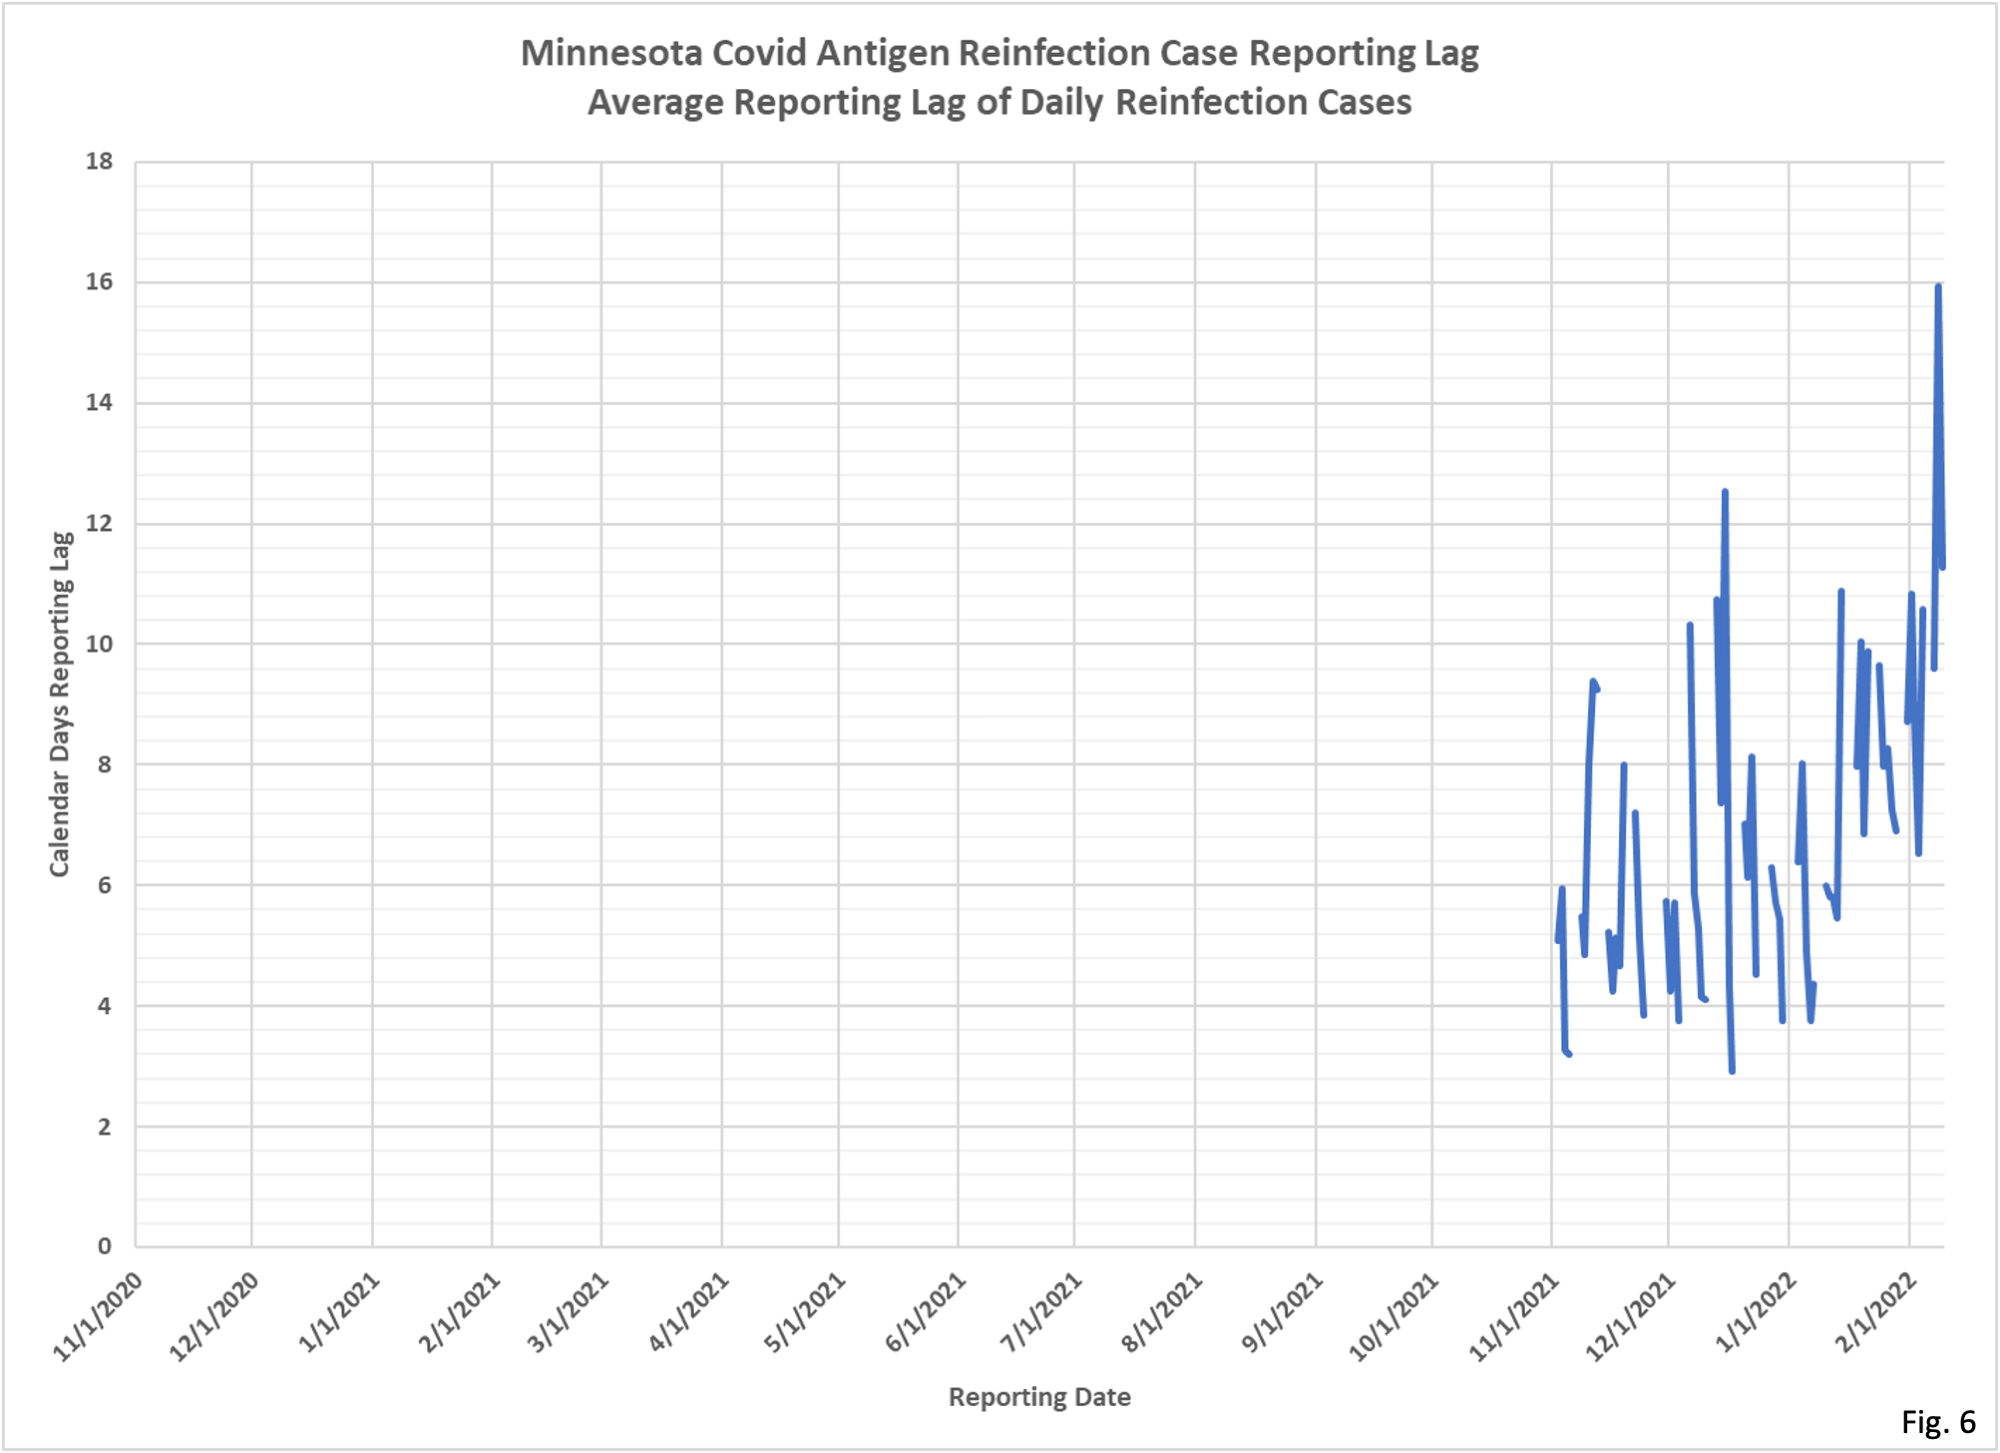
9. Fig. 5 and Fig. 6 display the average reporting lag for PCR reinfection cases and antigen reinfection cases. Reinfection data started to be published on 11/02/2021, and generally is more variable than PCR and antigen case reporting, and takes longer as well.
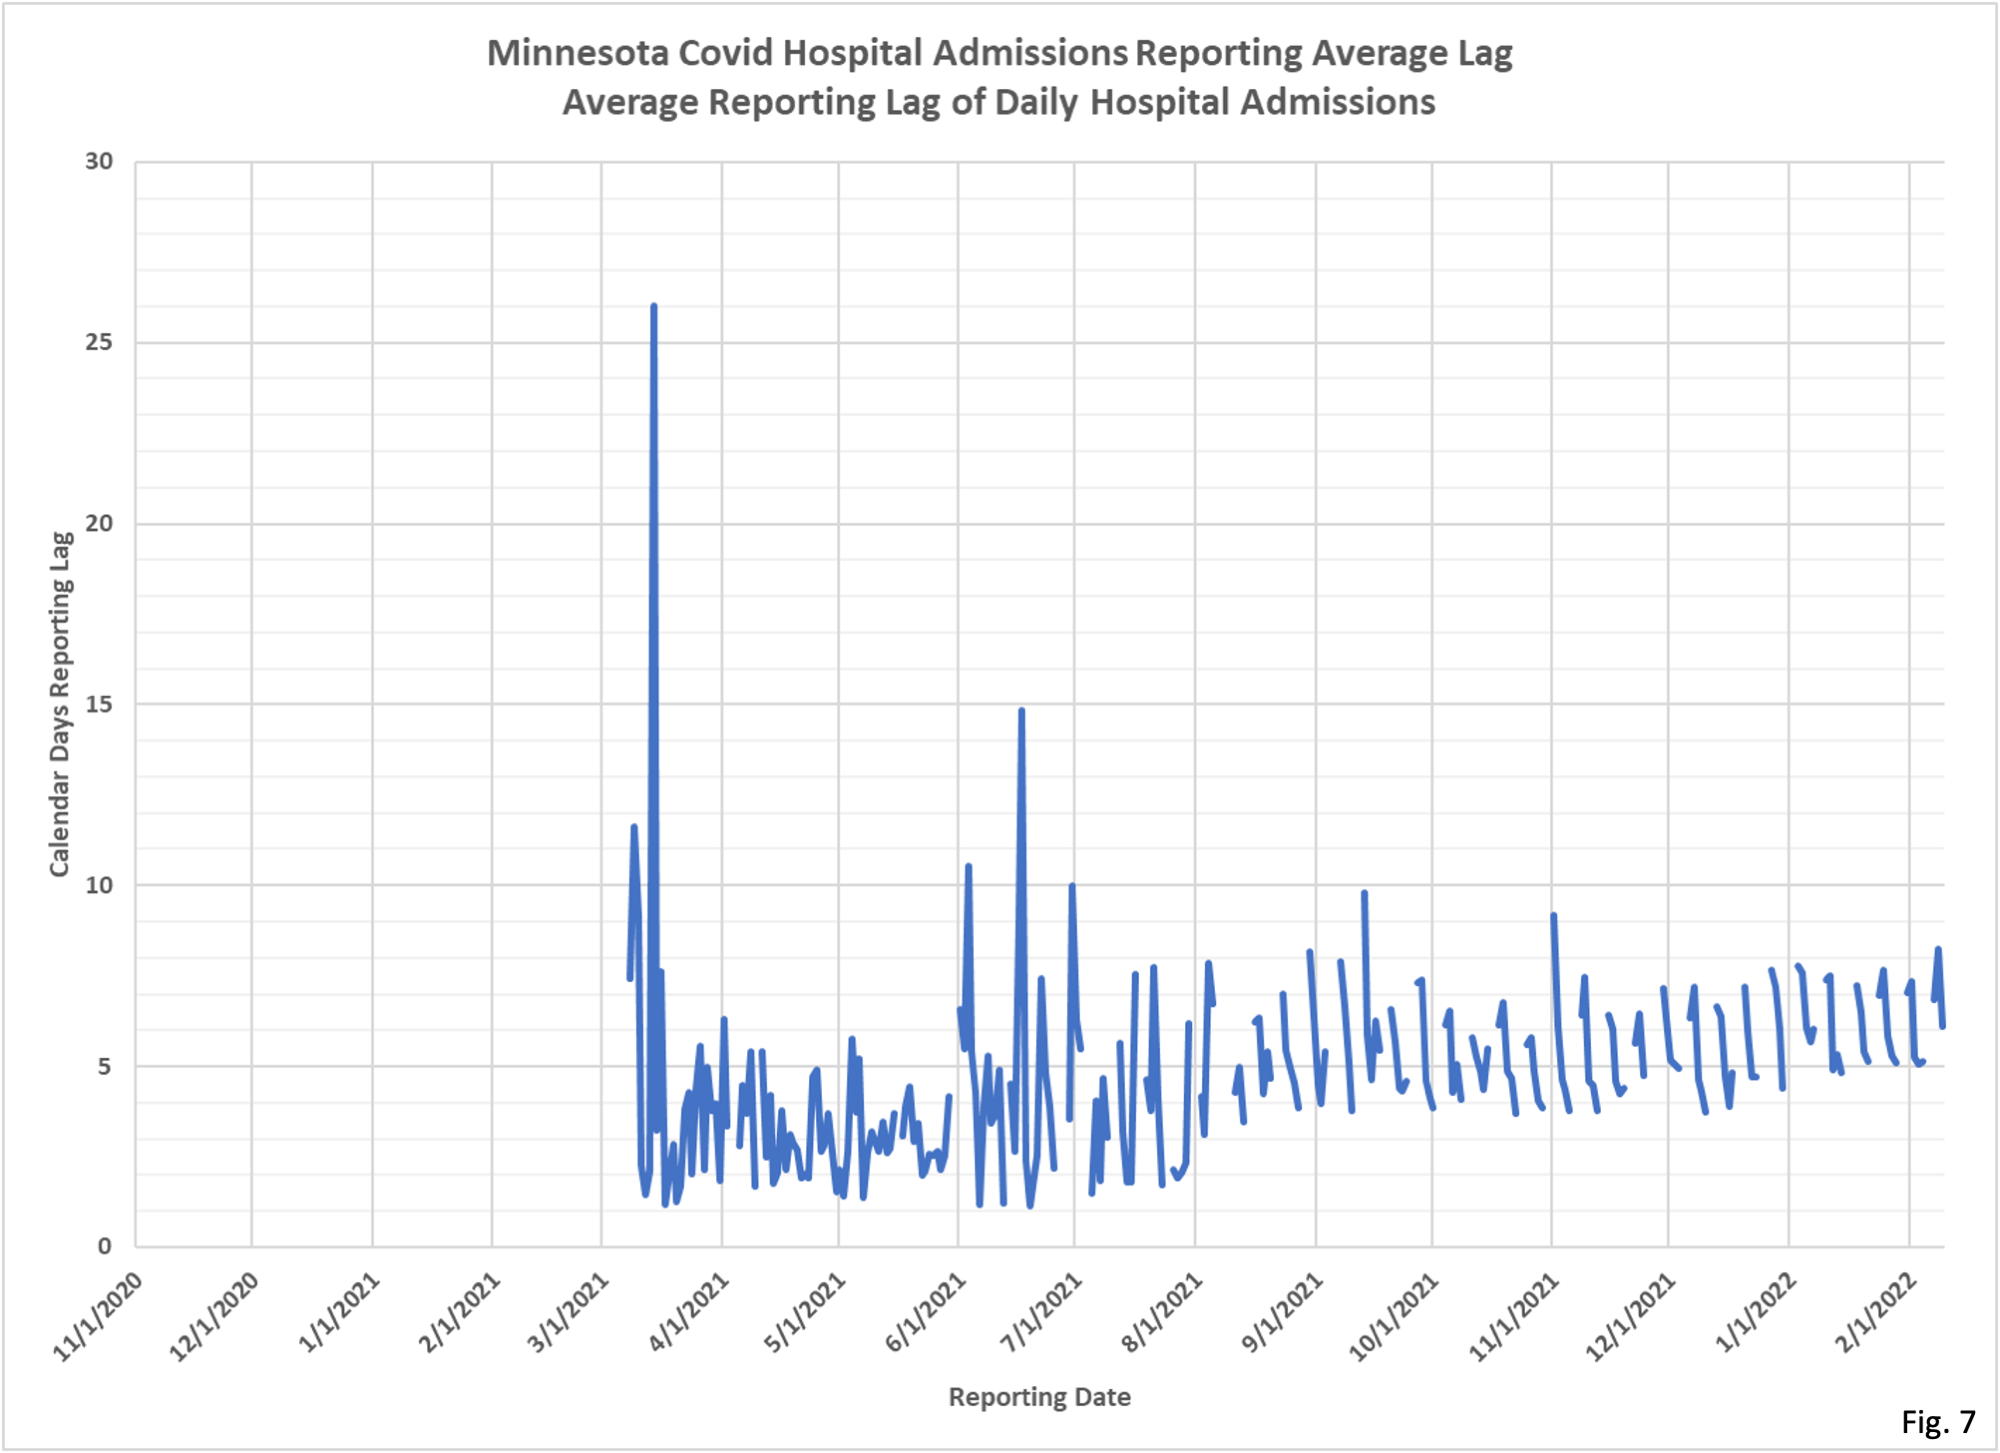
10. Fig. 7 displays the average reporting lag for combined ICU and Non-ICU Covid hospital admissions. There does not appear to be a significant lengthening of reporting time in early 2022 when MDH reported a heavy backlog of cases to process.
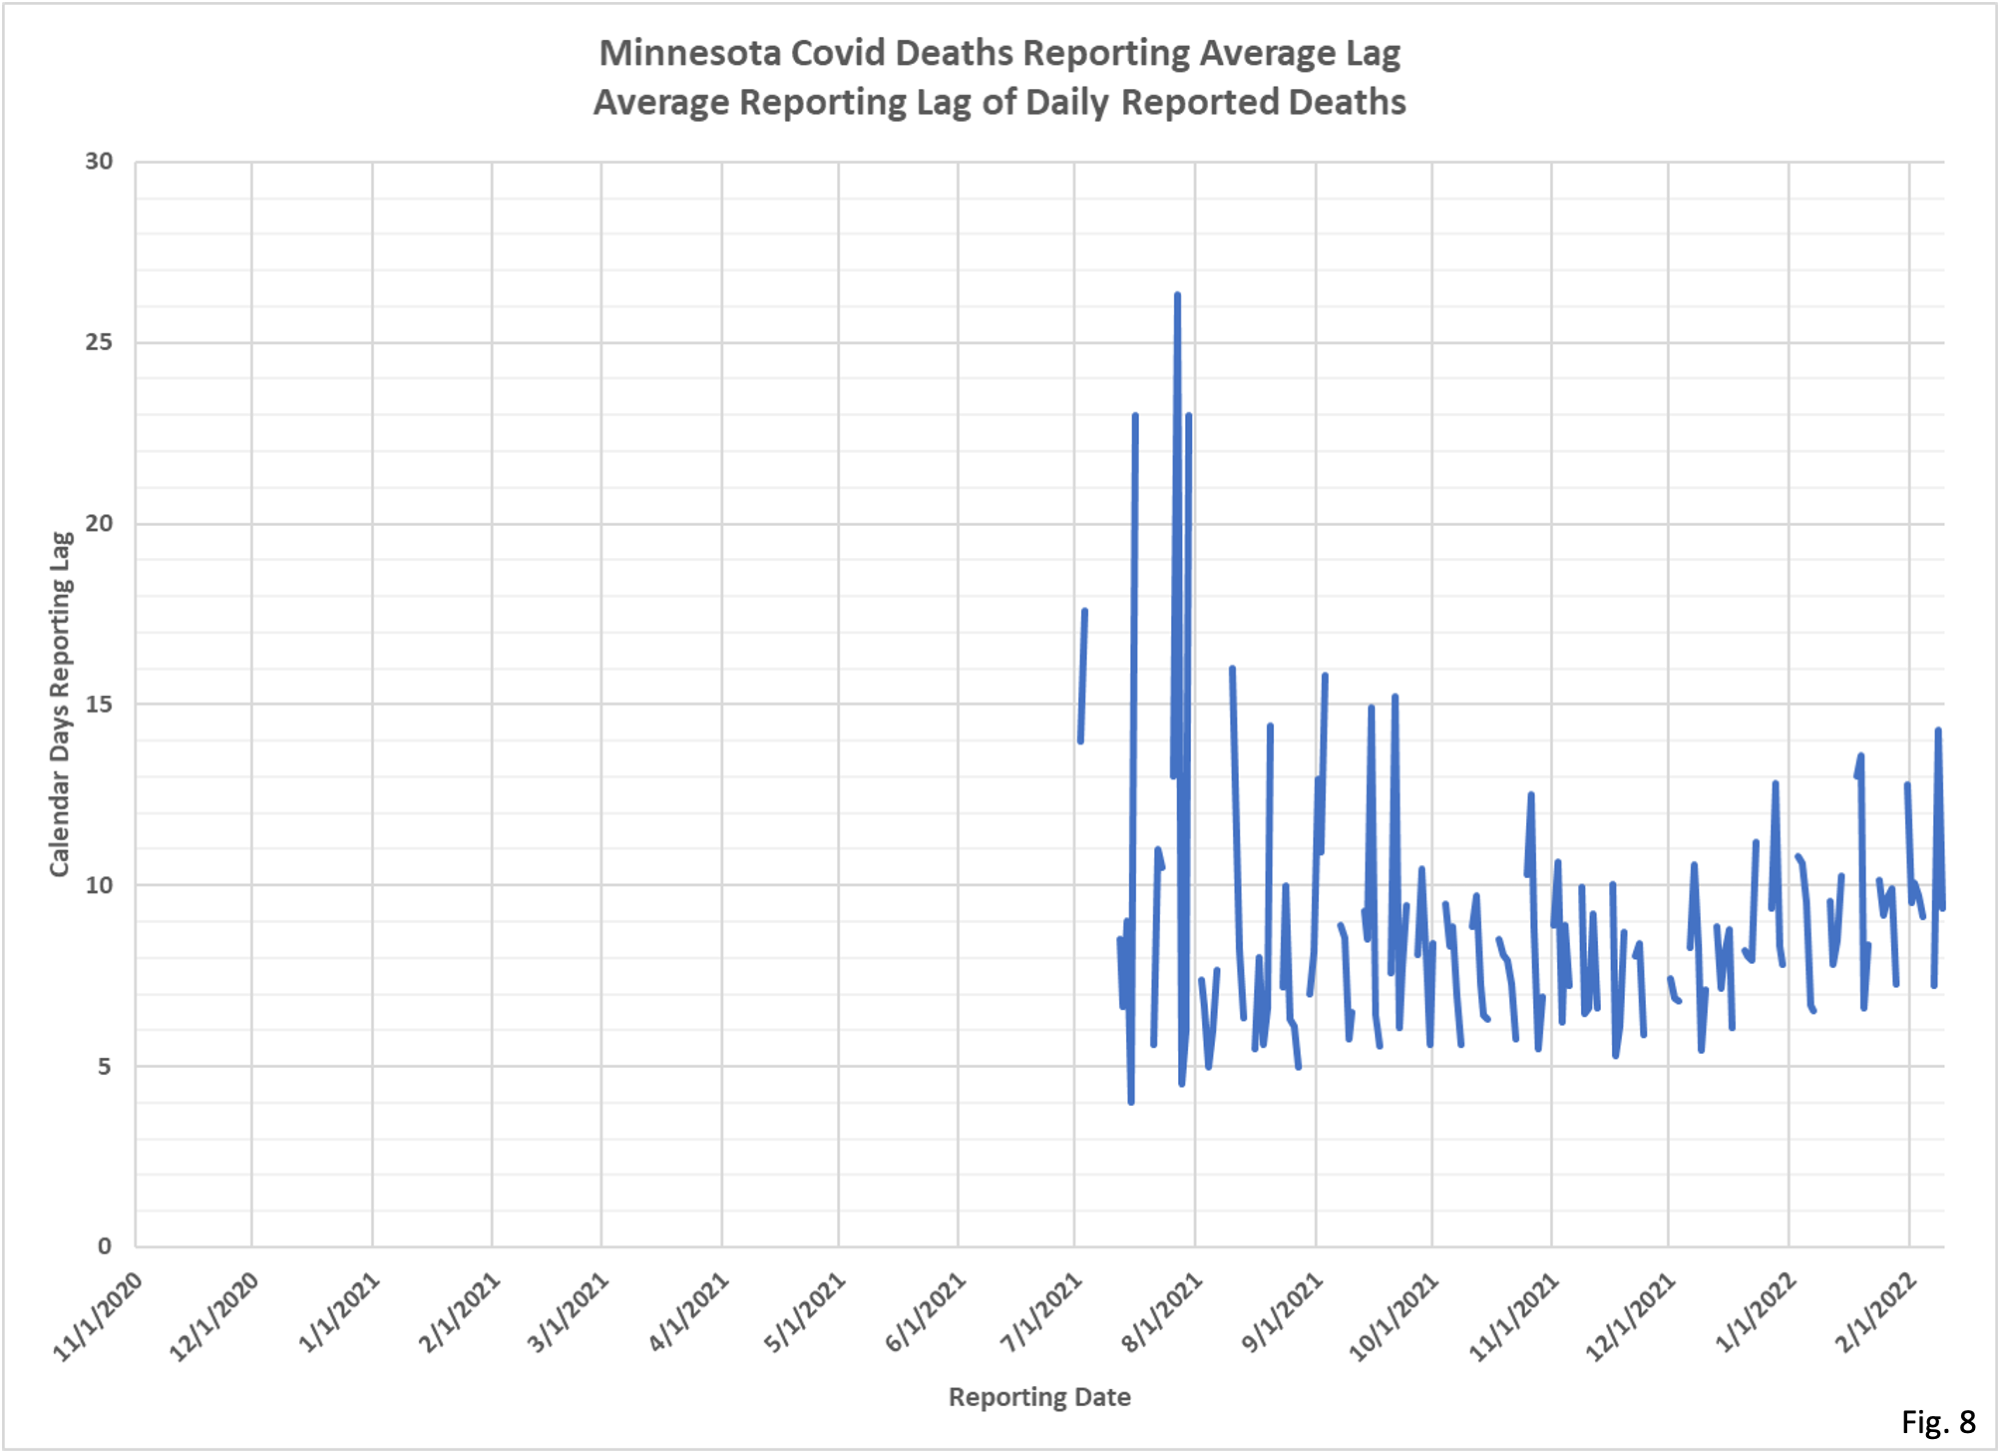
11. Fig. 8 displays the average reporting lag from date of death to date of report on the Situation update web page. Note that the average daily lag in reporting only considers the most recent 90 days of changes. Occasionally MDH reports deaths that are as much as a year old, and these will not be picked up by the current analysis methodology.