Breaking on thru to the other side, as events in the vaxed dominate, even with the huge DOH processing issues. The first table is purely date of announcement, so has nothing to do with when these events occurred. Most of the events are at least a month old. But they are already beginning to show the effects of the Omicron peak, or DOH’s high variability in processing at the start of the year. The dates of events are only assigned through January 9, but by that week you see that the proportion of events in the oldest group is over 50% for everything–over 70% for cases. This group is heavily boosted. Yes, I know all about case rates and per capita rates, but this is a lot of breakthru events in this age group and it appears that case rates are actually converging. There are changes, usually additions, to a specific week in subsequent weeks, but they aren’t huge. My usual caution about DOH’s inability to identify a significant number of vaxed persons and the lack of disclosure about overlap with reinfection data. Dave’s notes:
- The table and charts are updated for new data released by Minnesota Department of Health (MDH) on 2/14/2022, adding data for the week starting 1/09/2022 and ending 1/15/2022. This time period contains the peak of the Omicron case surge in Minnesota, which peaked on 1/10/2022.
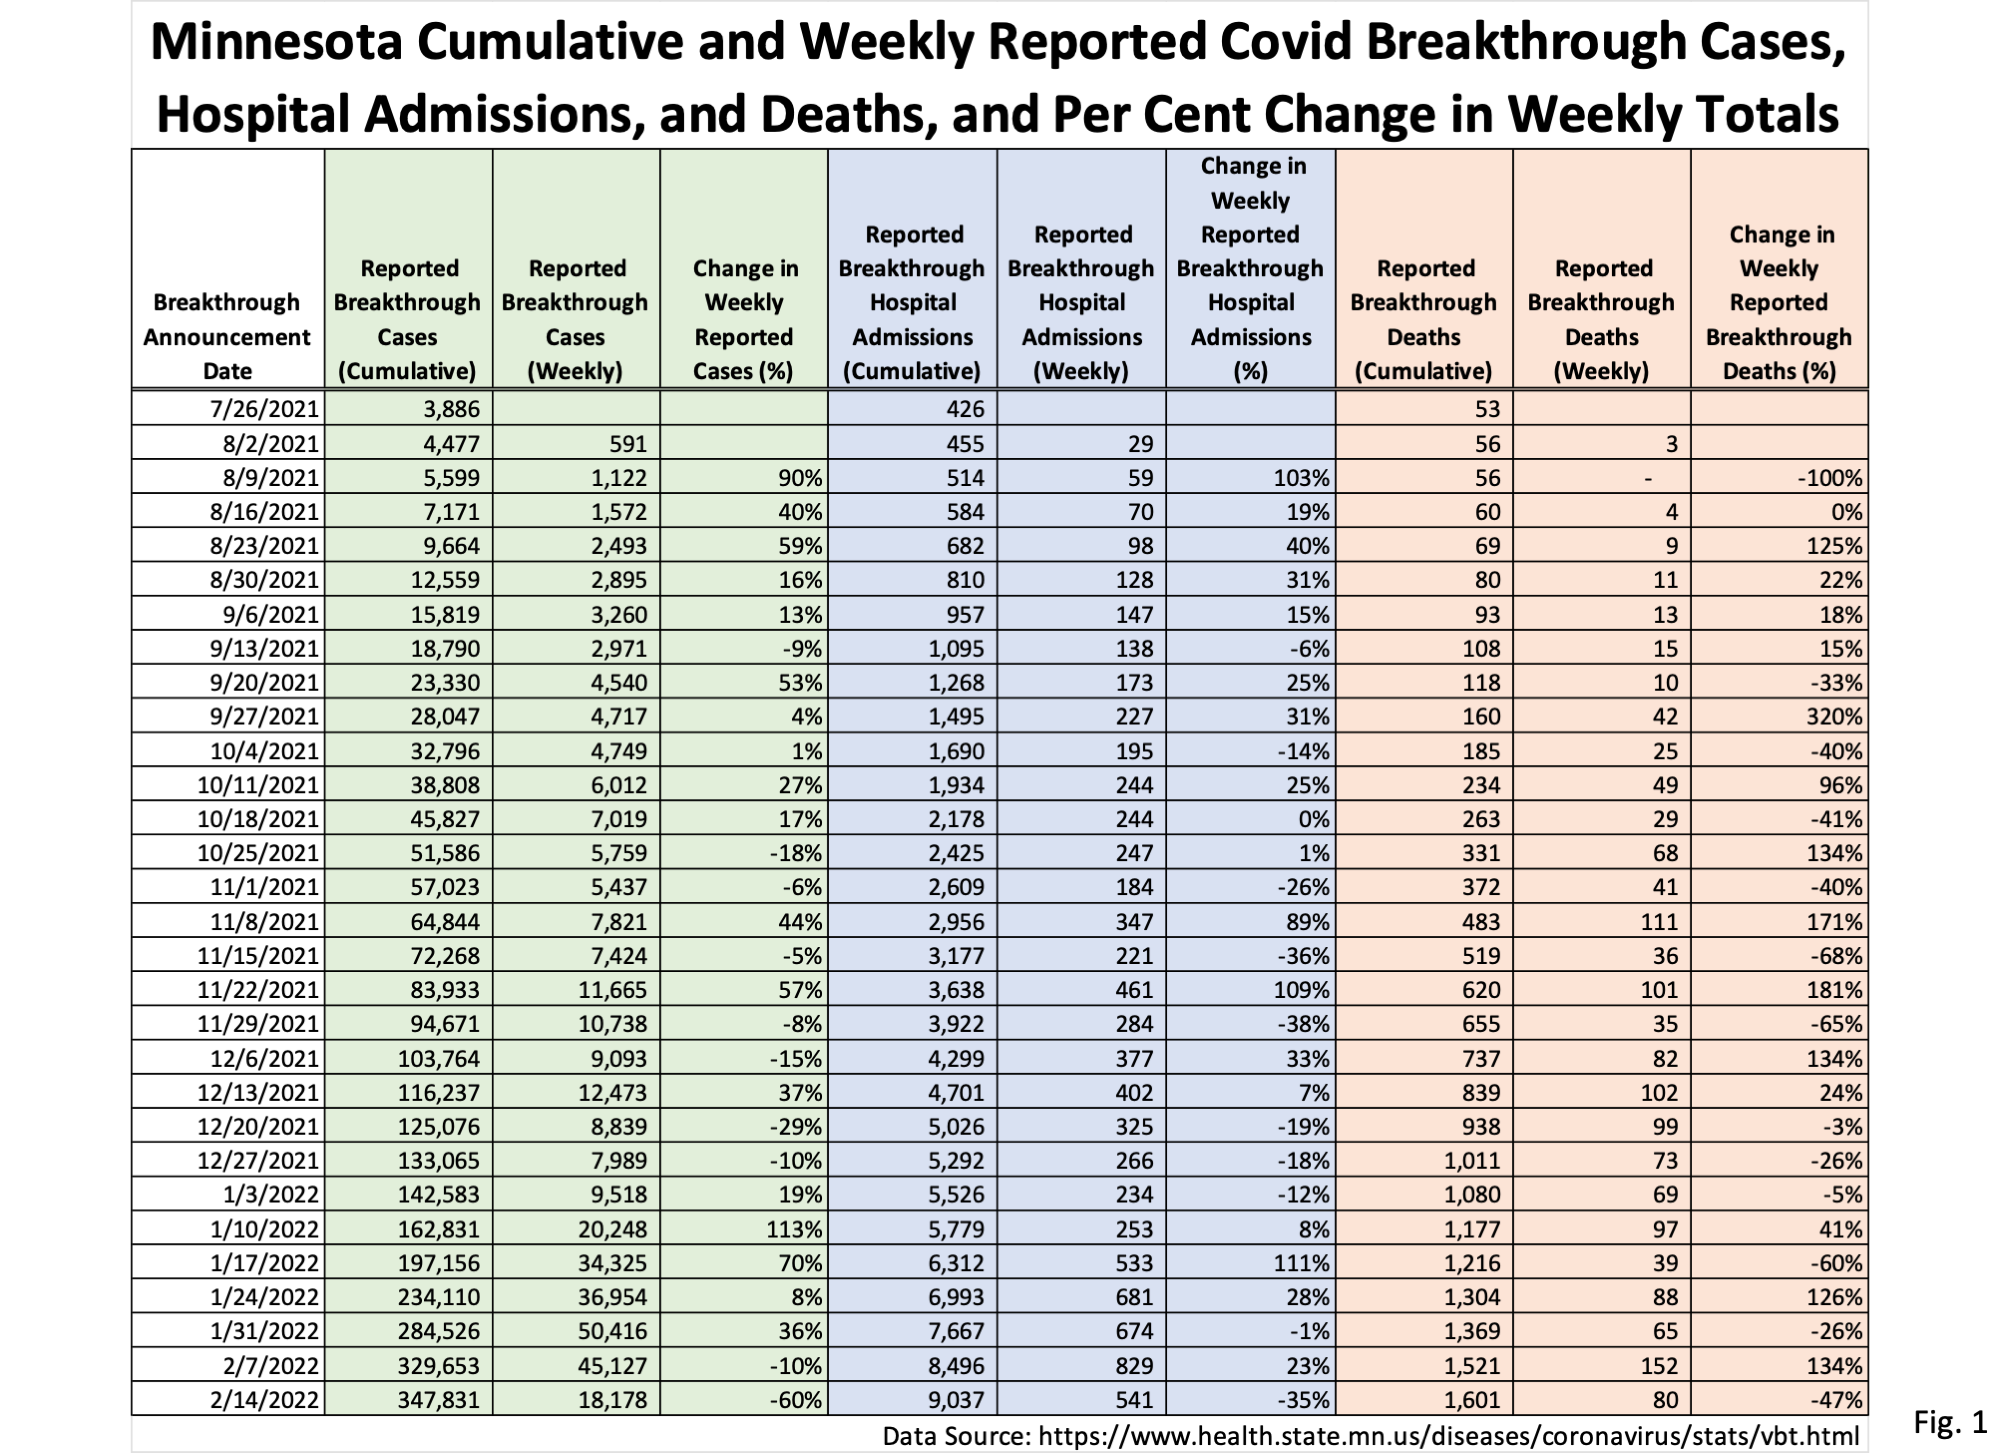
- The data source for the data on Fig. 1 is the cumulative breakthrough cases, hospitalizations, and deaths published on the MDH COVID-19 Vaccine Breakthrough Weekly Update https://www.health.state.mn.us/diseases/coronavirus/stats/vbt.html
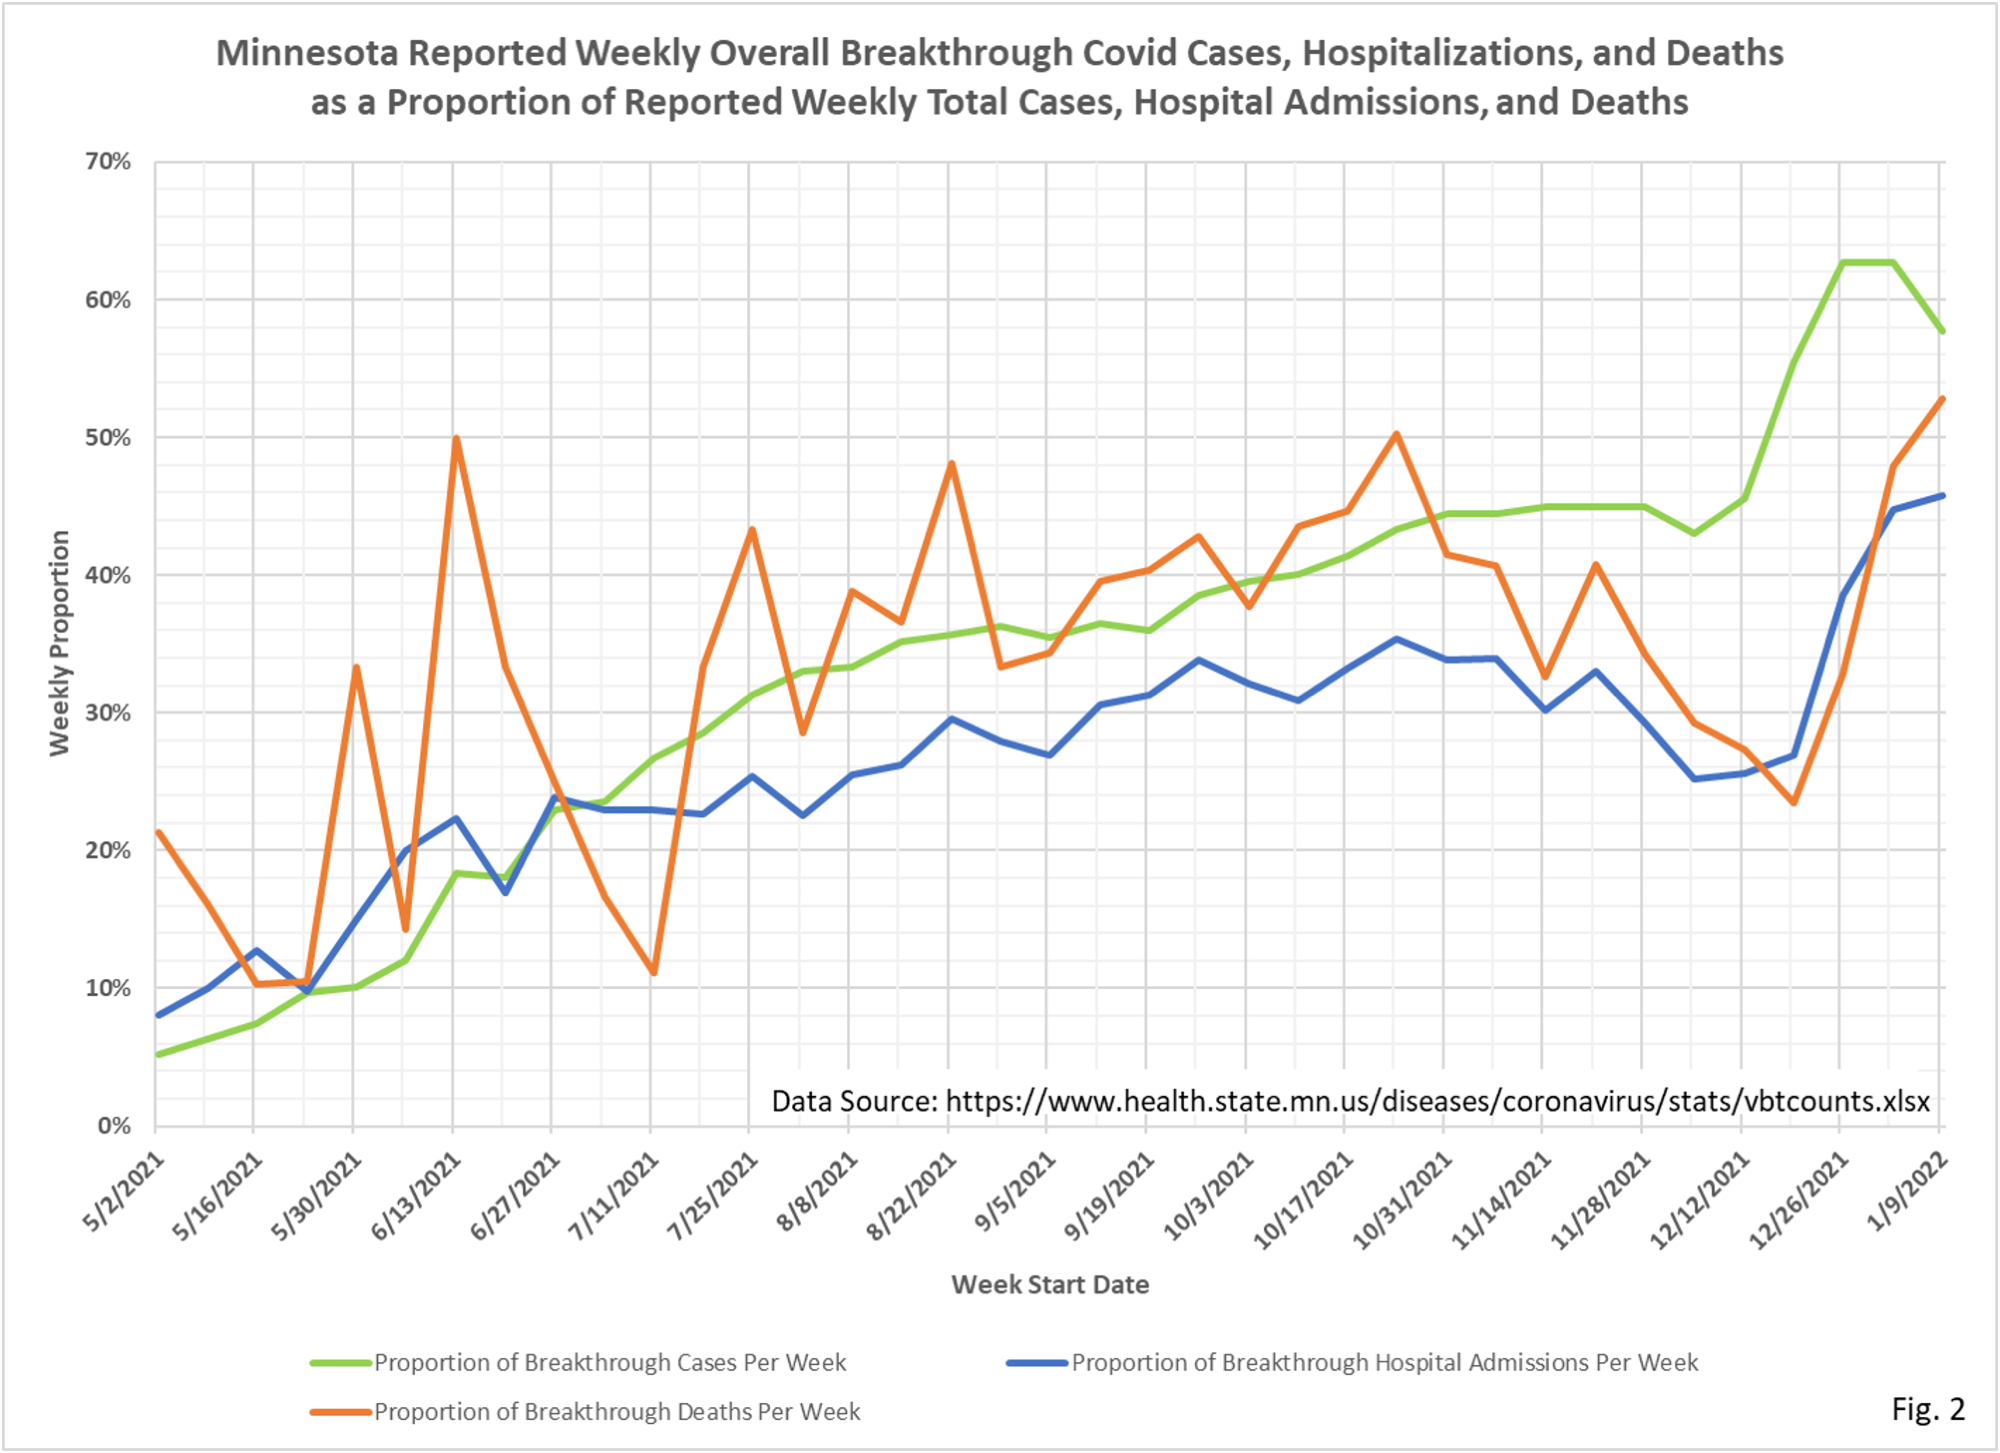
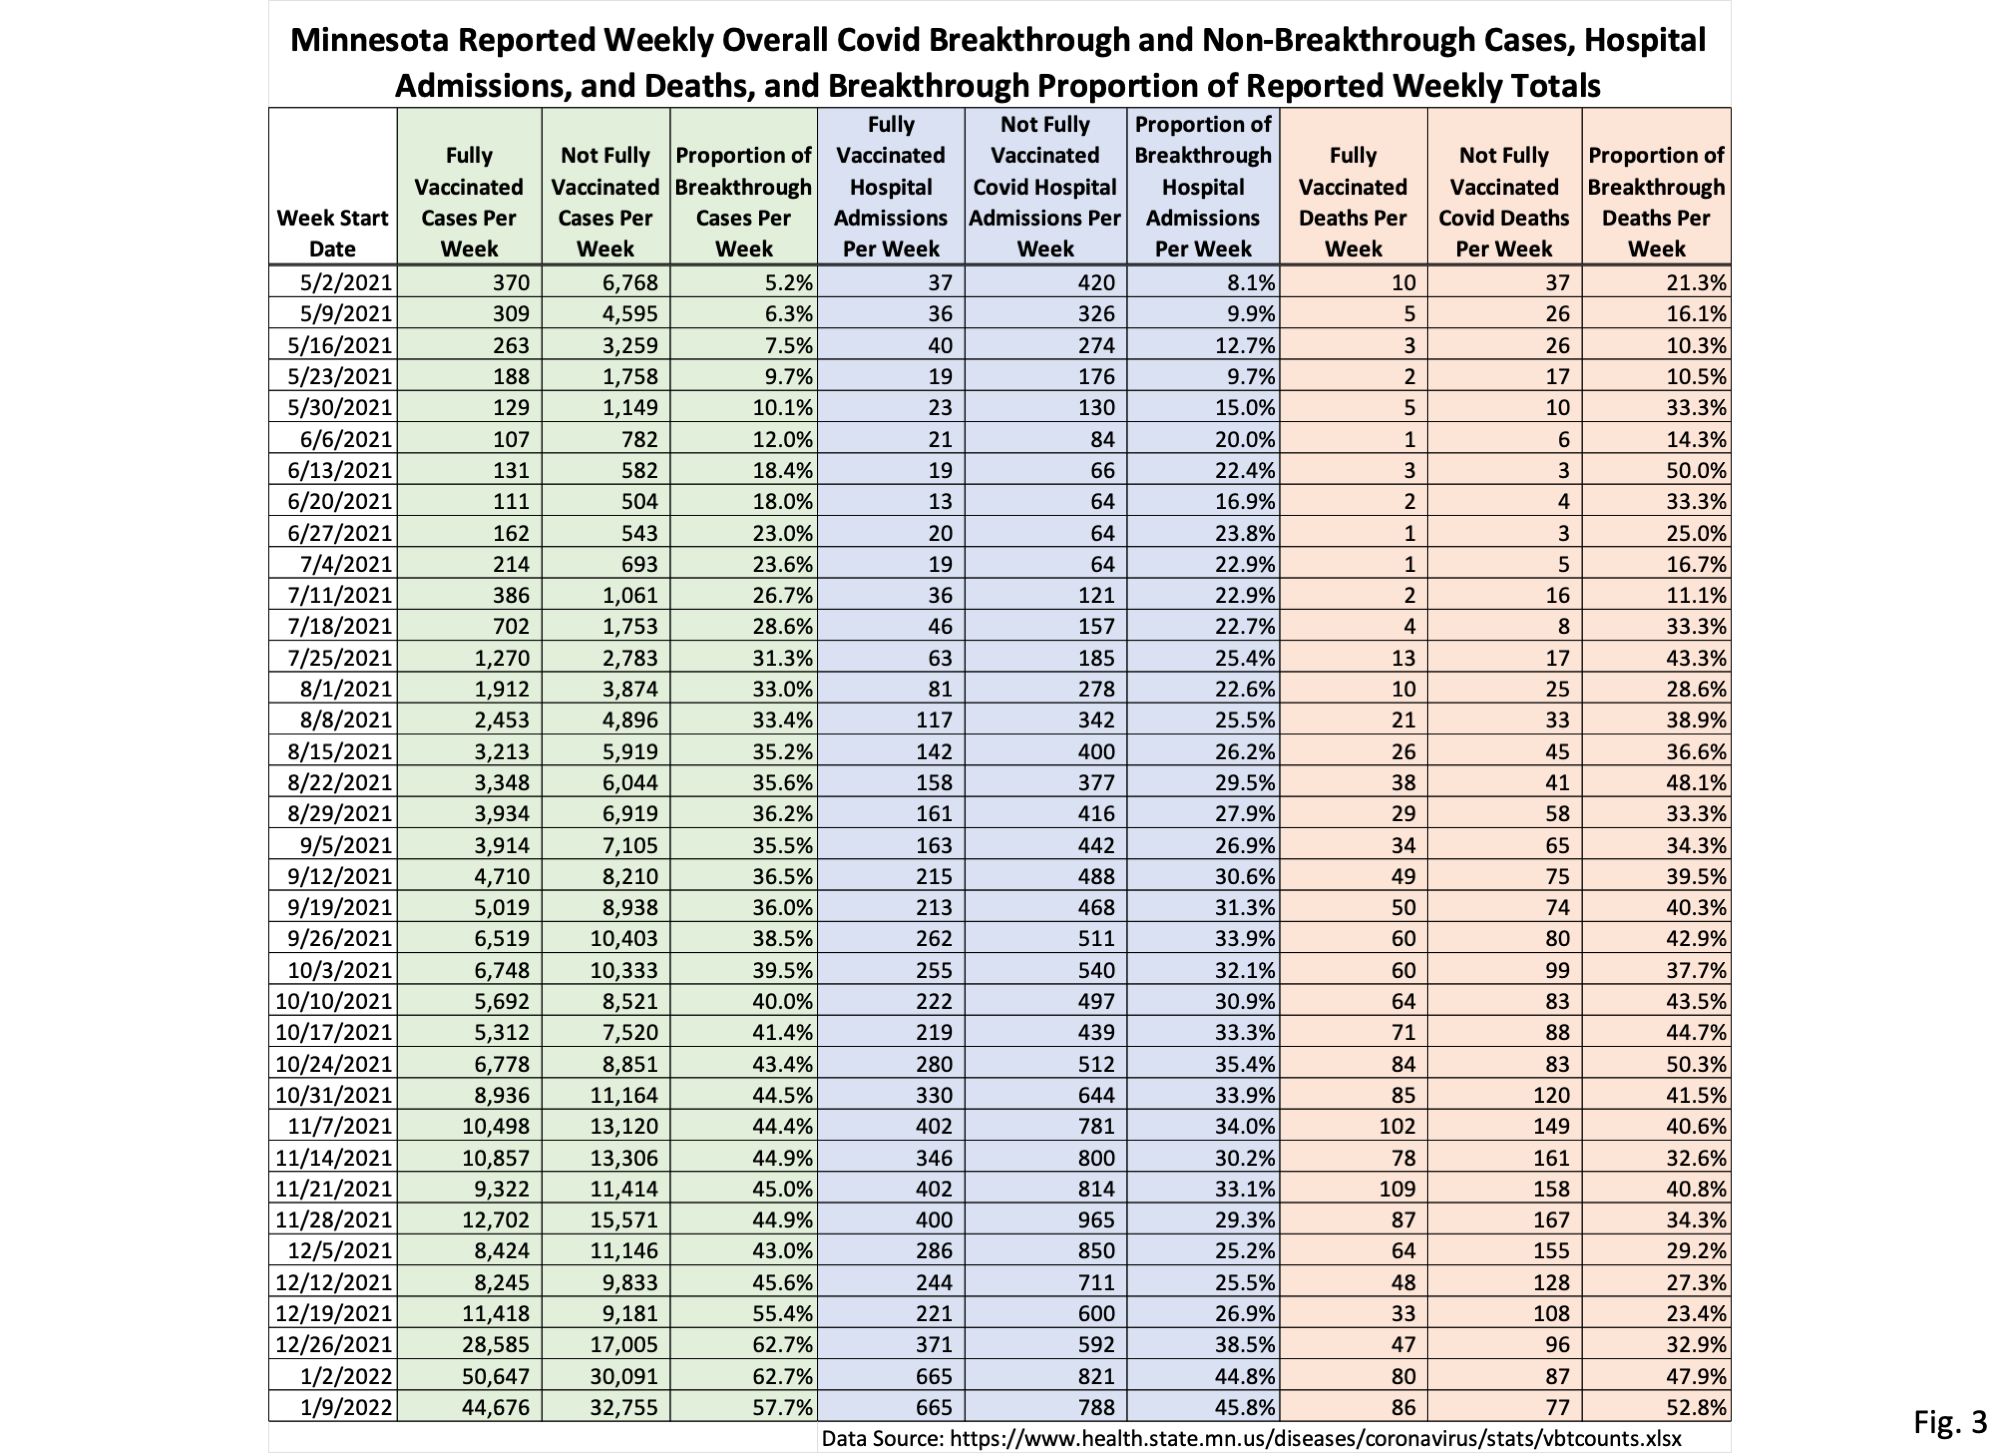
- The data source for Fig. 2 and Fig. 3 is the data file https://www.health.state.mn.us/diseases/coronavirus/stats/vbtcounts.xlsx found on MDH web page https://www.health.state.mn.us/diseases/coronavirus/stats/vbt.html. The data provided in the data file vbtcounts.xlsx is used without modification, other than to sum the weekly events and compute the breakthrough proportion. Vbtcounts.xlsx provides breakthrough and non-breakthrough cases, hospital admissions, and deaths for each week listed.
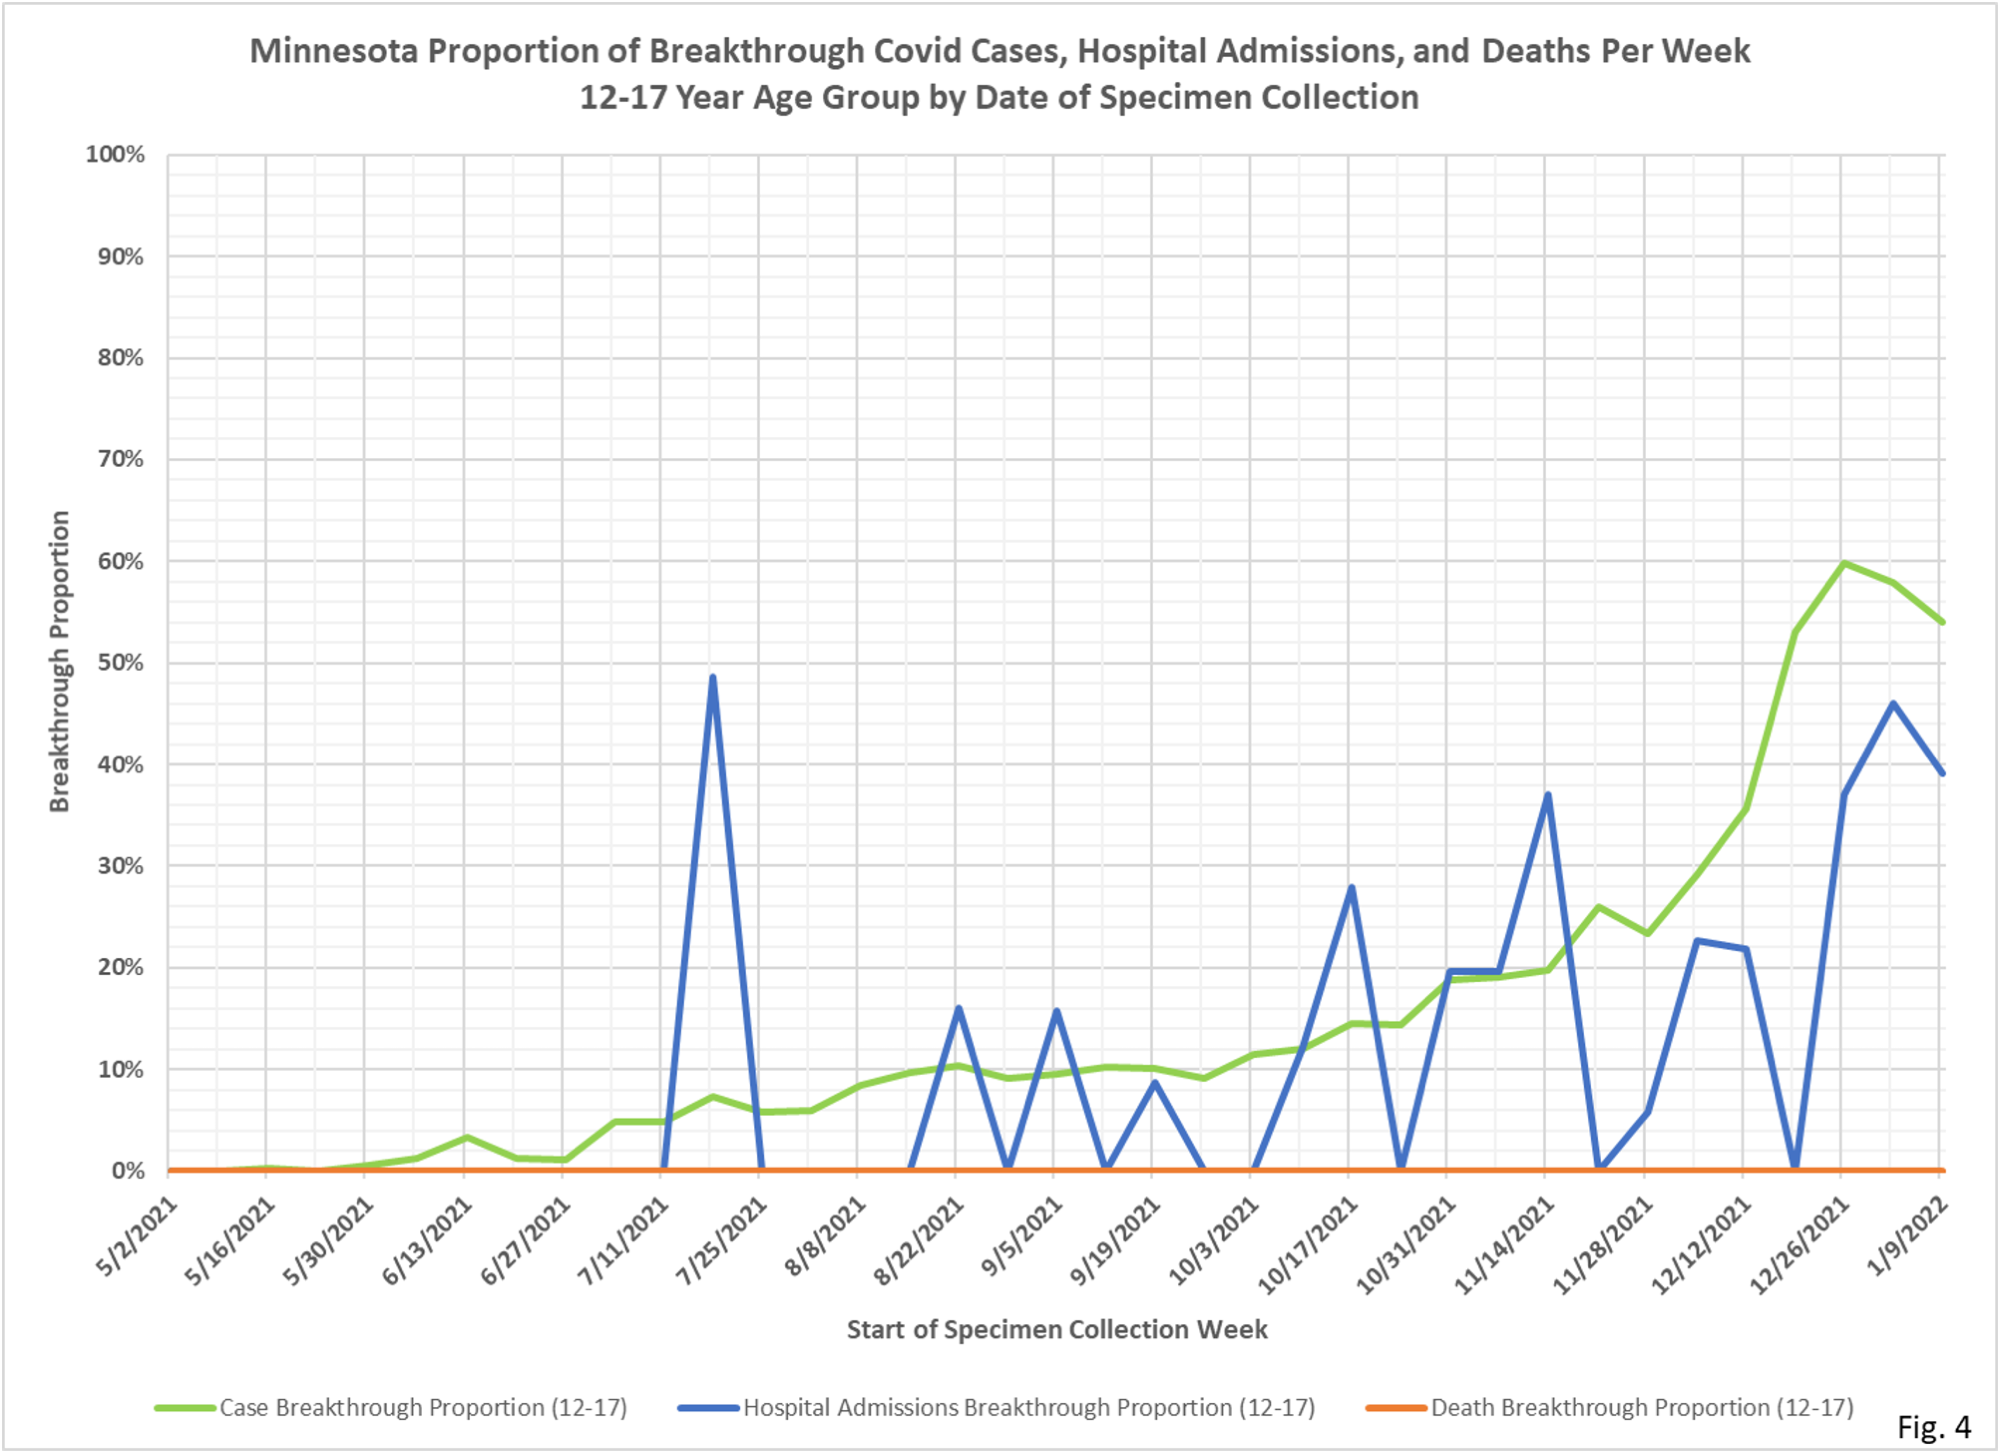
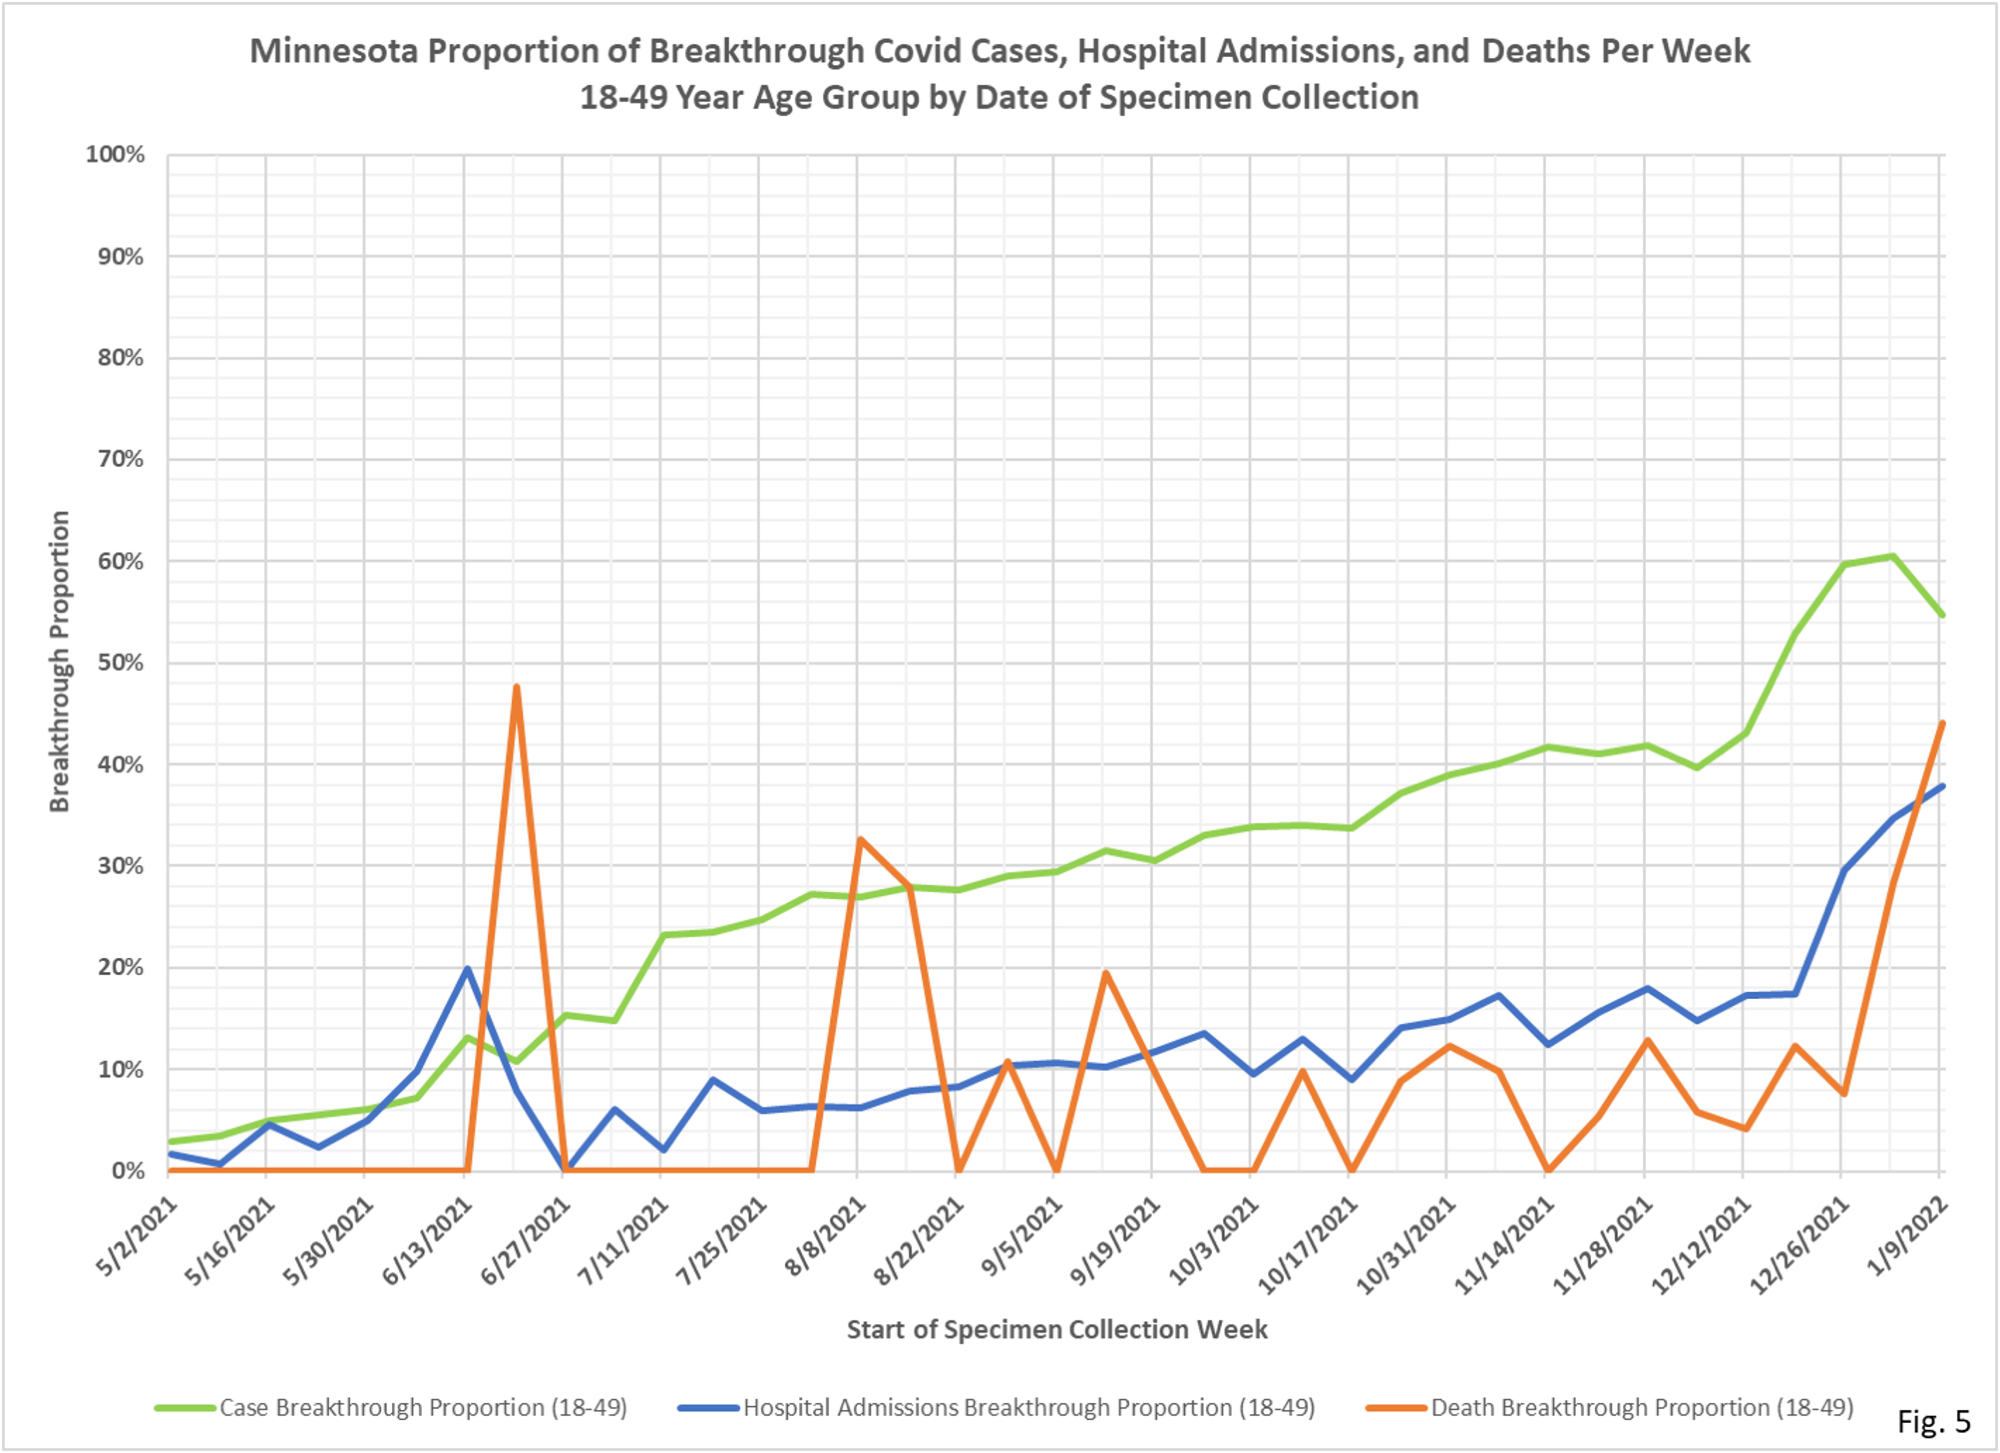
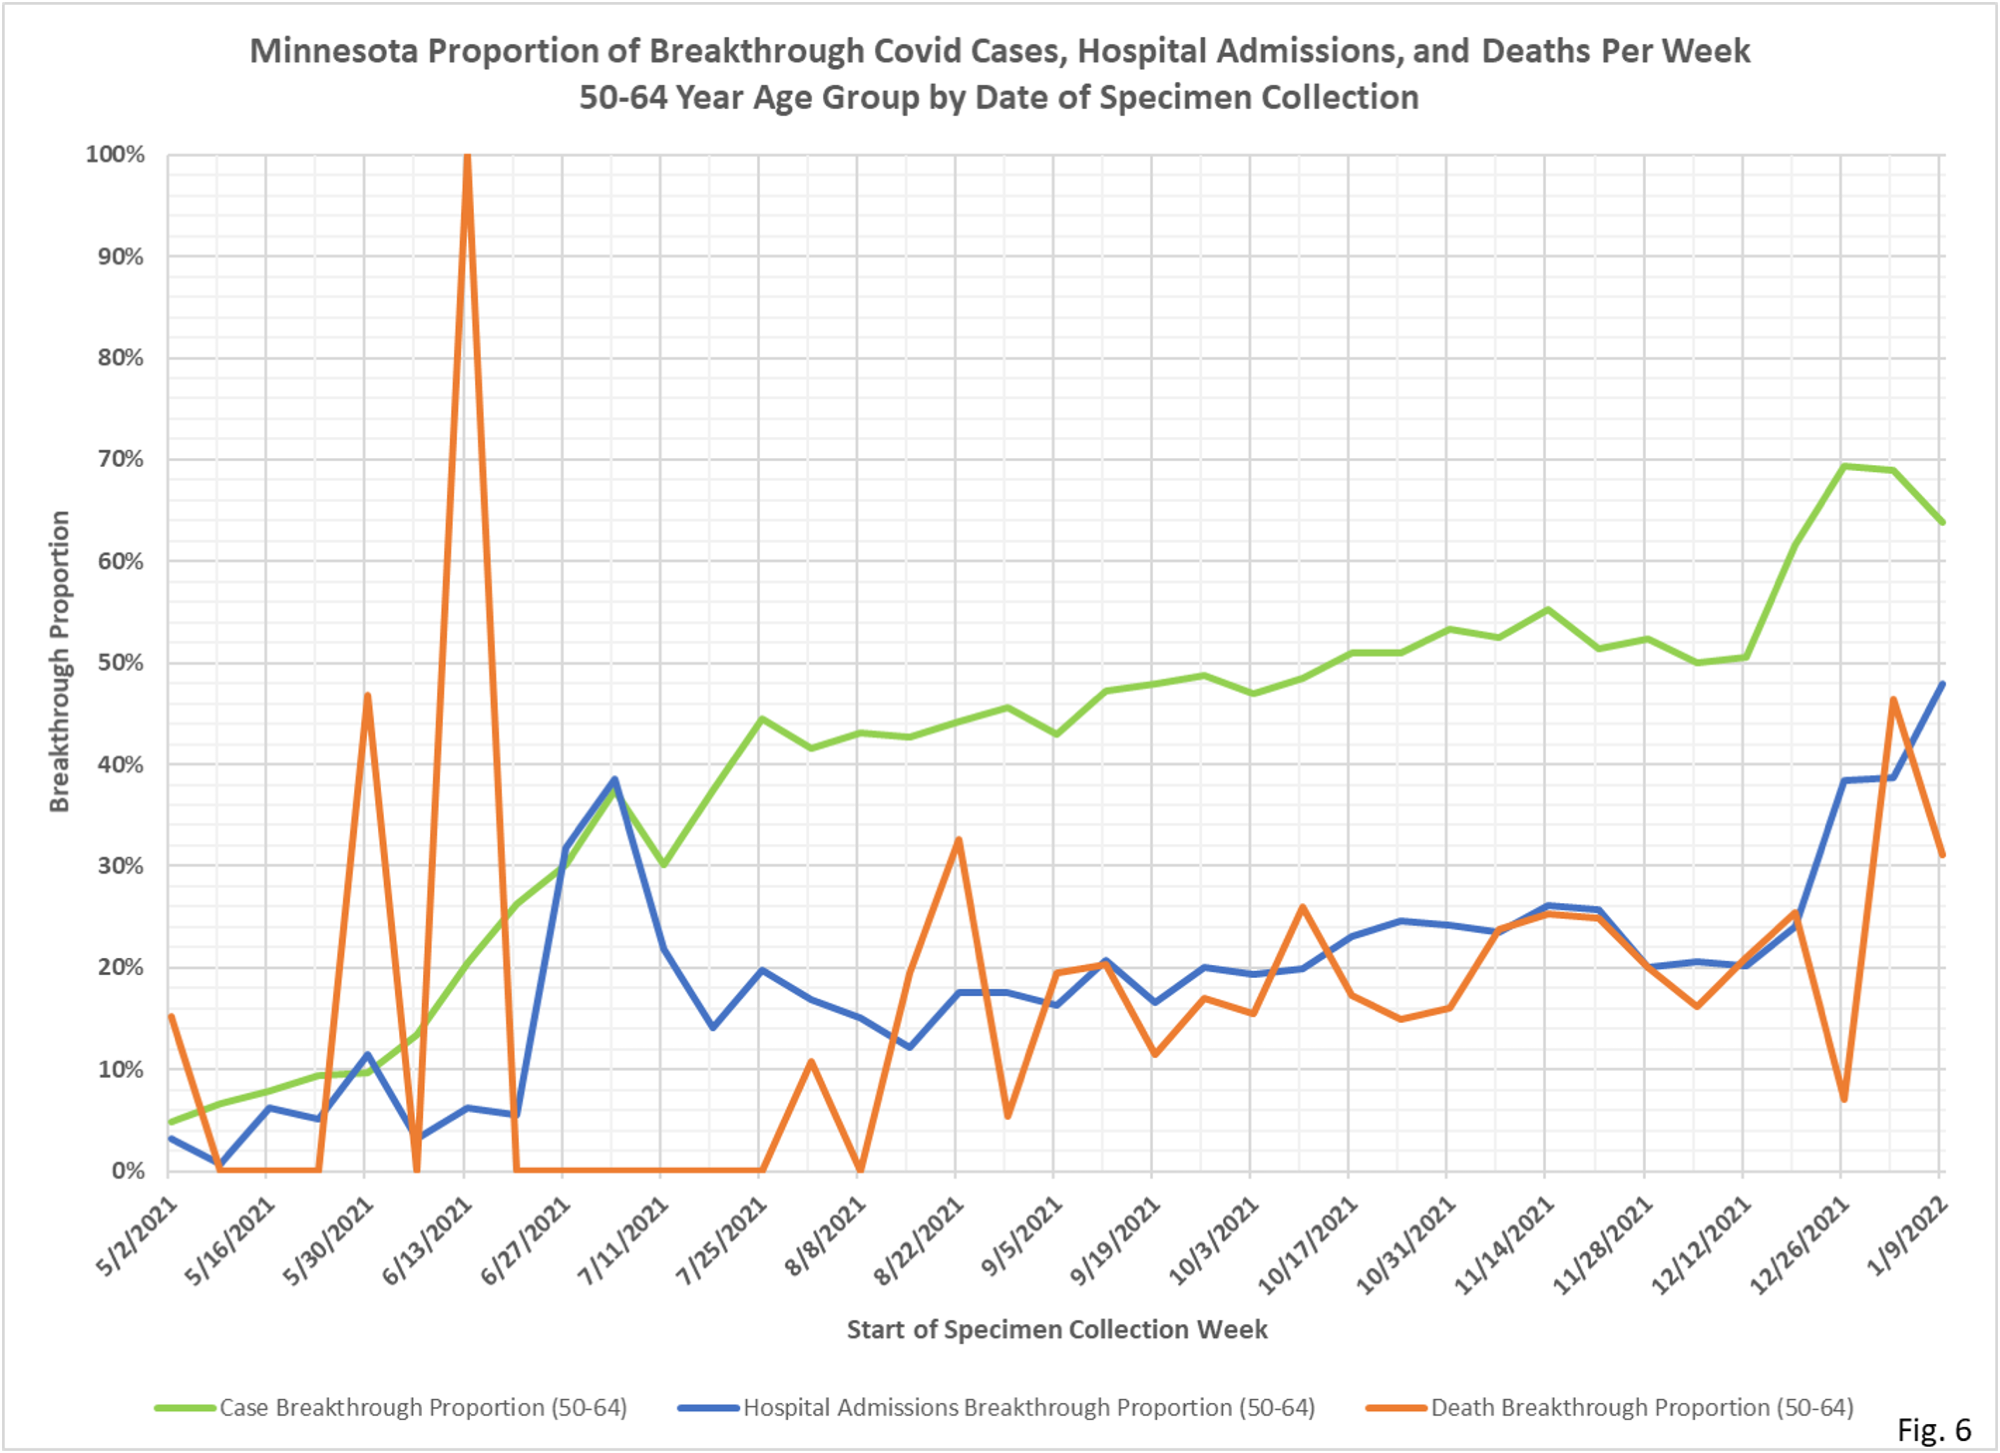
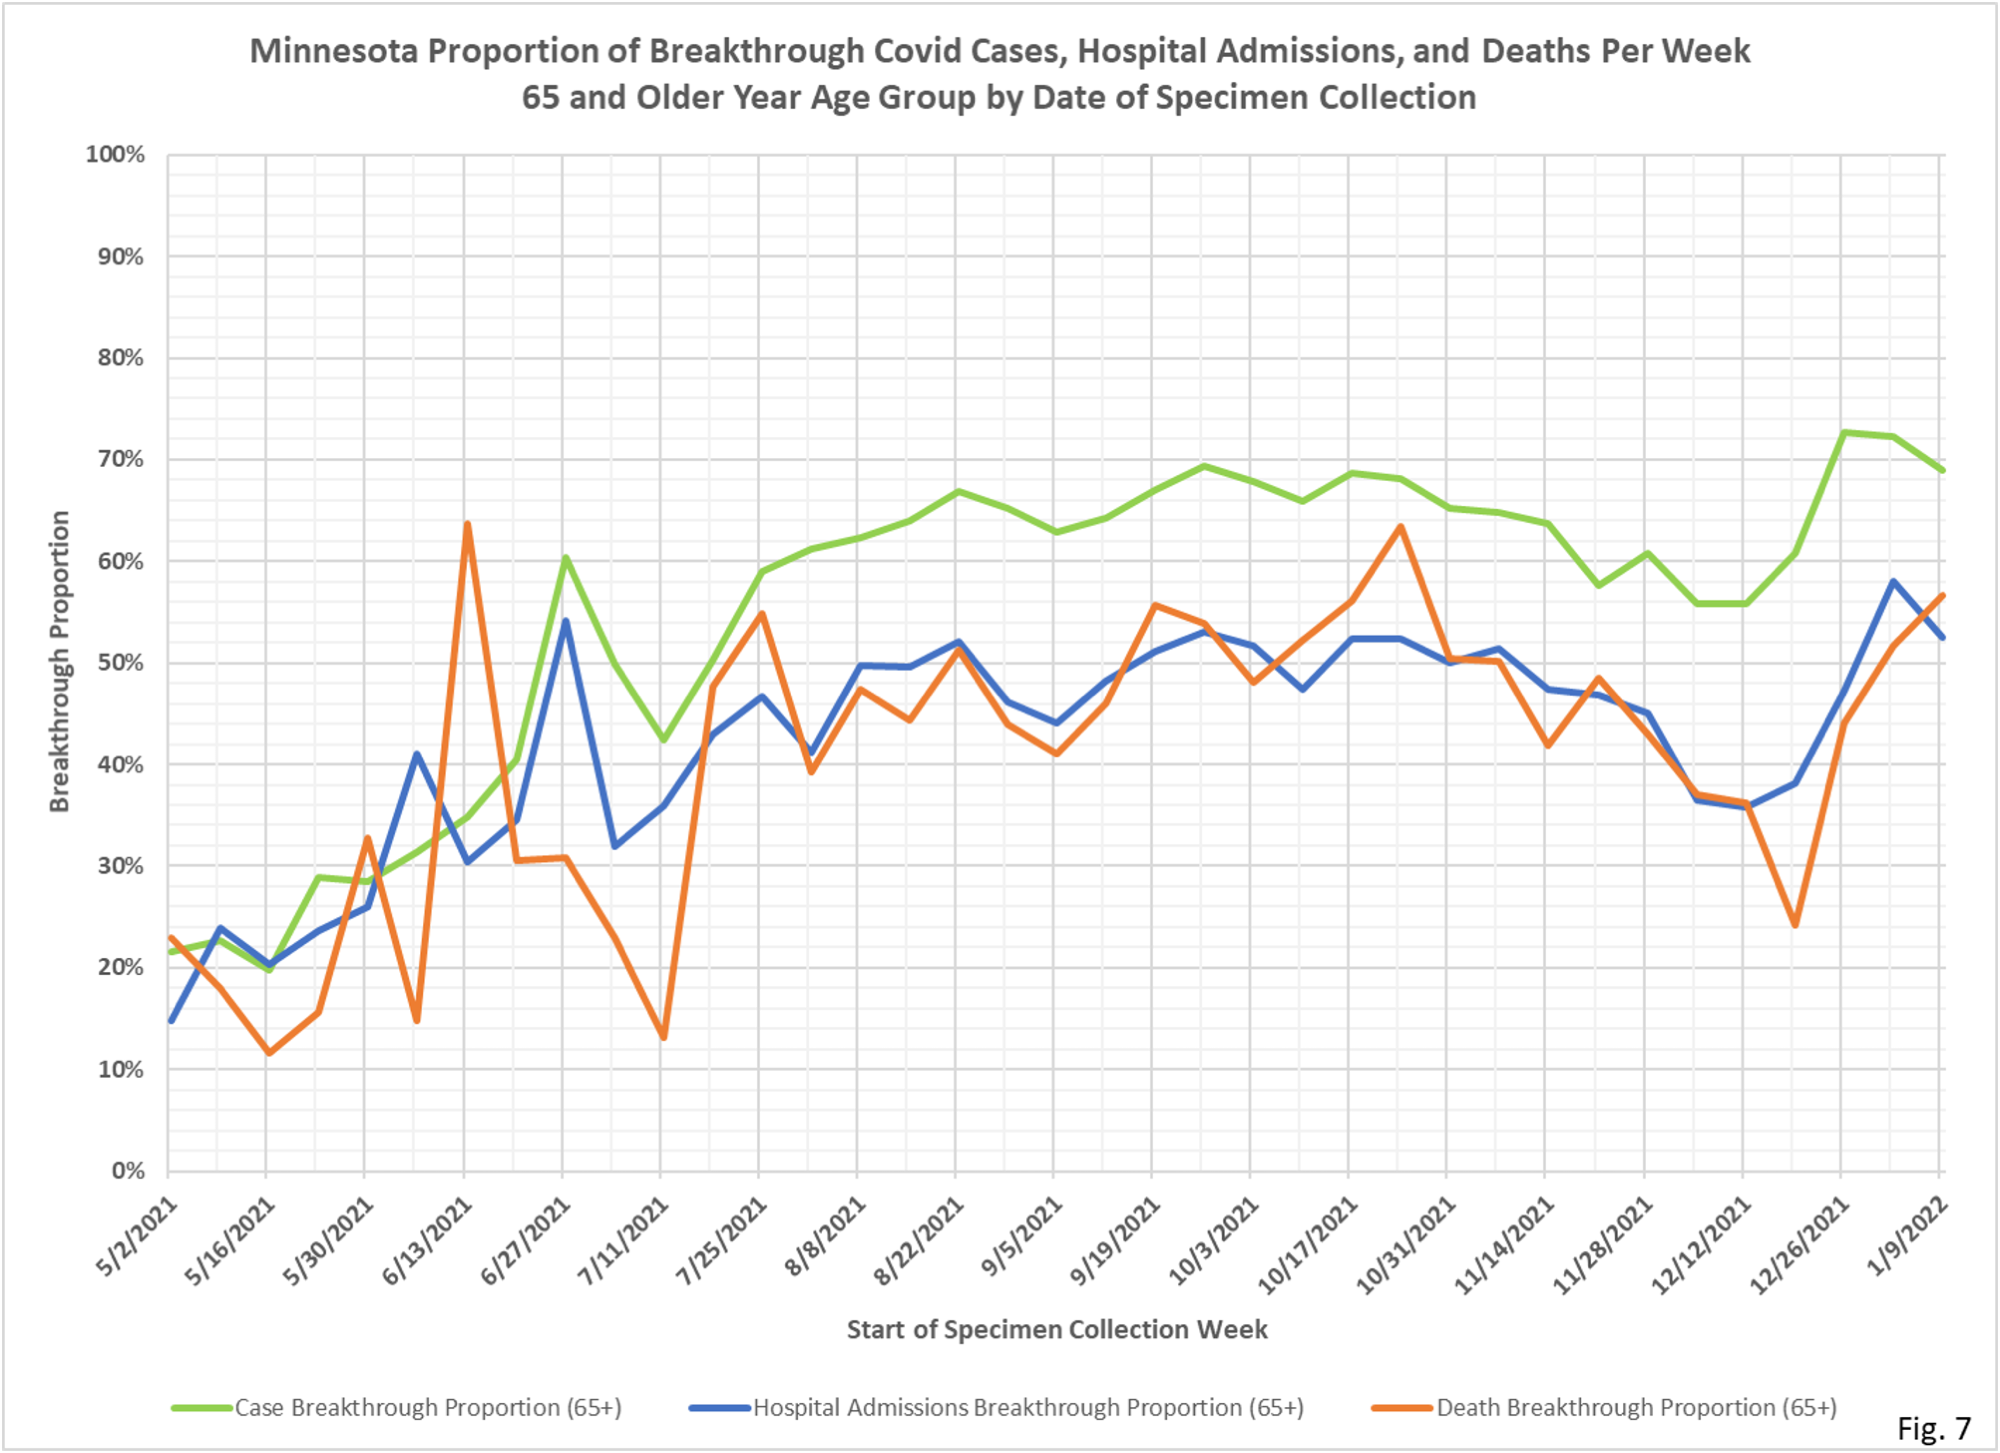
- The data source for the breakthrough proportions by age group (Fig. 4 through Fig. 7) is the data file vbtcirates.xlsx, found on the Minnesota Department of Health (MDH) web page: https://www.health.state.mn.us/diseases/coronavirus/stats/vbtcirates.xlsx . This data file gives the rates per 100k of cases, hospitalizations, and deaths in full vaccinated and not fully vaccinated people, broken out by age group. The rates per 100k in vbtcirates.xlsx are converted into cases, hospitalizations, and deaths by multiplying by the appropriate population. The number of vaccinated people by age group can found on the Vaccine Data page, https://mn.gov/covid19/vaccine/data/index.jsp , in the data file People Vaccinated by Age. The unvaccinated population is found by taking the US Census American Community Survey 5-Year Estimate (Data Table S0101, https://data.census.gov/cedsci/table) and subtracting the vaccinated population. The breakthrough proportion is then found by dividing the breakthrough events by the total of the breakthrough and non-breakthrough weekly events.
- MDH defines a breakthrough event as a Covid case, hospital admission, or death that occurs 14 or more days after completing the vaccination series (not including boosters).
- Fig 1: New breakthrough cases announced on 2/14/2022 total just 18,178 cases. This seems surprisingly low, especially since this time period was the peak of the Omicron surge. We speculate that the recently announced backlog of cases, and the corresponding longer time required to publish new cases, is causing the matching of new cases to vaccination records to lag as well. See our post here https://healthy-skeptic.com/2022/02/11/event-processing-lags/ for information about the increasing lag in reporting cases in recent weeks. If we are correct we should see higher proportions of breakthrough cases announced in the next several weeks.
- Fig. 2 and Fig. 3, Overall Breakthrough Proportions: The overall proportion of breakthrough cases was slightly lower at 57.7% of total cases for the week starting 1/09/2022. The proportion of breakthrough hospitalizations rose to a new record of 45.5% of all hospitalizations, while breakthrough deaths rose to a new record of 52.8% of the total weekly deaths. If our speculation about the lag in identifying breakthrough events in Note 6 is correct then it is possible that these percentages will be revised higher in future weeks.
- Fig. 4 through Fig. 7: Breakthrough Proportions by Age Group: The breakthrough proportion of cases were generally slightly lower in each age group for the week of 1/09/2022. The breakthrough proportion of hospitalizations is generally trending higher in all the age groups as well. It will be important to see if the suspected reporting lag of breakthrough cases also causes a lag in reporting breakthrough hospitalizations and deaths as well, as would be expected.

Government should be ashamed of itself for the shoddy data collection and reporting. It’s gotten to the point where even if it’s true an accurate I still think it’s wrong and skewed by incompetence. Dave has our thanks for making the best of it.
Often left out of the conversation regarding 65+ deaths is who are the remaining unvaccinated in this cohort. According to MDH 93% of 65+ have completed the vaccine series. So who are these 7% of rogue reluctant vax holdouts? Are they a group of rabid anti-vax super Trumpers? Or is it more likely that many in this cohort are too sick/frail to tolerate vaccination? Using deaths of unvaccinated among 65+ to bolster claims of vaccine efficacy without additional information about the unvaccinated 7% tells an incomplete and likely wildly inaccurate story.
I think it is undoubtedly the case that many older persons who are unvaxed simply aren’t good candidates for vax, and therefore also extra susceptible to CV-19.
My husband and I are part of that crazy 65+ unvaxxed cohort. We are healthy people who contracted covid and were treated with early therapeutics. I know of four others who did the same.
Crazy people. There are a lot of us healthy, vaccine skeptical seniors out there willing to take the risk and take the medications that are tried and true. To each his/her own.
I agree