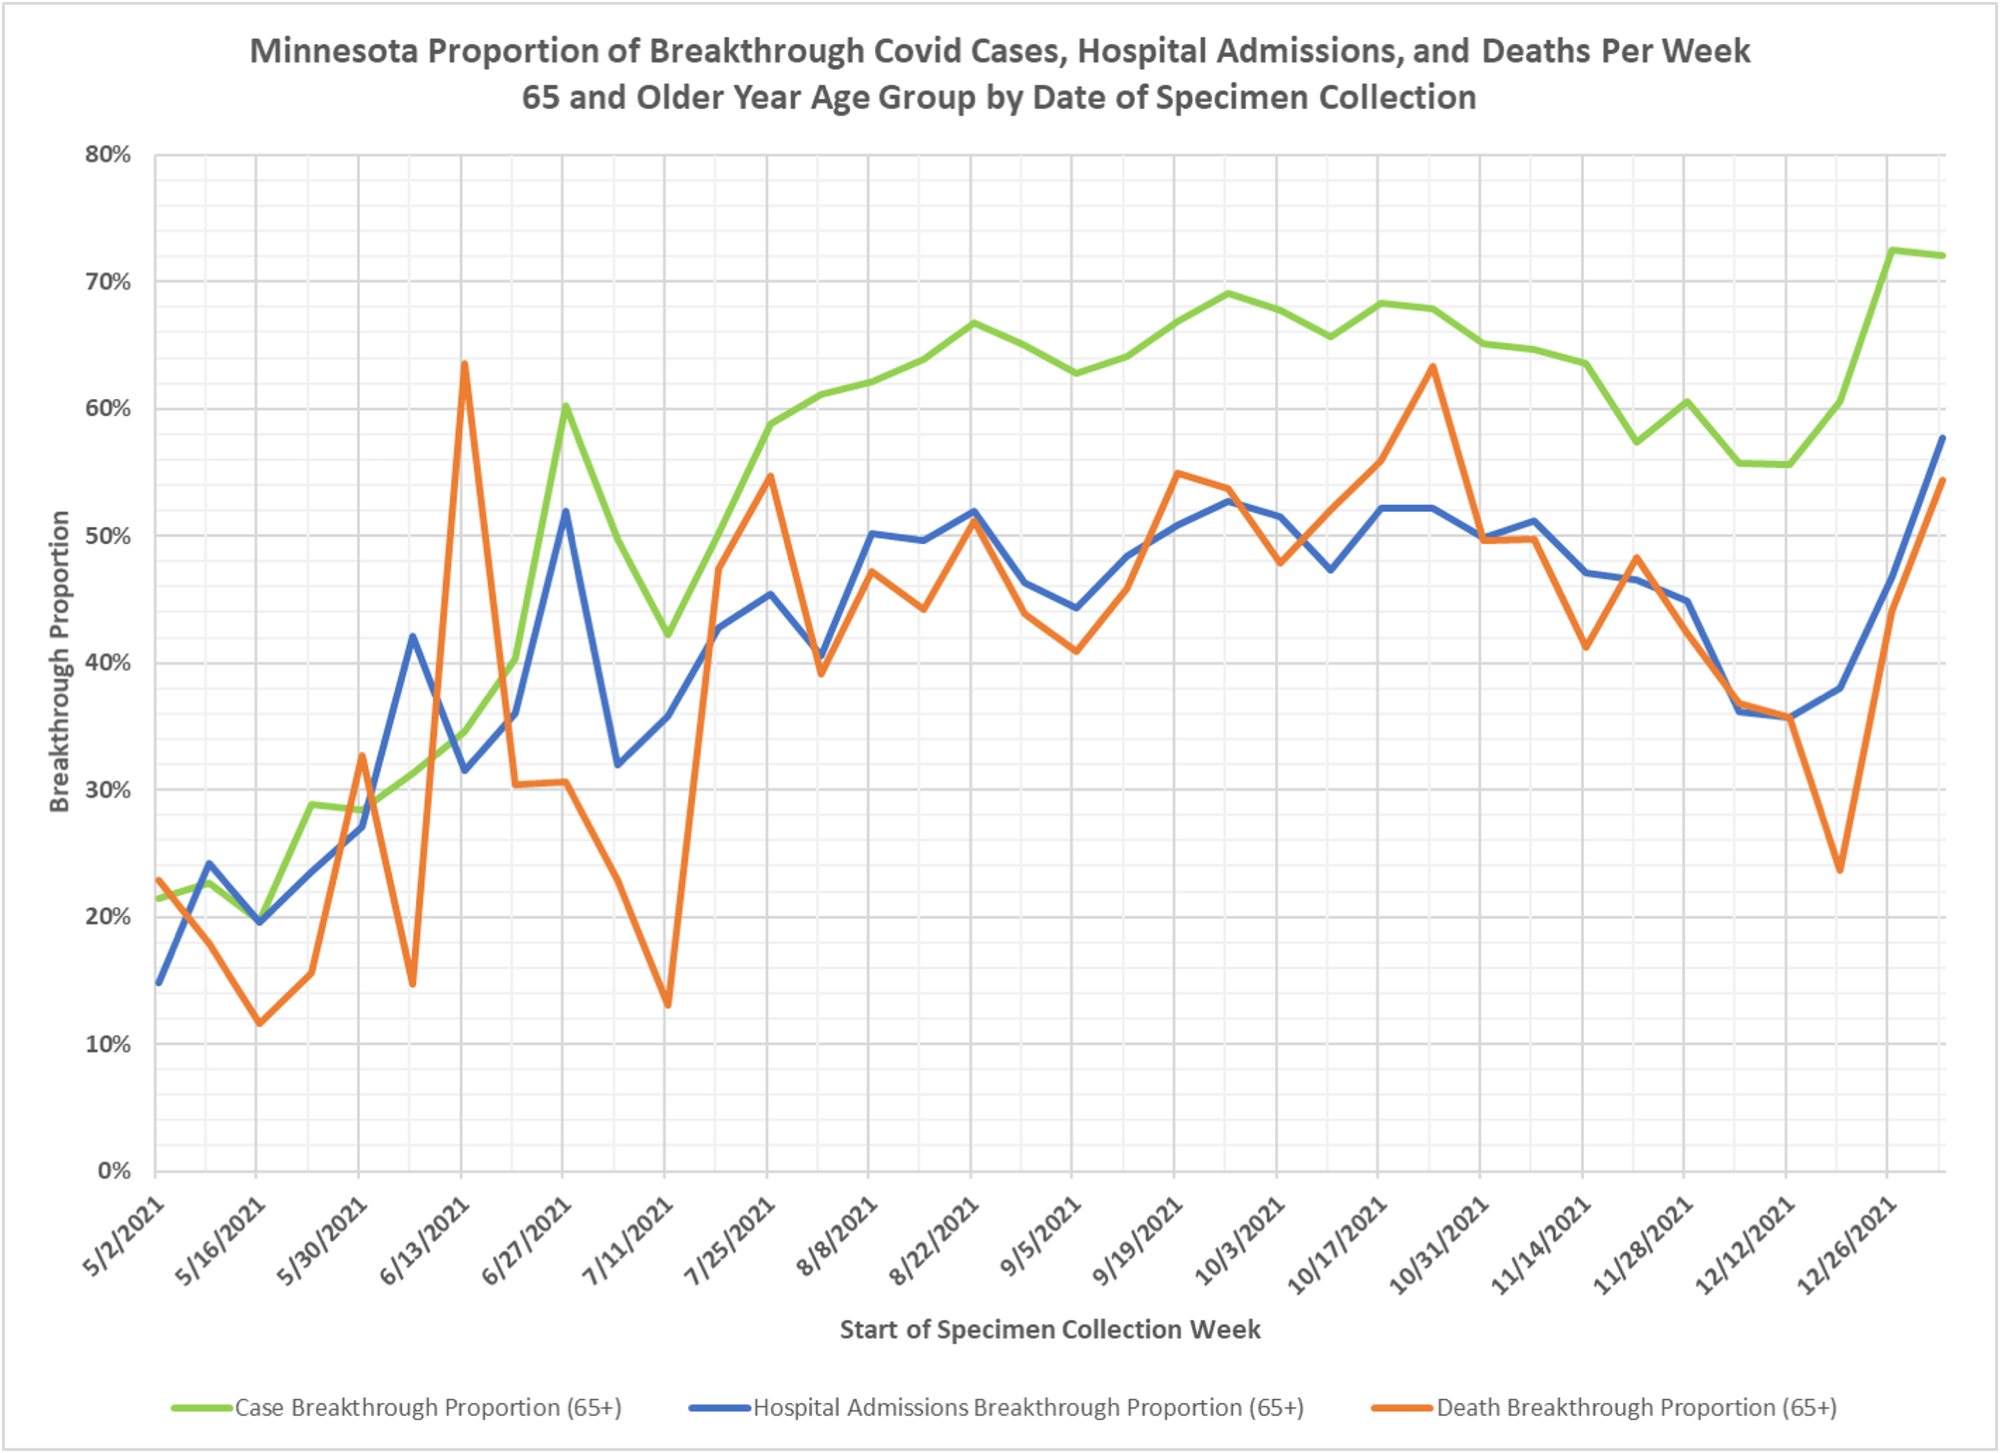
As promised the full set of tables and charts. One table just shows what is reported each week, the other table shows events by the week they occurred. You will note the significant lag in the second table, due to DOH processing times. Over 45,000 cases, 800 hosps and 150 deaths in the vaxed reported this week. First table just shows what DOH reports each week and mostly indicates how processing flops around. The second table gives events by week and shows the proportion. As I keep saying, by now we are well past the majority of reported events being in the vaxed. And look at the chart for the over-65 age group, all events are already now majority in the vaxed. Usual caveats about incomplete identification about who is vaxed and lack of identification of the prior infected. Dave Dixon’s notes:
- The table and charts are updated for new data released by Minnesota Department of Health (MDH) on 1/31/2022, adding data for the week starting 1/02/2022. This week was nearing the peak of the Omicron surge, which occurred in Minnesota on 1/10/2022.
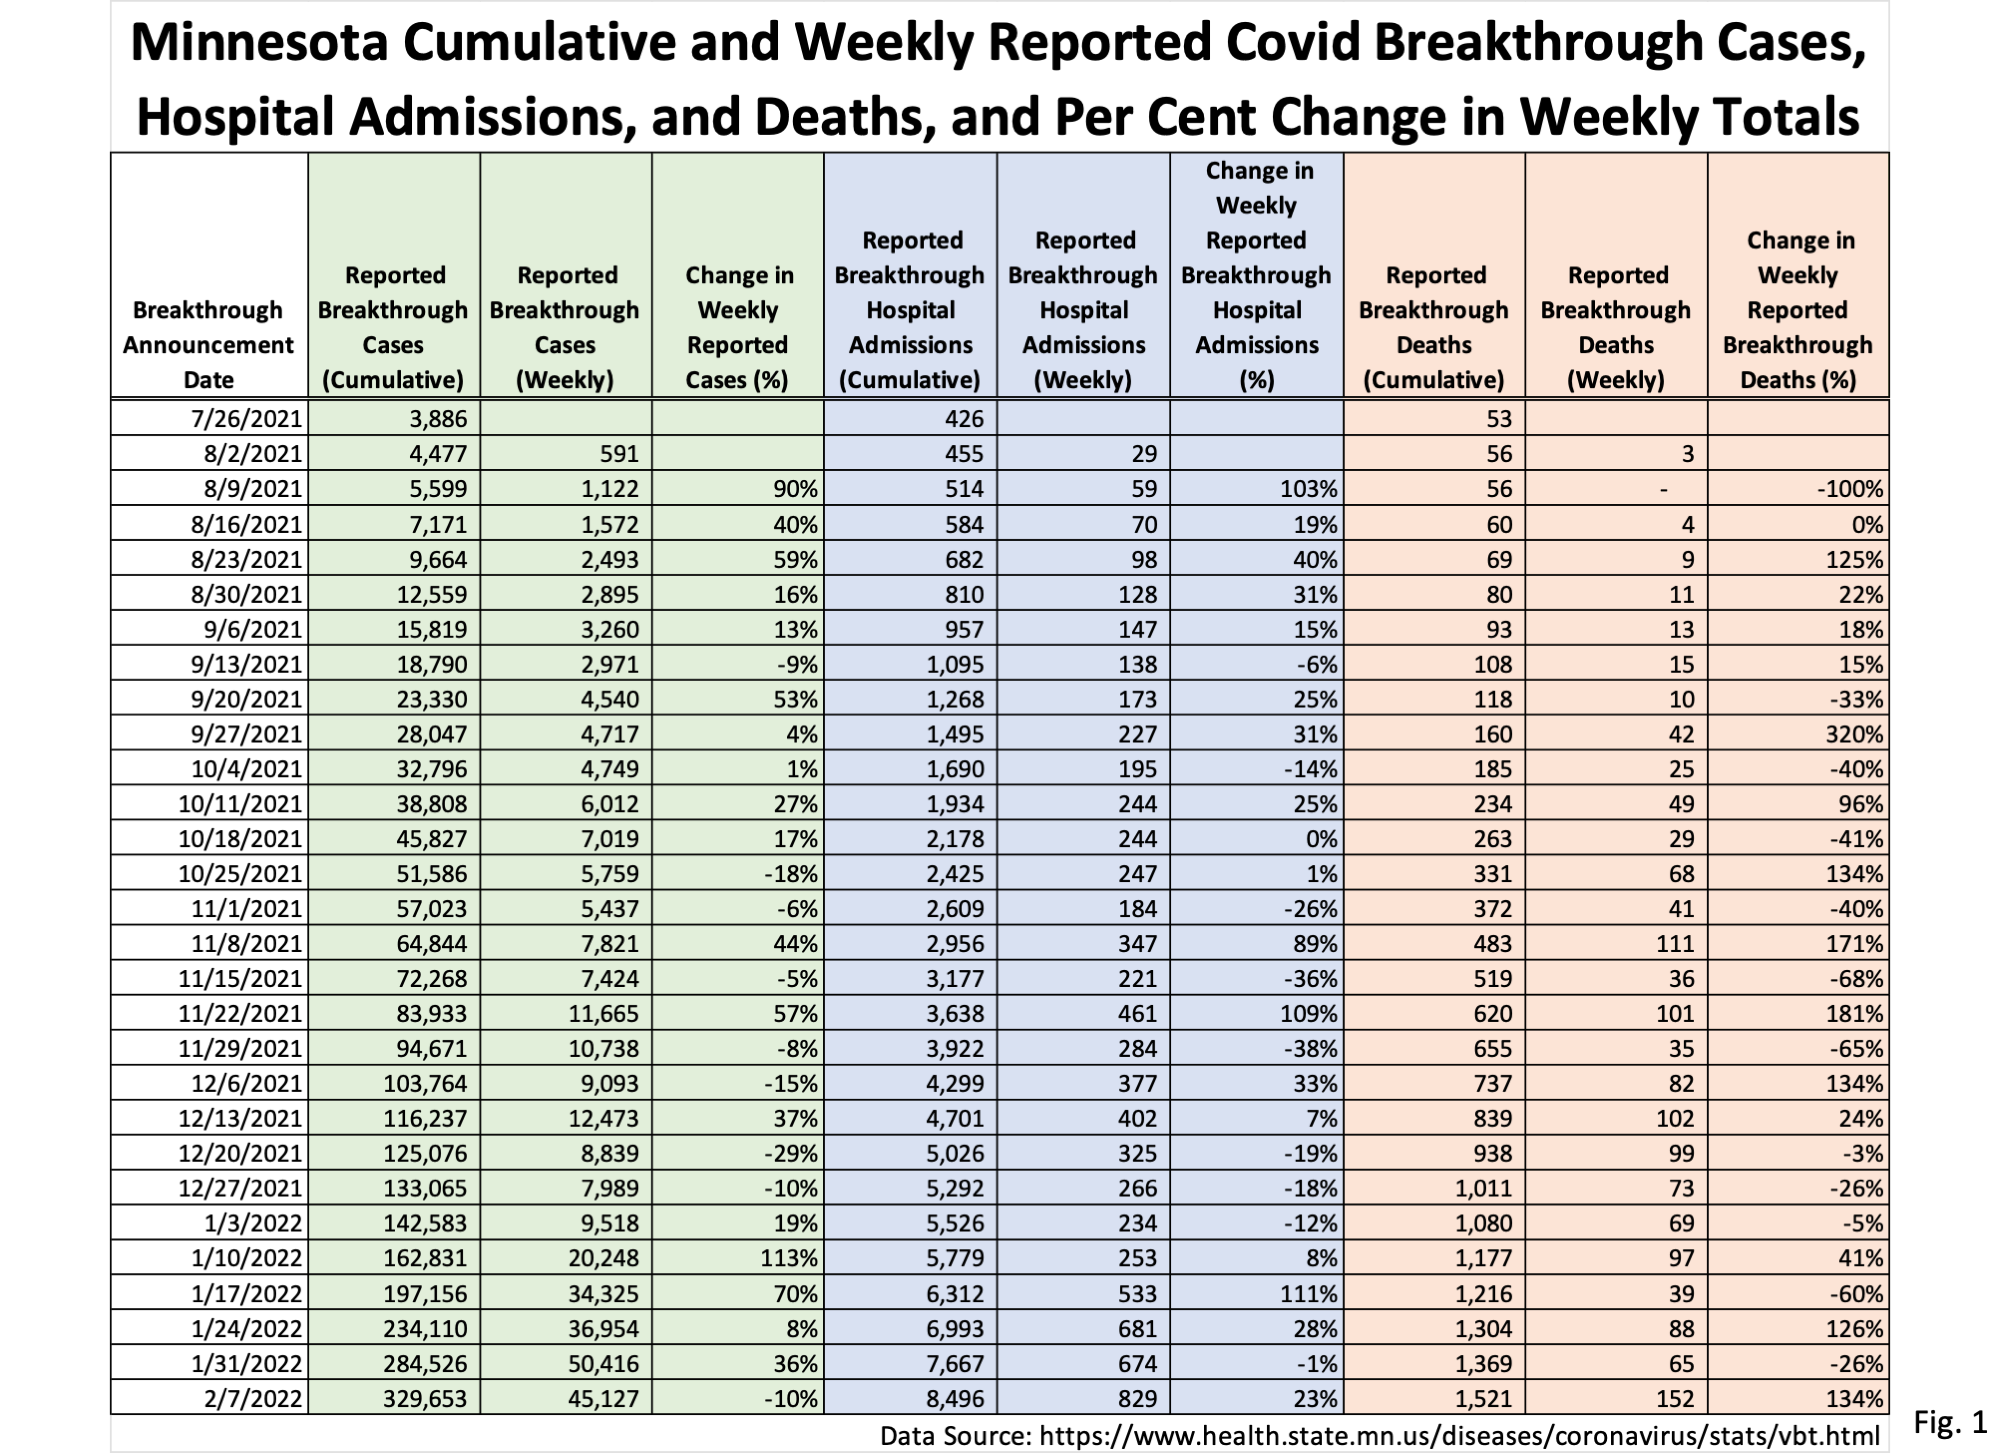
- The data source for the data on Fig. 1 is the cumulative breakthrough cases, hospitalizations, and deaths published on the MDH COVID-19 Vaccine Breakthrough Weekly Update https://www.health.state.mn.
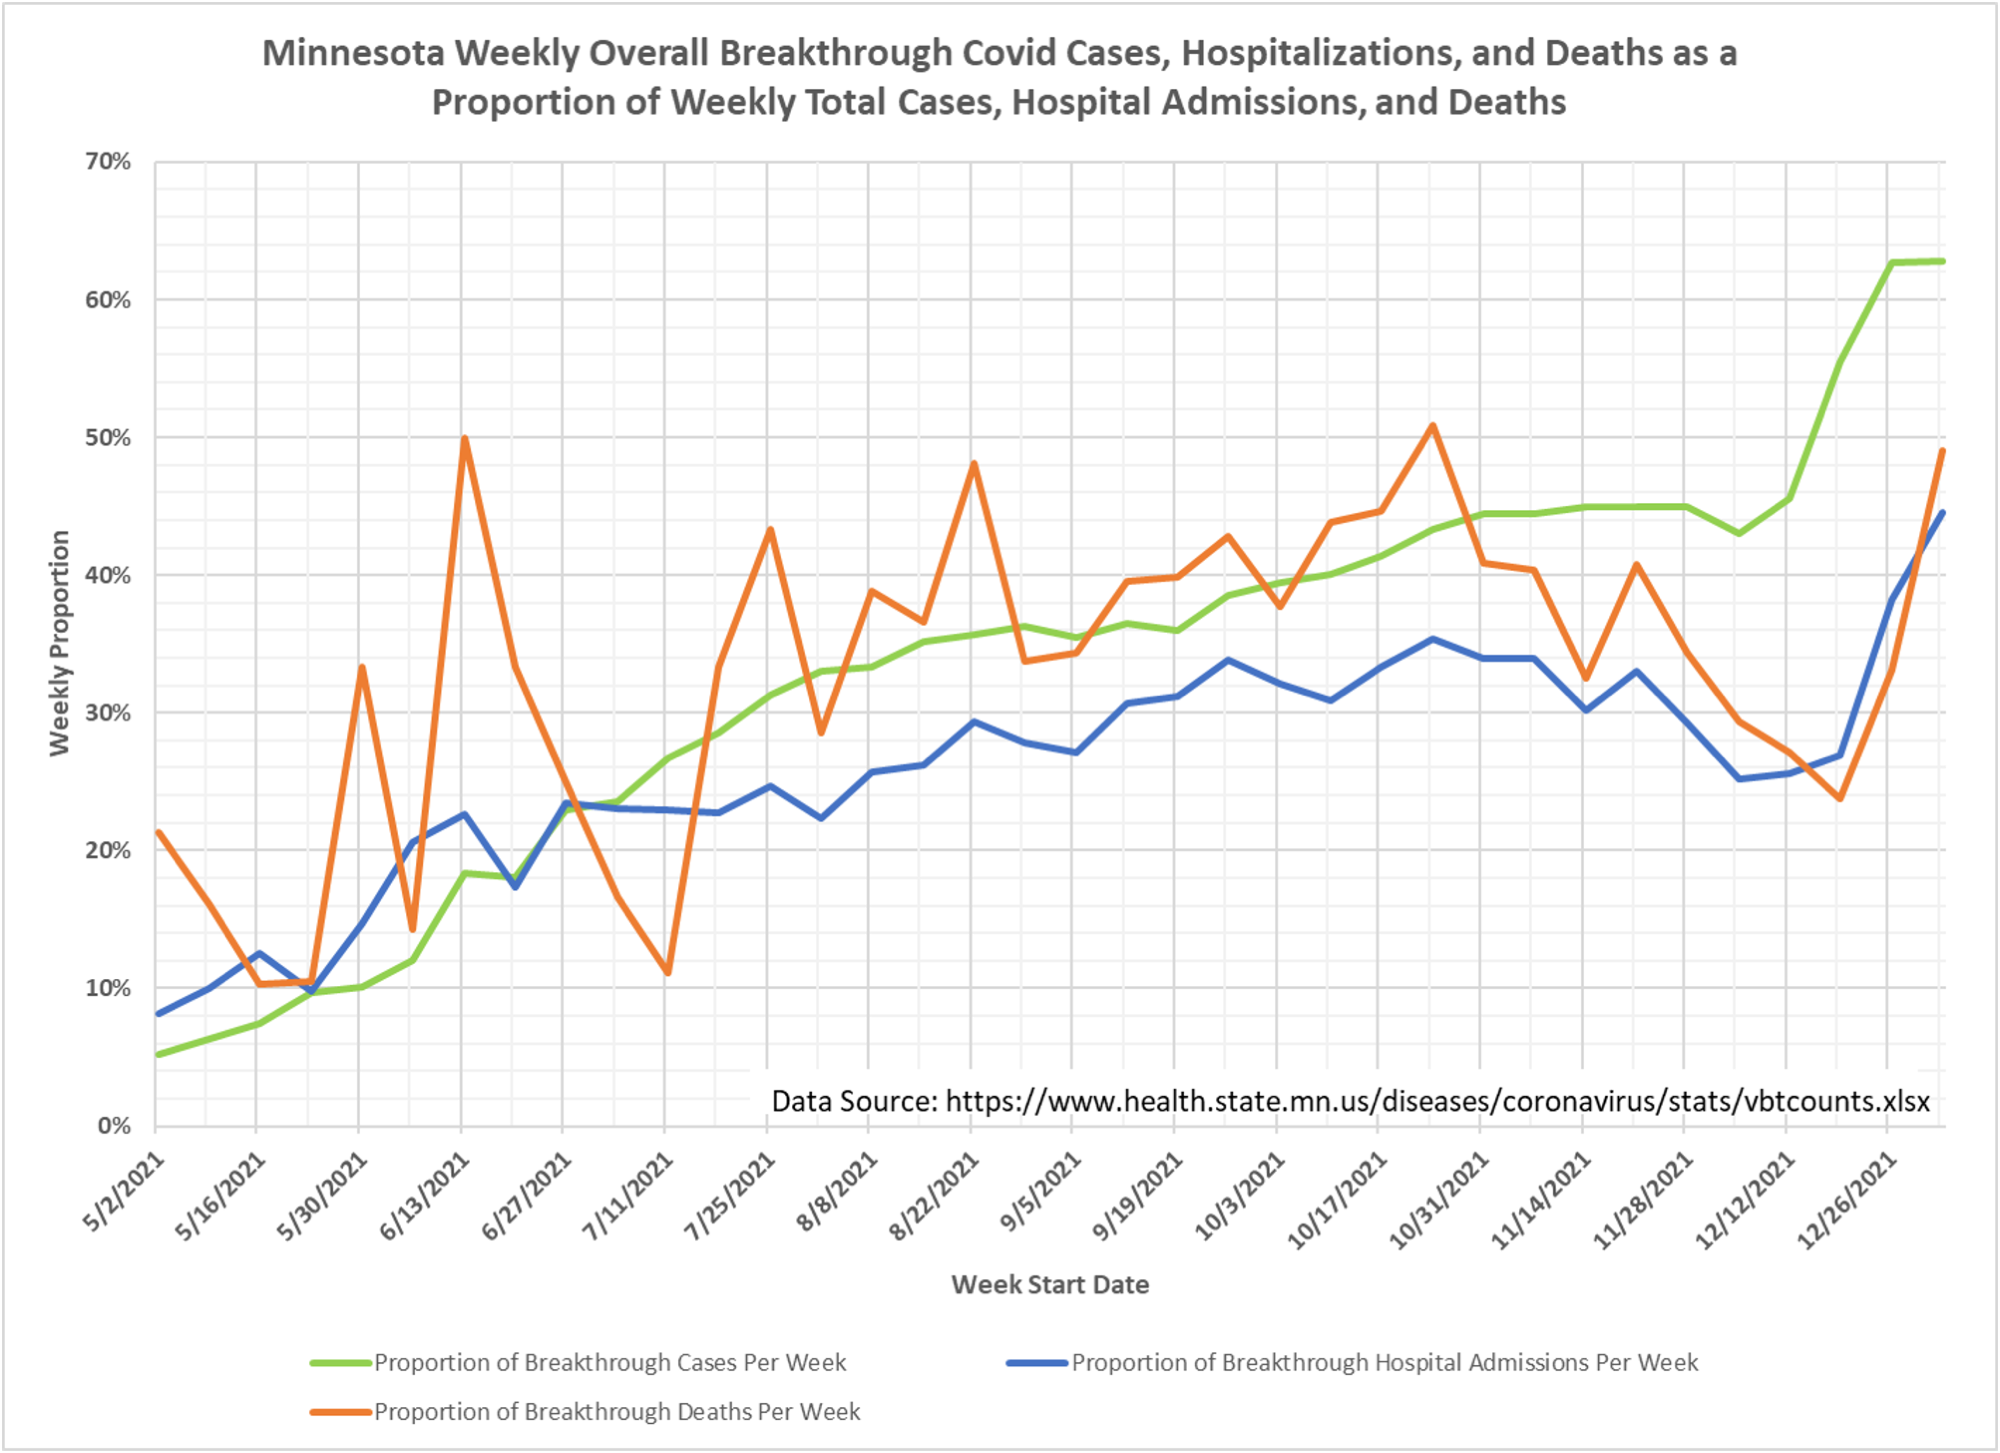
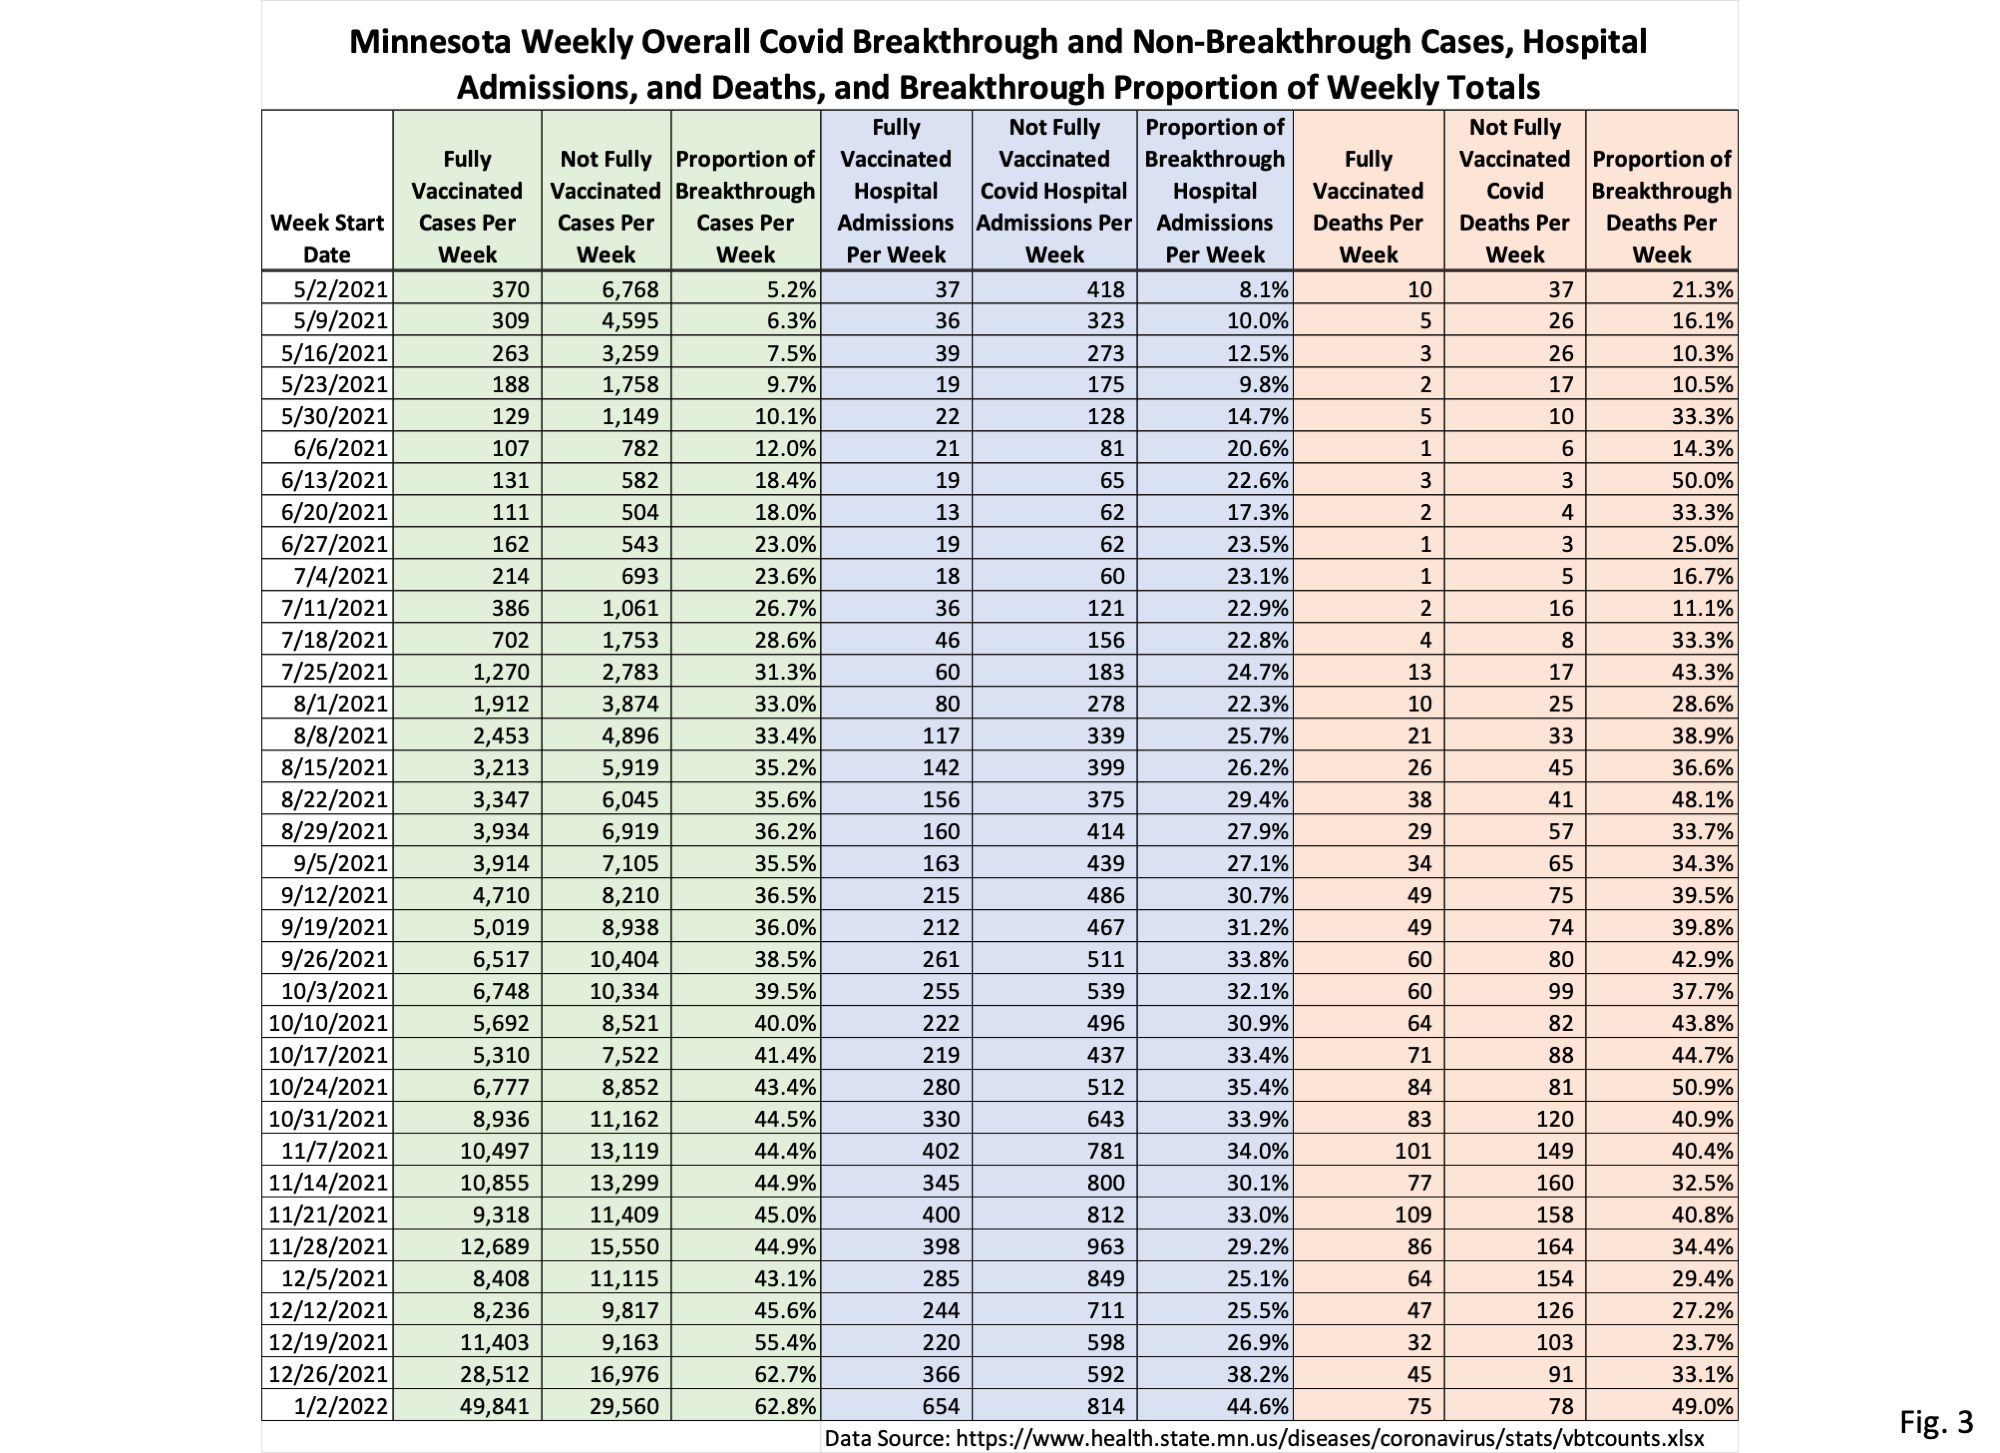
us/diseases/coronavirus/stats/ vbt.html - The data source for Fig. 2 and Fig. 3 is the data file https://www.health.state.mn.
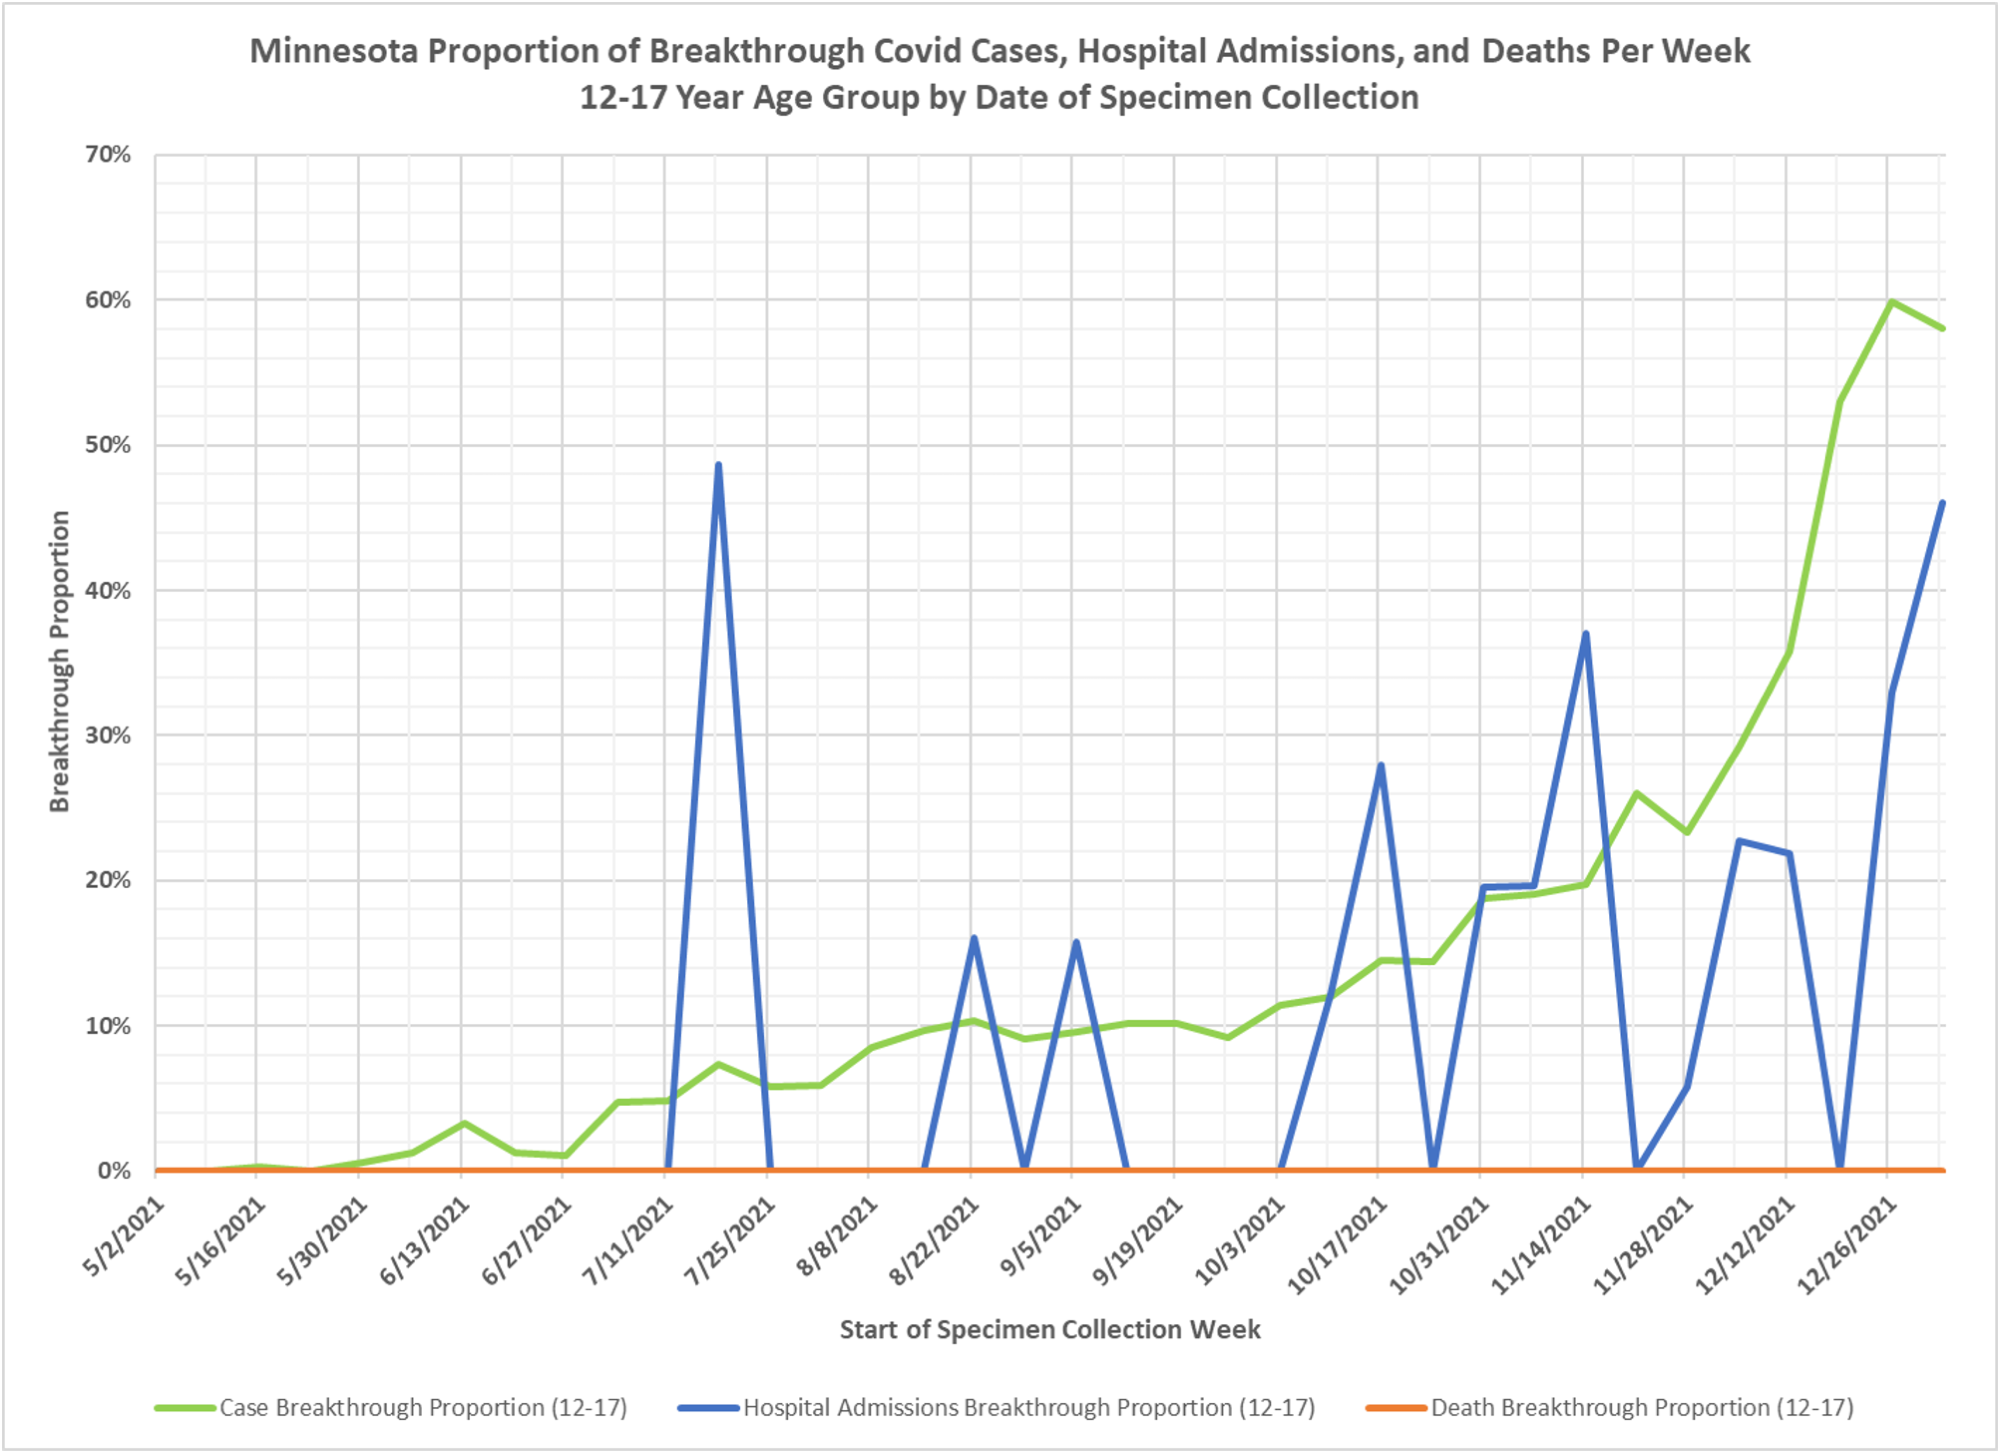
us/diseases/coronavirus/stats/ vbtcounts.xlsx found on MDH web page https://www.health.state.mn. us/diseases/coronavirus/stats/ vbt.html. The data provided in the data file vbtcounts.xlsx is used without modification, other than to sum the weekly events and compute the breakthrough proportion. Vbtcounts.xlsx provides breakthrough and non-breakthrough cases, hospital admissions, and deaths for each week listed. - The data source for the breakthrough proportions by age group (Fig. 4 through Fig. 7) is the data file vbtcirates.xlsx, found on the Minnesota Department of Health (MDH) web page: https://www.health.state.mn.
us/diseases/coronavirus/stats/ vbtcirates.xlsx . This data file gives the rates per 100k of cases, hospitalizations, and deaths in full vaccinated and not fully vaccinated people, broken out by age group. - The rates per 100k in vbtcirates.xlsx are converted into cases, hospitalizations, and deaths by multiplying by the appropriate population. The number of vaccinated people by age group can found on the Vaccine Data page, https://mn.gov/covid19/
vaccine/data/index.jsp , in the data file People Vaccinated by Age. The unvaccinated population is found by taking the US Census American Community Survey 5-Year Estimate (Data Table S0101, https://data.census.gov/ cedsci/table) and subtracting the vaccinated population. The breakthrough proportion is then found by dividing the breakthrough events by the total of the breakthrough and non-breakthrough weekly events. - MDH defines a breakthrough event as a Covid case, hospital admission, or death that occurs 14 or more days after completing the vaccination shots (not including boosters).
- Fig 1: New breakthrough cases announced on 1/02/2022 total 45,127, just below last week’s record high in breakthrough cases. The newly reported breakthrough hospitalizations of 829 were a new record high, as well as the 152 breakthrough deaths.
- Fig. 2 and Fig. 3, Overall Breakthrough Proportions: Breakthrough cases surged to the highest level seen, at 62.8% of total cases for the week starting 1/02/2022, just greater than the prior week’s percentage of 62.7%. The proportion of breakthrough hospitalizations rose 44.6% of all hospitalizations, while breakthrough deaths rose to 49.0% of the total weekly deaths. When looking at past weeks data we can see that there have been many revisions to breakthrough and non-breakthrough deaths in this week data file. For example, fully vaccinated deaths for the week of 5/02/2021 rose from 8 to 10, for the week of 6/13/2021 rose from 0 to 3, and for the week of 6/20/2021 rose from 0 to 1, among many other revisions. In total 30 fully vaccinated deaths were added prior to the week of 11/07/2021.
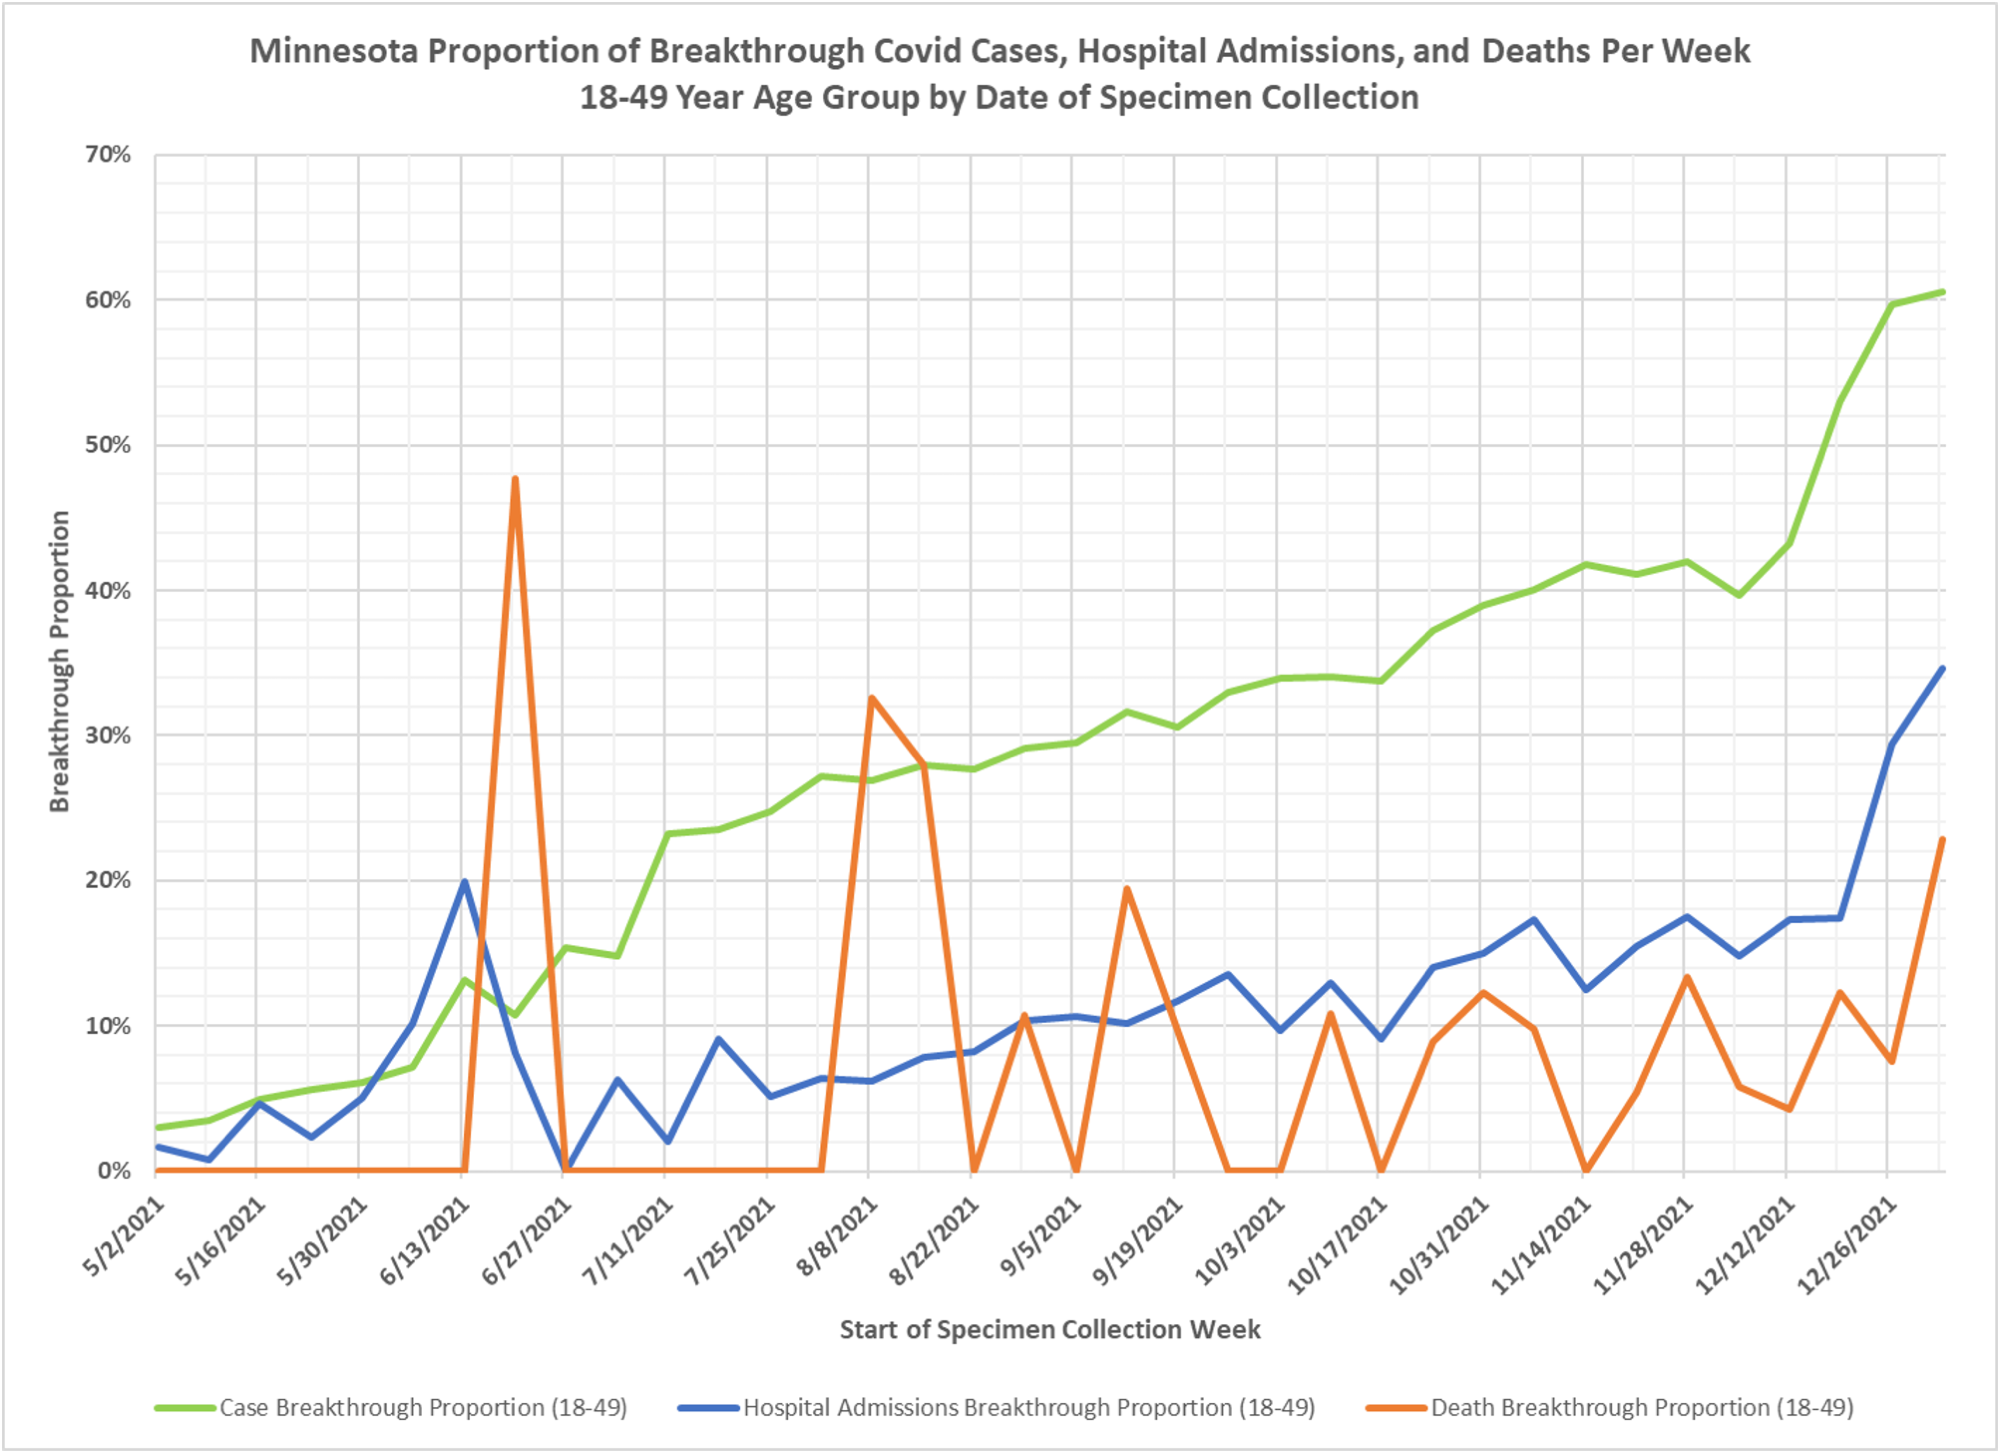
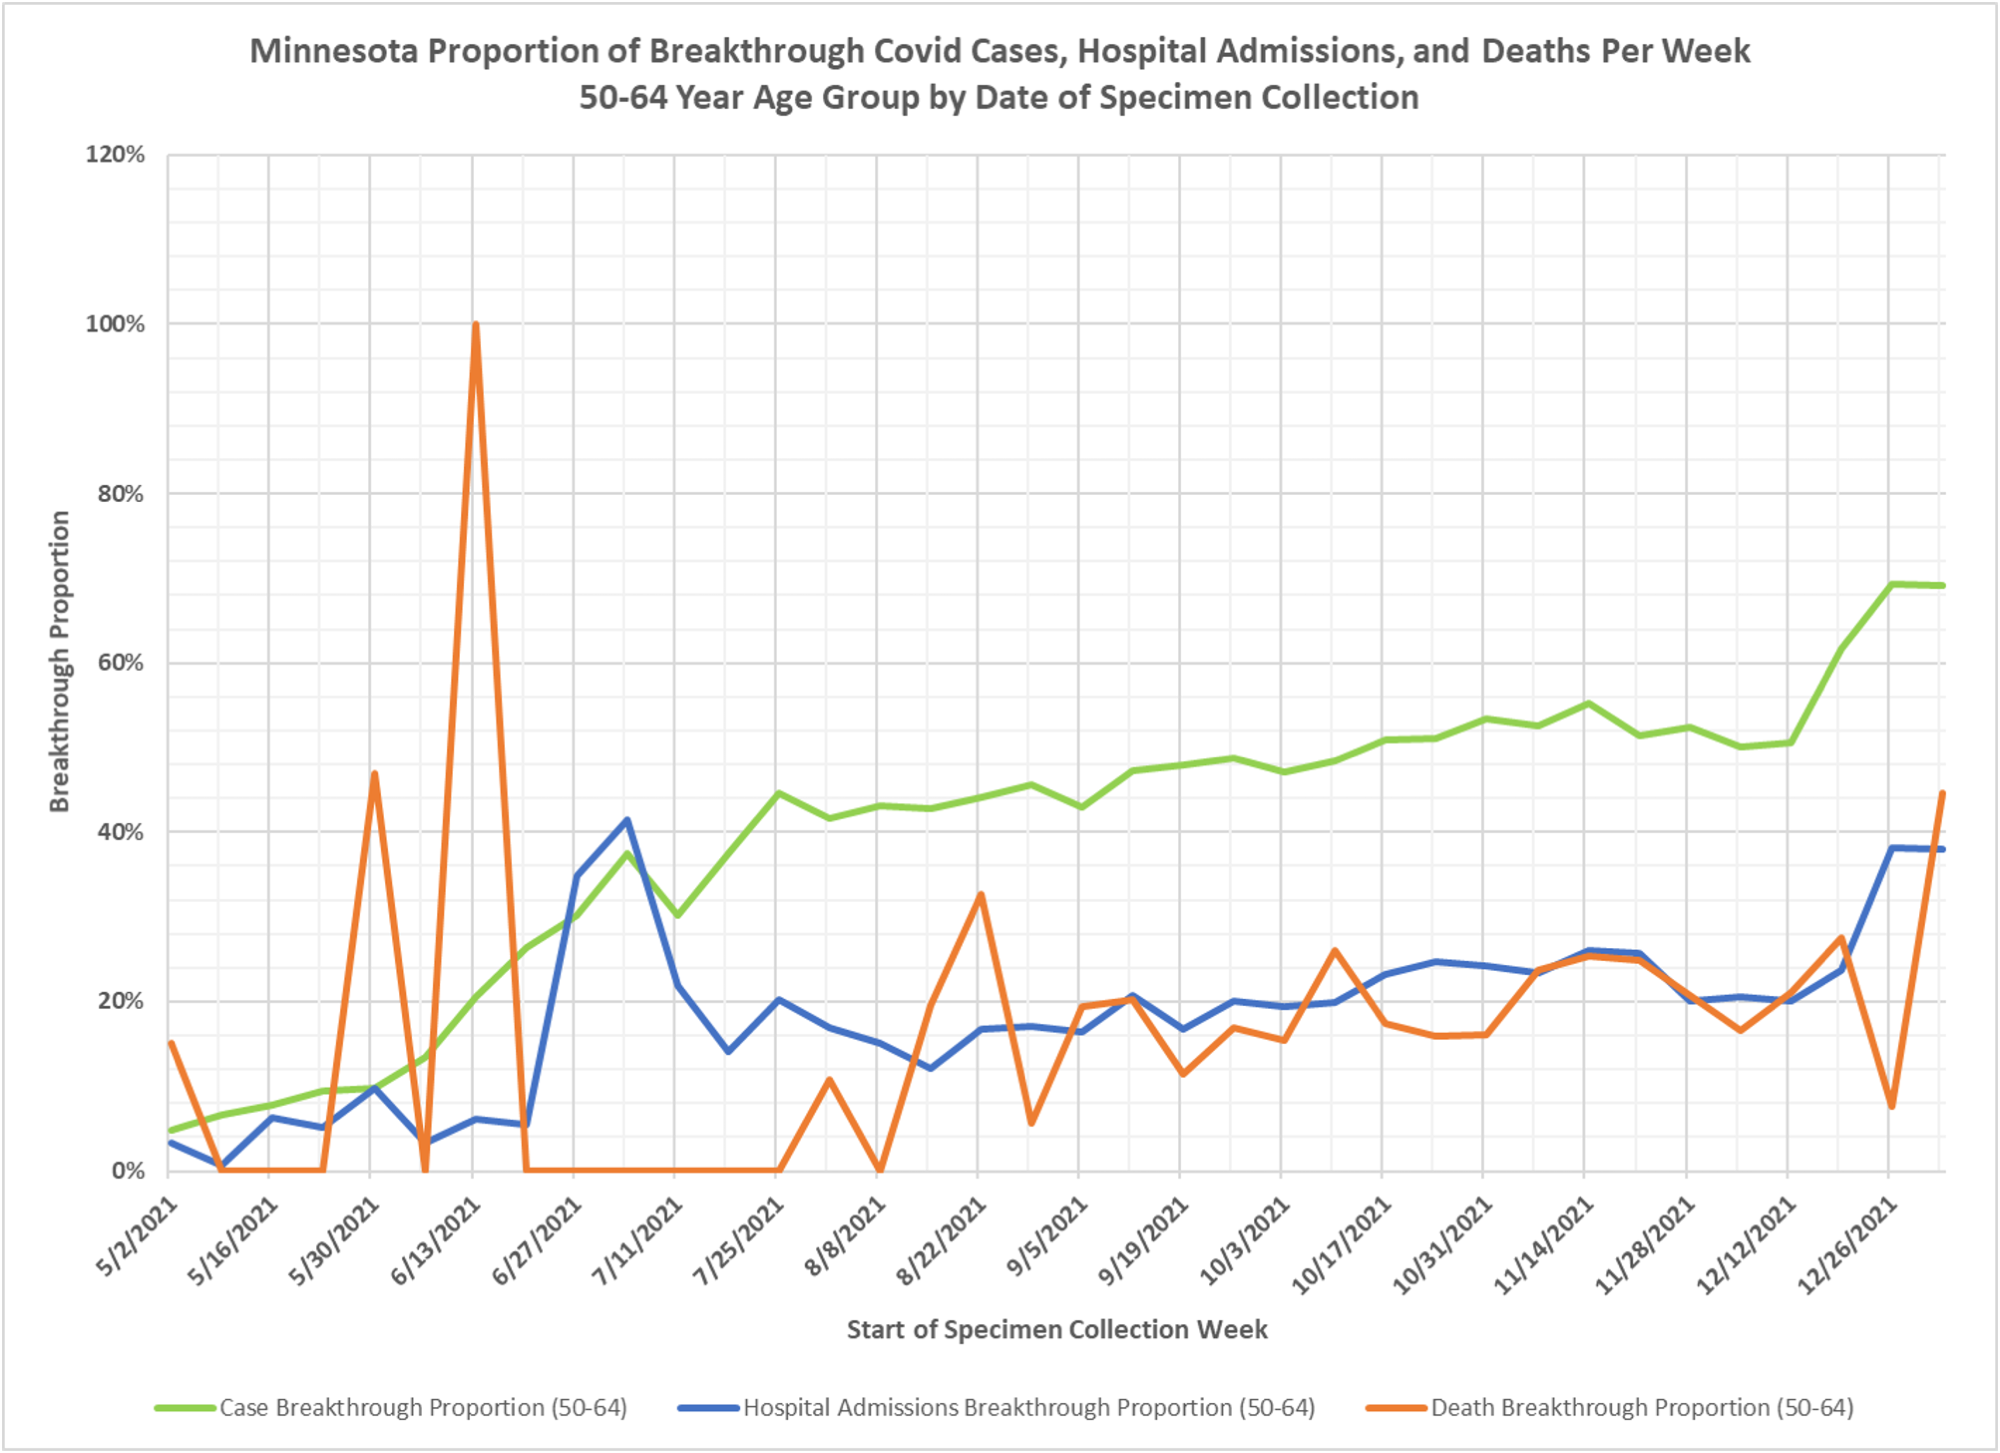
- Fig. 4 through Fig. 7: Breakthrough Proportions by Age Group: The breakthrough proportion of cases in each age group were close to unchanged over the prior week as breakthrough proportions of hospitalizations and deaths continue to increase in each age group. By comparing these charts to the versions published last week here https://healthy-skeptic.com/
2022/02/01/breakthrough- events-january-31/the detail changes to prior weeks, especially in the death rates for the 50+64 and 65+ age groups, can be seen.

Slowly, slowly, the truth begins to emerge in Minnesota. If you want to fast forward your knowledge, I suggest you look elsewhere.
I do a weekly digest of the UKHSA reporting on data from England where, for several weeks straight individuals with exactly 2 doses of mRNA have worse outcomes across the board (including hospitalization and death) than do those with no injection at all, and outcomes for boosted individuals are getting worse by the week, to the point that boosters will soon be unable to hide the damage: https://noline.substack.com/p/ukhsa-week-2022-05
Or check out the bad cat’s analysis of Israel vs. Palestine outcomes – https://boriquagato.substack.com/p/are-aggressive-vaccination-campaigns – or my comparison of Israel and Sweden – https://noline.substack.com/p/israel-vs-sweden.
The bottom line is, if Minnesota is truthful, its data will converge on the good data nations like Denmark, UK, and Israel. Human biology is the same everywhere.
your anti-vax bias is showing again and leads to only looking at things that confirm that bias and ignoring everything else, so your credibility is about zero. the more important case and per capita rates show very, very strong effectiveness against hosp and death.
natural immunity is like a full defensive team … linebackers, corners and a free safety … they all get a shot at stopping the virus … the shot (treatment) is just a free safety and the alpha and delta variants had no blockers so it could usually take down the runner … now with omnicron there are blockers and the free safety can’t get a clean shot at the runner … this was always the case and the medical community deluded everyone into thinking their wonder shot was as good as a full defensive team … I say deluded but really mean “lied” …
the fact is FROM THE START there was a high percentage of people who had a full defensive team against corona … the asymptomatic and those that NEVER caught covid even when exposed to a huge amount of the virus … (Princess Cruise ship “experiment”) … the fact that the medical community could never explain it is one of the great failings (among many) of our “expert” medical community … their “expertise” is a mile wide and a millimeter deep … i.e. almost useless …
actually Omicron’s greater transmissibility is due more to inherent receptor binding capabilities than it is to immune evasion
Thank you Kevin for all you are doing and to Dave for all the graphs and tables. Allow me to make one suggestion for improvement. In the tables, the most recent date should be at the top of the table, not at the bottom. I ran into this issue at work with info pertaining to our company, as the data grew with time we had to scroll further down the page, and then more than one page. I made the same suggestion to my work. Mostly people are interested in the most recent data. Making them scroll for it is not efficient. And also Thank You for answering the few emails I have sent to you.
Kevin, I’m sorry you have to label people, but it’s obvious from your comment that you haven’t looked at the UK charts, which is a bit sad. It is obvious because you are still stuck in an infinite loop of claiming that people you don’t agree with don’t understand per capita rates.
Are you aware that in England people with only dose 2 have worse hospitalizations PER CAPITA and worse deaths PER CAPITA than do unvaccinated people, by something like 2X? At least have the courtesy to read and internalize the point before you launch into name-calling about credibility.
I’ll restate the question again, because generally you just swipe me away by labelling me “anti-vax” or saying “you are dumb and have low credibility”. Restating it so we can see if you actually answer it: “Are you aware that people with only dose 2 have worse hospitalizations PER CAPITA and worse deaths PER CAPITA than do unvaccinated people?”
I have read, and I mean read, not cherrypicked a part that confirms my beliefs, every UK vaccine surveillance report, and other relevant UK data and studies, including actually reading the methodological notes and blog posts. It doesn’t say what you and others are trying to make it say. You are literally making stuff up, but again, we know that you don’t want to get vaccinated, which is fine, but stop lying to yourself and others about what the research and data say. If you are vaxed, your risk of hosp or death if you get infected is far, far lower than if you are unvaxed.