Now we are on really dangerous ground, trying to assess relative rates of infection based on pretty poor data. But as usual Dave Dixon makes a heroic effort. The chart below pretty clearly shows that being infected is more protective against infection than being vaxed. The combination, according to research, is yet more protective. As I say over and over, what would be really helpful is to know for each person dates of each infection, if any, and date of each vaccination, if any. Then we could break groups out and avoid confounding overlaps of people who are infected also being vaxed. Right now, there definitely is overlap, and we don’t have the information to remove it. So this is a preliminary effort, but I believe directionally accurate. Dave’s notes on methods are below:
Comments, Sources, and Methods:
1. On 11/2/2021 Minnesota Department of Health (MDH) started publishing Covid reinfection data on the Minnesota Situation Update for COVID-19 web page: https://www.health.state.mn.us/diseases/coronavirus/situation.html Reinfections are defined as a person testing positive for Covid more than 90 days after a prior positive test.
2. “Confirmed” reinfections are defined as a positive PCR test following a positive antigen test. Probable is defined as a negative PCR test following a positive antigen test. It is implied, similar to case reporting by the state, that a PCR positive test is considered “Confirmed” and a positive antigen test is considered “Probable”. For purposes of this analysis all Confirmed and Probable reinfections will be included.
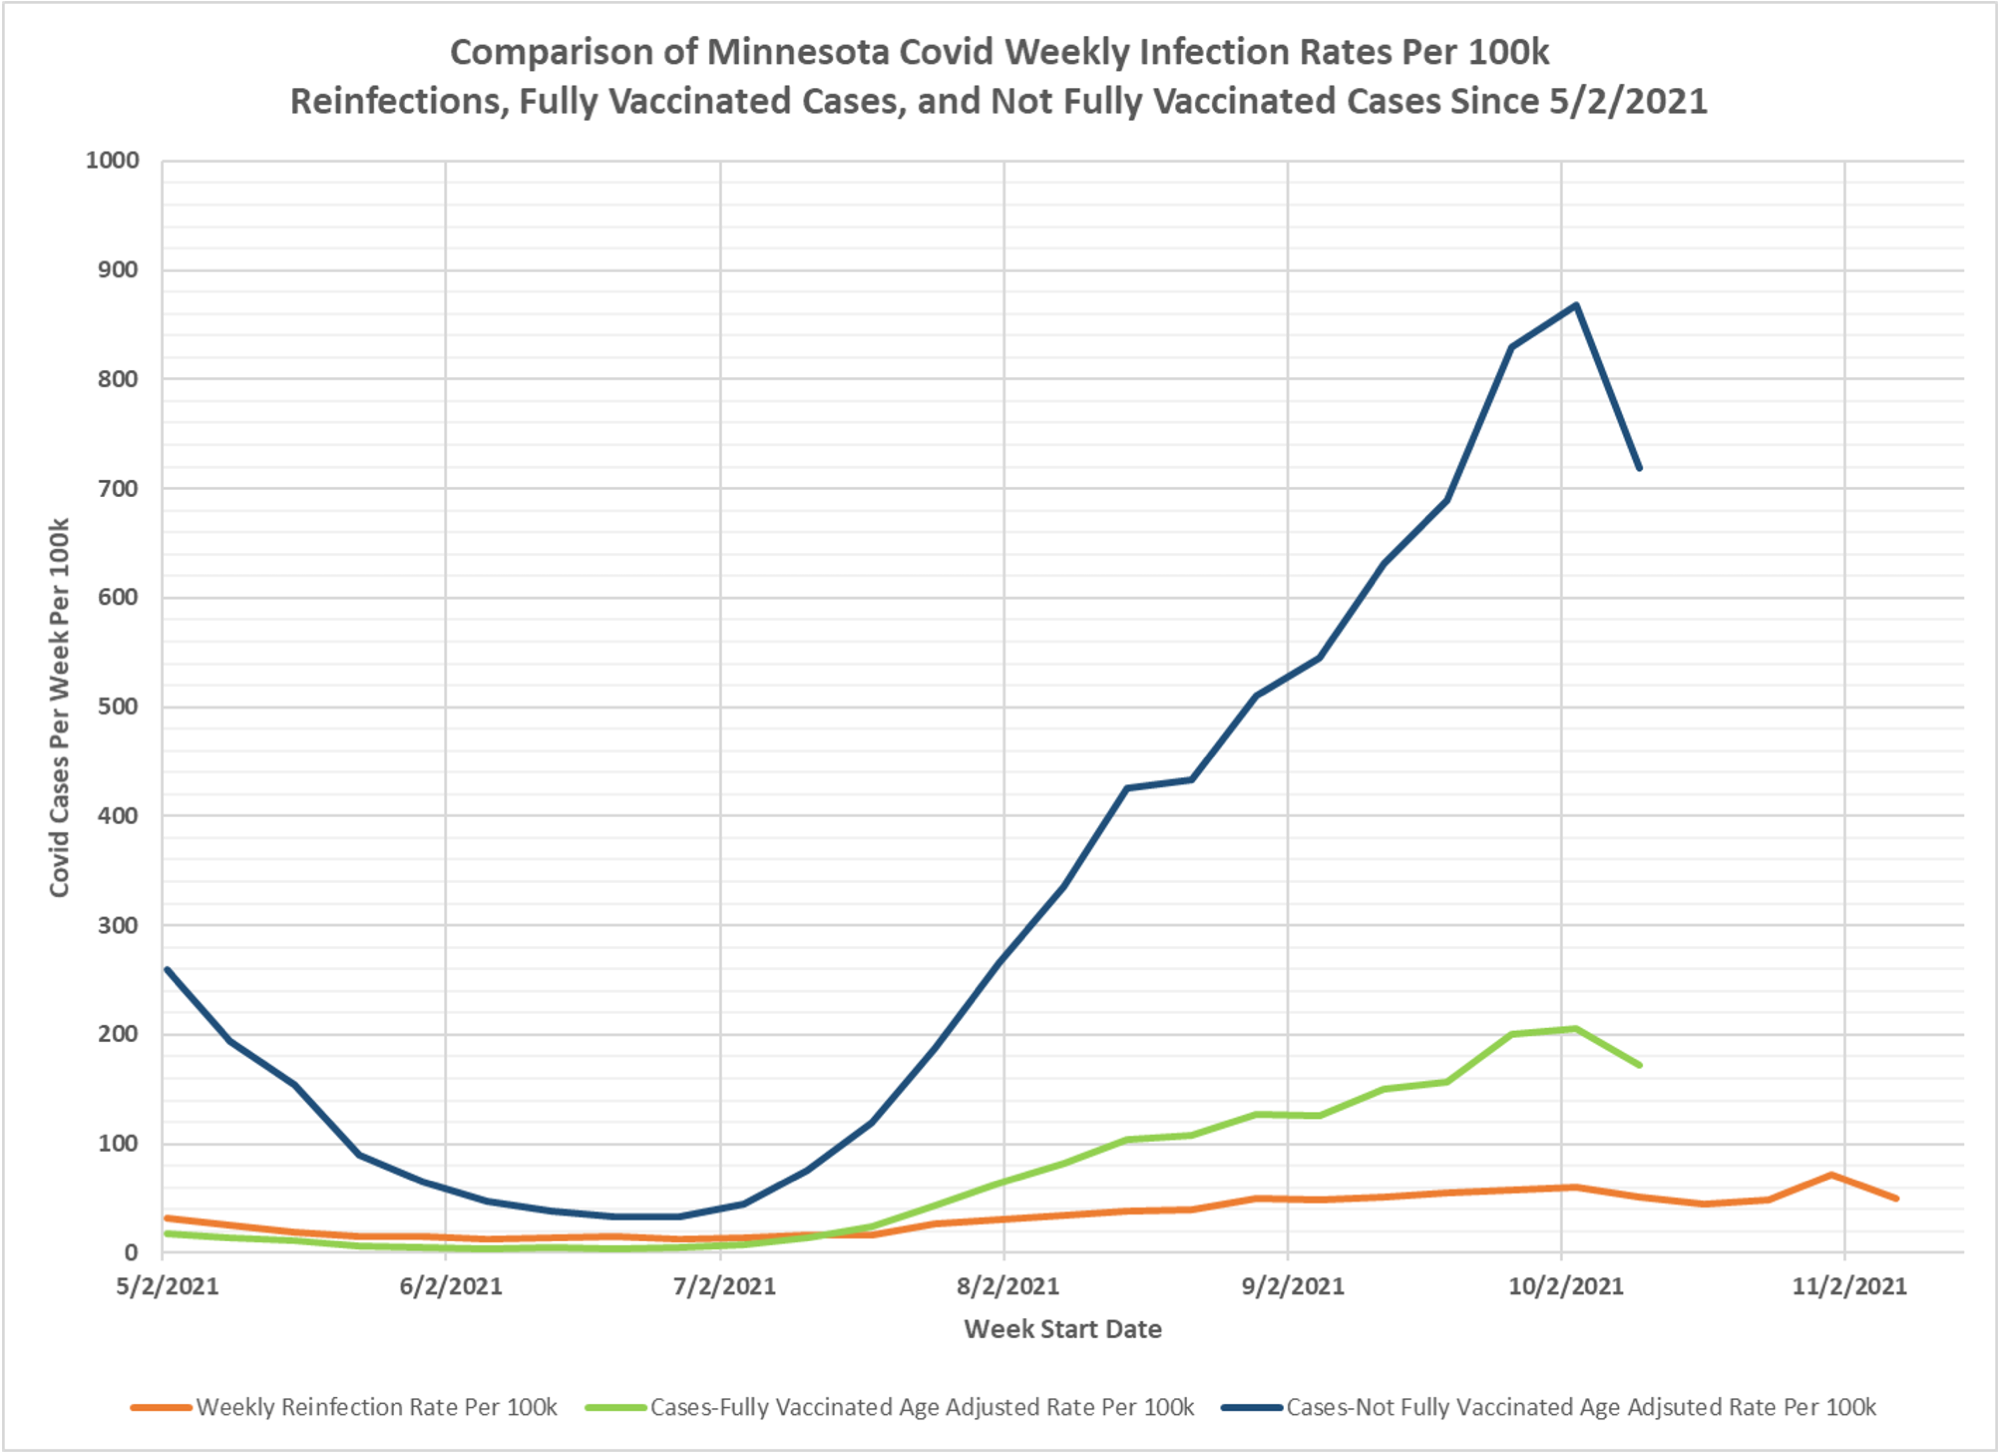
3. The weekly Covid reinfection rate displayed on the chart is calculated as the number of weekly reinfections (confirmed and probable) divided by the cumulative Total Positive Cases 90 days prior to the start of the week being considered, and the result multiplied by 100k to yield the reinfection rate per 100k per week. This is the red curve on the chart.
4. The Fully Vaccinated Age Adjusted Case Rate Per Week (green curve) and Not Fully Vaccinated Age Adjusted Case Rate Per 100k (blue curve) are taken directly without modification from the Vaccine Breakthrough Report https://www.health.state.mn.us/diseases/coronavirus/stats/vbt.html from the data file for Cases, Hospitalizations, and Deaths Over Time graphic (vbtaarates.xlsx linked on this page).
5. Data is plotted starting 5/2/2021, the earliest date we have breakthrough data. Reinfection data goes back to 6/28/2020, but the earlier data is more variable possibly due to the smaller population of previously infected people.
6. We have no knowledge of what age adjustments performs in order to calculate the Age Adjusted Rates, and we have not yet submitted a formal query to MDH for this information.
7. It is likely that there are people who may have contracted a mild enough Covid infection that they did not seek medical attention or get tested, causing an undercount of the true number of breakthrough infections, non-breakthrough infections, and reinfections.
8. We do not know how thorough and comprehensive MDH’s process is in identifying reinfections or breakthrough infections.
9. The main purpose in generating this chart is to try to compare the relative infection rates for previously infected people to vaccinated people, and then to unvaccinated people. We can see that throughout the Summer of 2021 the three rates were all low, during the time period in Minnesota when Covid cases were very low in general. However, unvaccinated infection rates were always the highest of the three, and for several months the reinfection rate was higher than the vaccinated breakthrough rate. On 10/3/2021, the most recent date where we can be considered to have complete breakthrough case data, the reinfection rate was 60.4 per 100k, the vaccinated infection rate was 205.5 per 100k, and the unvaccinated infection rate was 867.9 per 100k. The ratios between these rates are an indicator of the relative risk of infection for the different classifications of the population. It might be concluded from these rates that natural immunity provides better immunity than vaccination, but the uncertainties and possible incompleteness of the underlying data is a cause for concern. Similarly, the lower infection rate of vaccinated people compared to unvaccinated people is a measure of the relative protection provided by vaccination, again with some uncertainties about the underlying data.

Quick question – data in the earlier posted table that shows the weekly breakthrough and non-breakthrough cases shows in the most recent week, around 40% of total cases occurring in the fully vaccinated cohort. This chart showing the weekly infection rate per 100k seems to indicate a much lower rate of infection among the fully vaccinated. I’m sure there is a simple explanation for this – could you educate me on how to reconcile the data in the 2 posts?
These data are useless if “covid cases” are being evaluated differently between vaccinated and unvaccinated. If CDC guidance is to use a difference PCR metric and higher standard for a vaccinated person to be labeled a “case” the above is just a giant waste of time. The only honest way to do the comparison is to take a large population of vaccinated and unvaccinated people (with similar baseline characteristics) and test them all at the same time and in the same way (ie if you’re going to do a nasopharyngeal swab with a 37+ cycle PCR test, EVERYONE gets the (1) the same PCR test run at (2) the same cycle threshold). I’d actually be surprised if there were any difference between the groups if this were done.
This Minnesota data nicely mirrors the narrative of vaccine effectiveness over the last year. In the beginning it was clear that vaccination was more effective than previous infection at preventing cases. Then, two things happened. Biochemically, previous infection provides better protection against delta than does vaccination and around July 1, delta became the dominant variant in the US. Over that same time period, it became clear that vaccine effectiveness was waning. There have been several large studies done (e.g. in Israeli data) to try to disentangle the two effects. It is clear that both are significant contributors, but which predominates is not yet clear. Biochemically, a third dose results in anti-delta titers that are consistent with the protection against “wild-type” provided by two doses, but it remains to be seen whether that expectation is born out in the epidemiological data.
thank you, good explanation
@Ken Higgins, the difference is rate vs. absolute number. In Minnesota, there are many fewer people who are unvaccinated vs. vaccinated, so the denominator when you calculate a rate is smaller, making the rate higher. Imagine a community of 100 people, 20 unvaccinated and 80 vaccinated. If 10 people have COVID, 5 vaccinated and 5 unvaccinated, then 5/20 = 25% of the unvaccinated are sick, vs. 5/80 = 6.25% of the vaccinated.