Dave Dixon and I thought it might be interesting to compare wave lengths and shapes in Minnesota, so that is what this chart does. It could be that vaccination will lower the height of the wave but spread it out more in time. Right now from a length perspective, we should be near the peak.
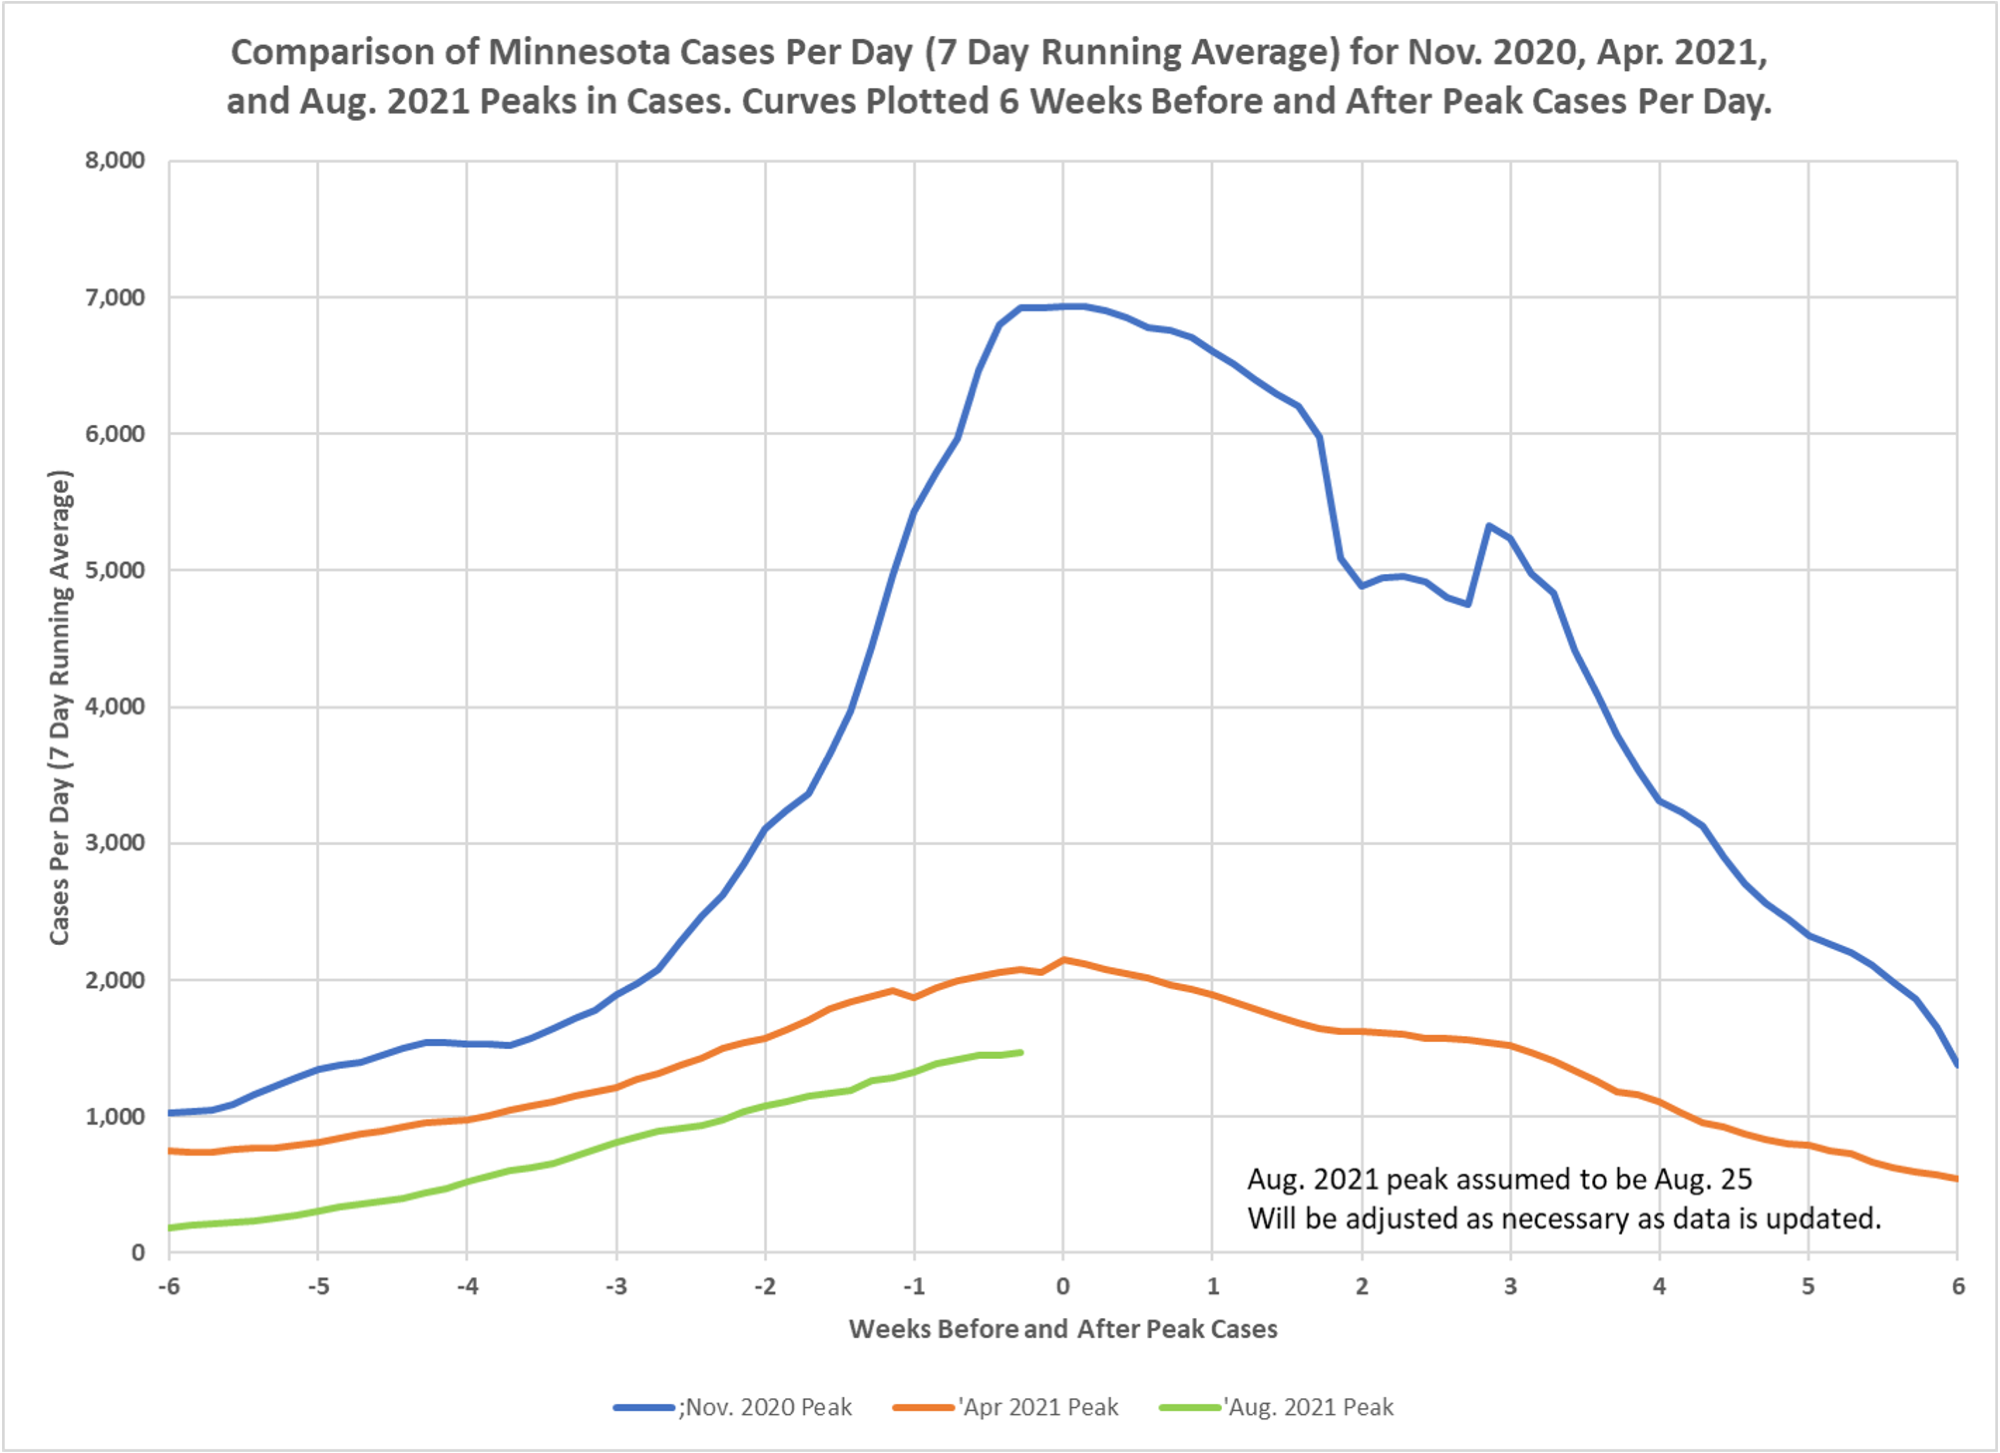

Very interesting. Wanna bet the case goofs will still be running around with their hair on fire six weeks from now.
Assuming the current wave has a lower peak, are there any alternative explanations besides the Big Pharma vaccines?
I am sure adaptive immunity from natural infection also plays a role