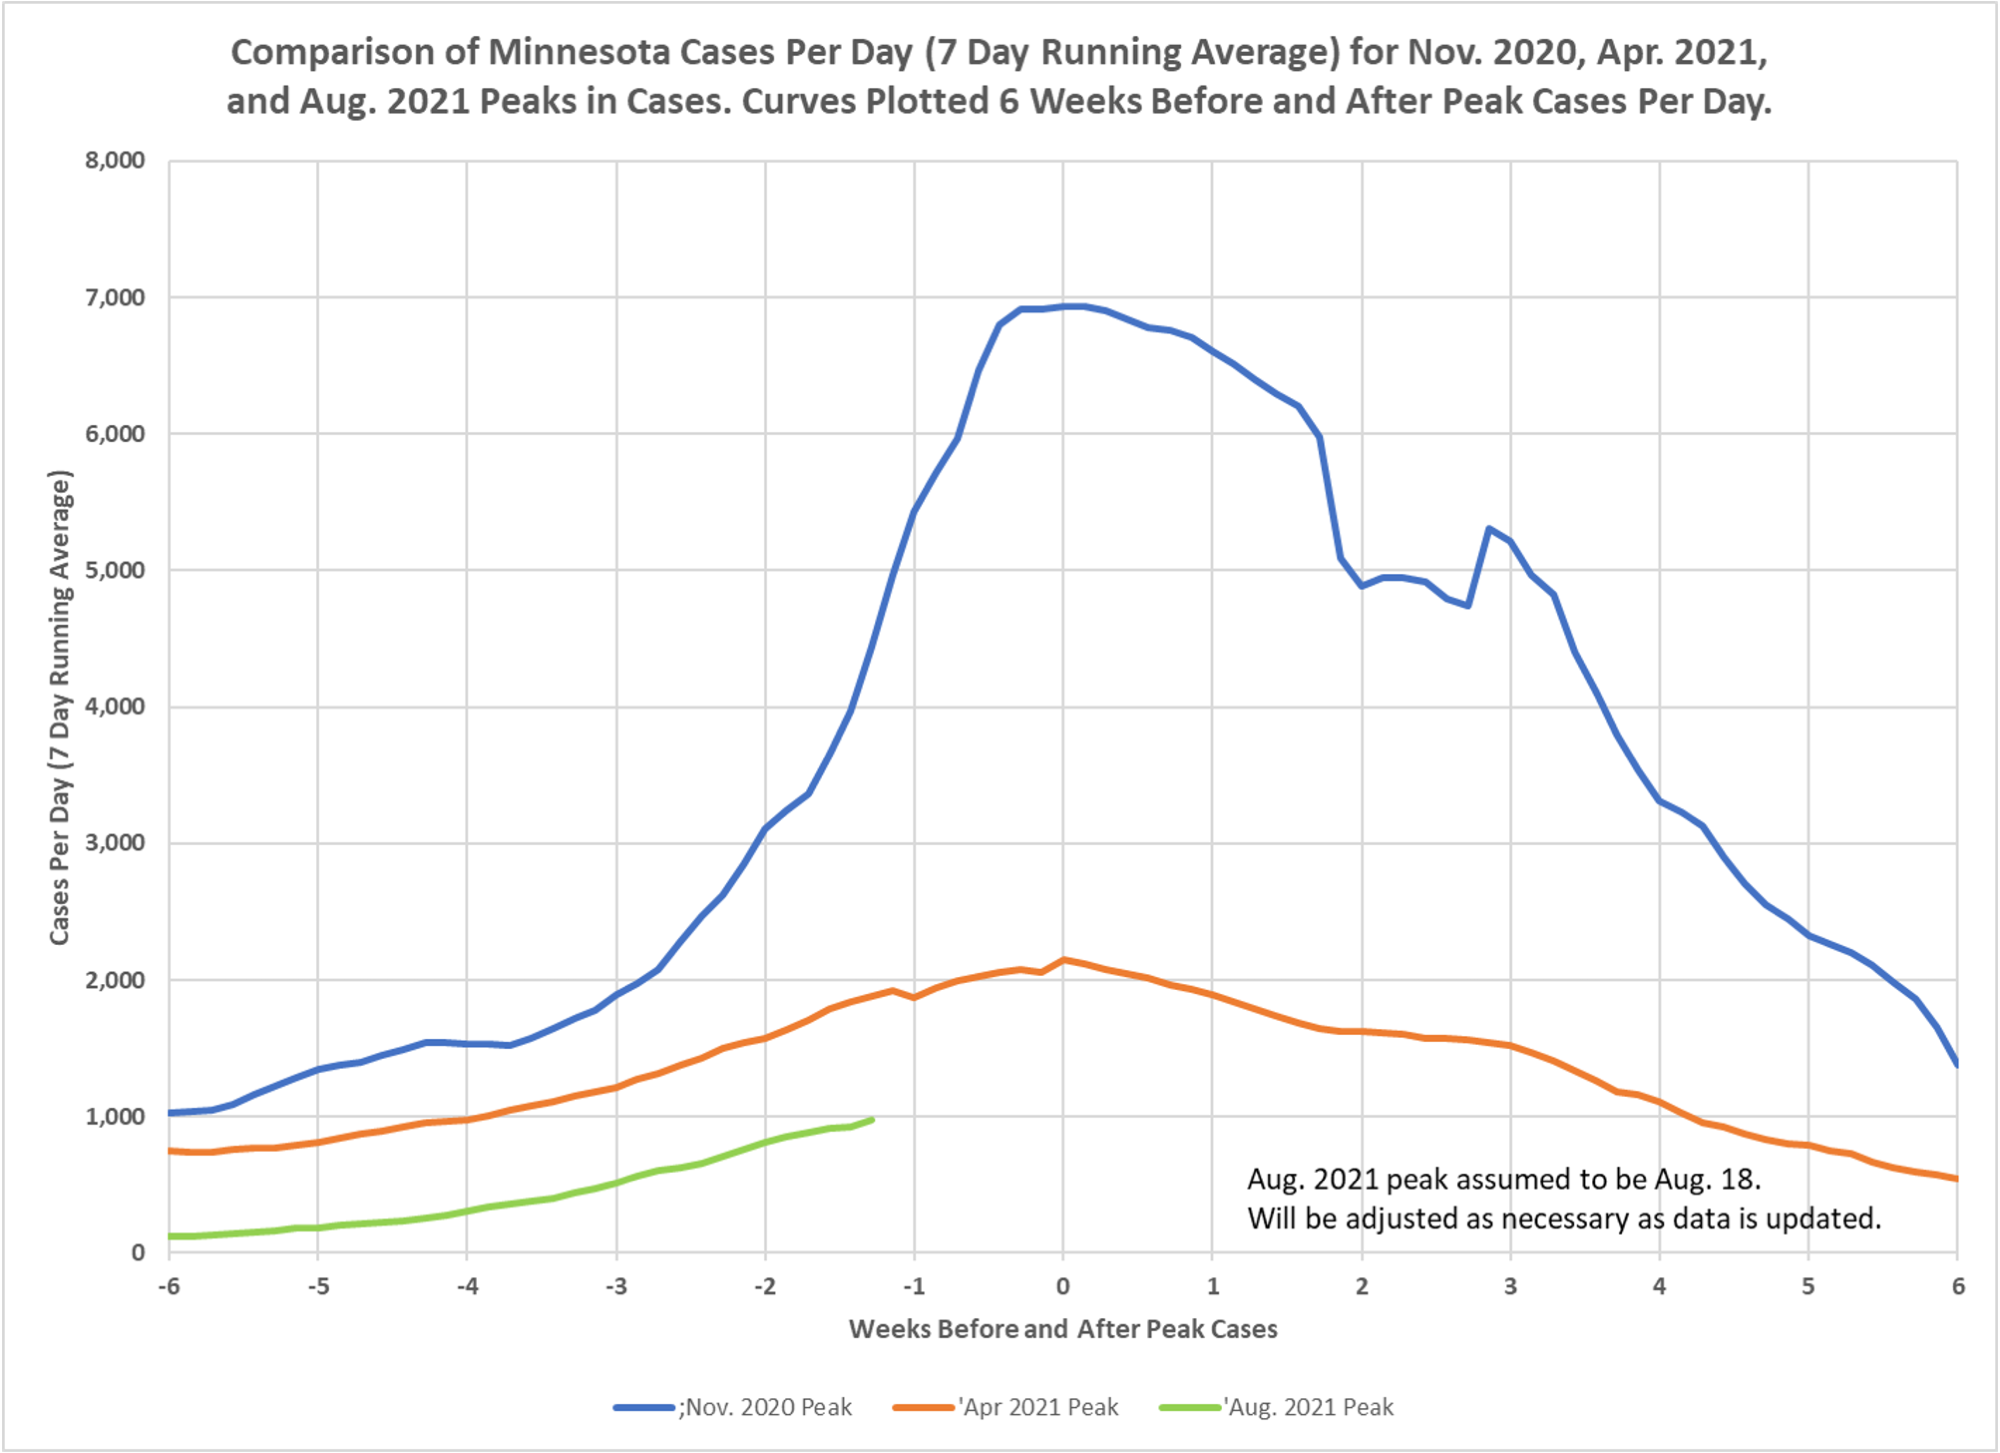
A followup by Dave Dixon on the work of looking at week-over-week trends. This chart isolates the waves, you can see that it appears that the leadup lasts about 6 weeks and then things decline. A similar trend has been noted by others in areas like Florida. I don’t know if the past always repeats itself, but we clearly are at a point where either it declines or it takes another leg up.

I believe we are seeing a slow ramp up in the Midwest that will be followed by a late fall peak. This will occur in November again, just like last year. I’ve been telling friends and coworkers for weeks. The question is, will everyone lose their damned minds again and reimplement stupid and ineffective NPI’s? We’re starting to see those come back again, and it’s probably only going to get worse. Buckle up, folks – it’s going to get rough. We all need to band together and disregard every single one of these restrictions on our day to day lives. Enough of this myopic focus on a singular coronavirus. Don’t let them do it again.
We may be seeing the peak of our July-August up tick in Chatham County. See link to chart from NYT. Yesterday we saw a big reported drop in new cases. We count both Antigen and PCR positive tests.
https://g.co/kgs/8BTXi5