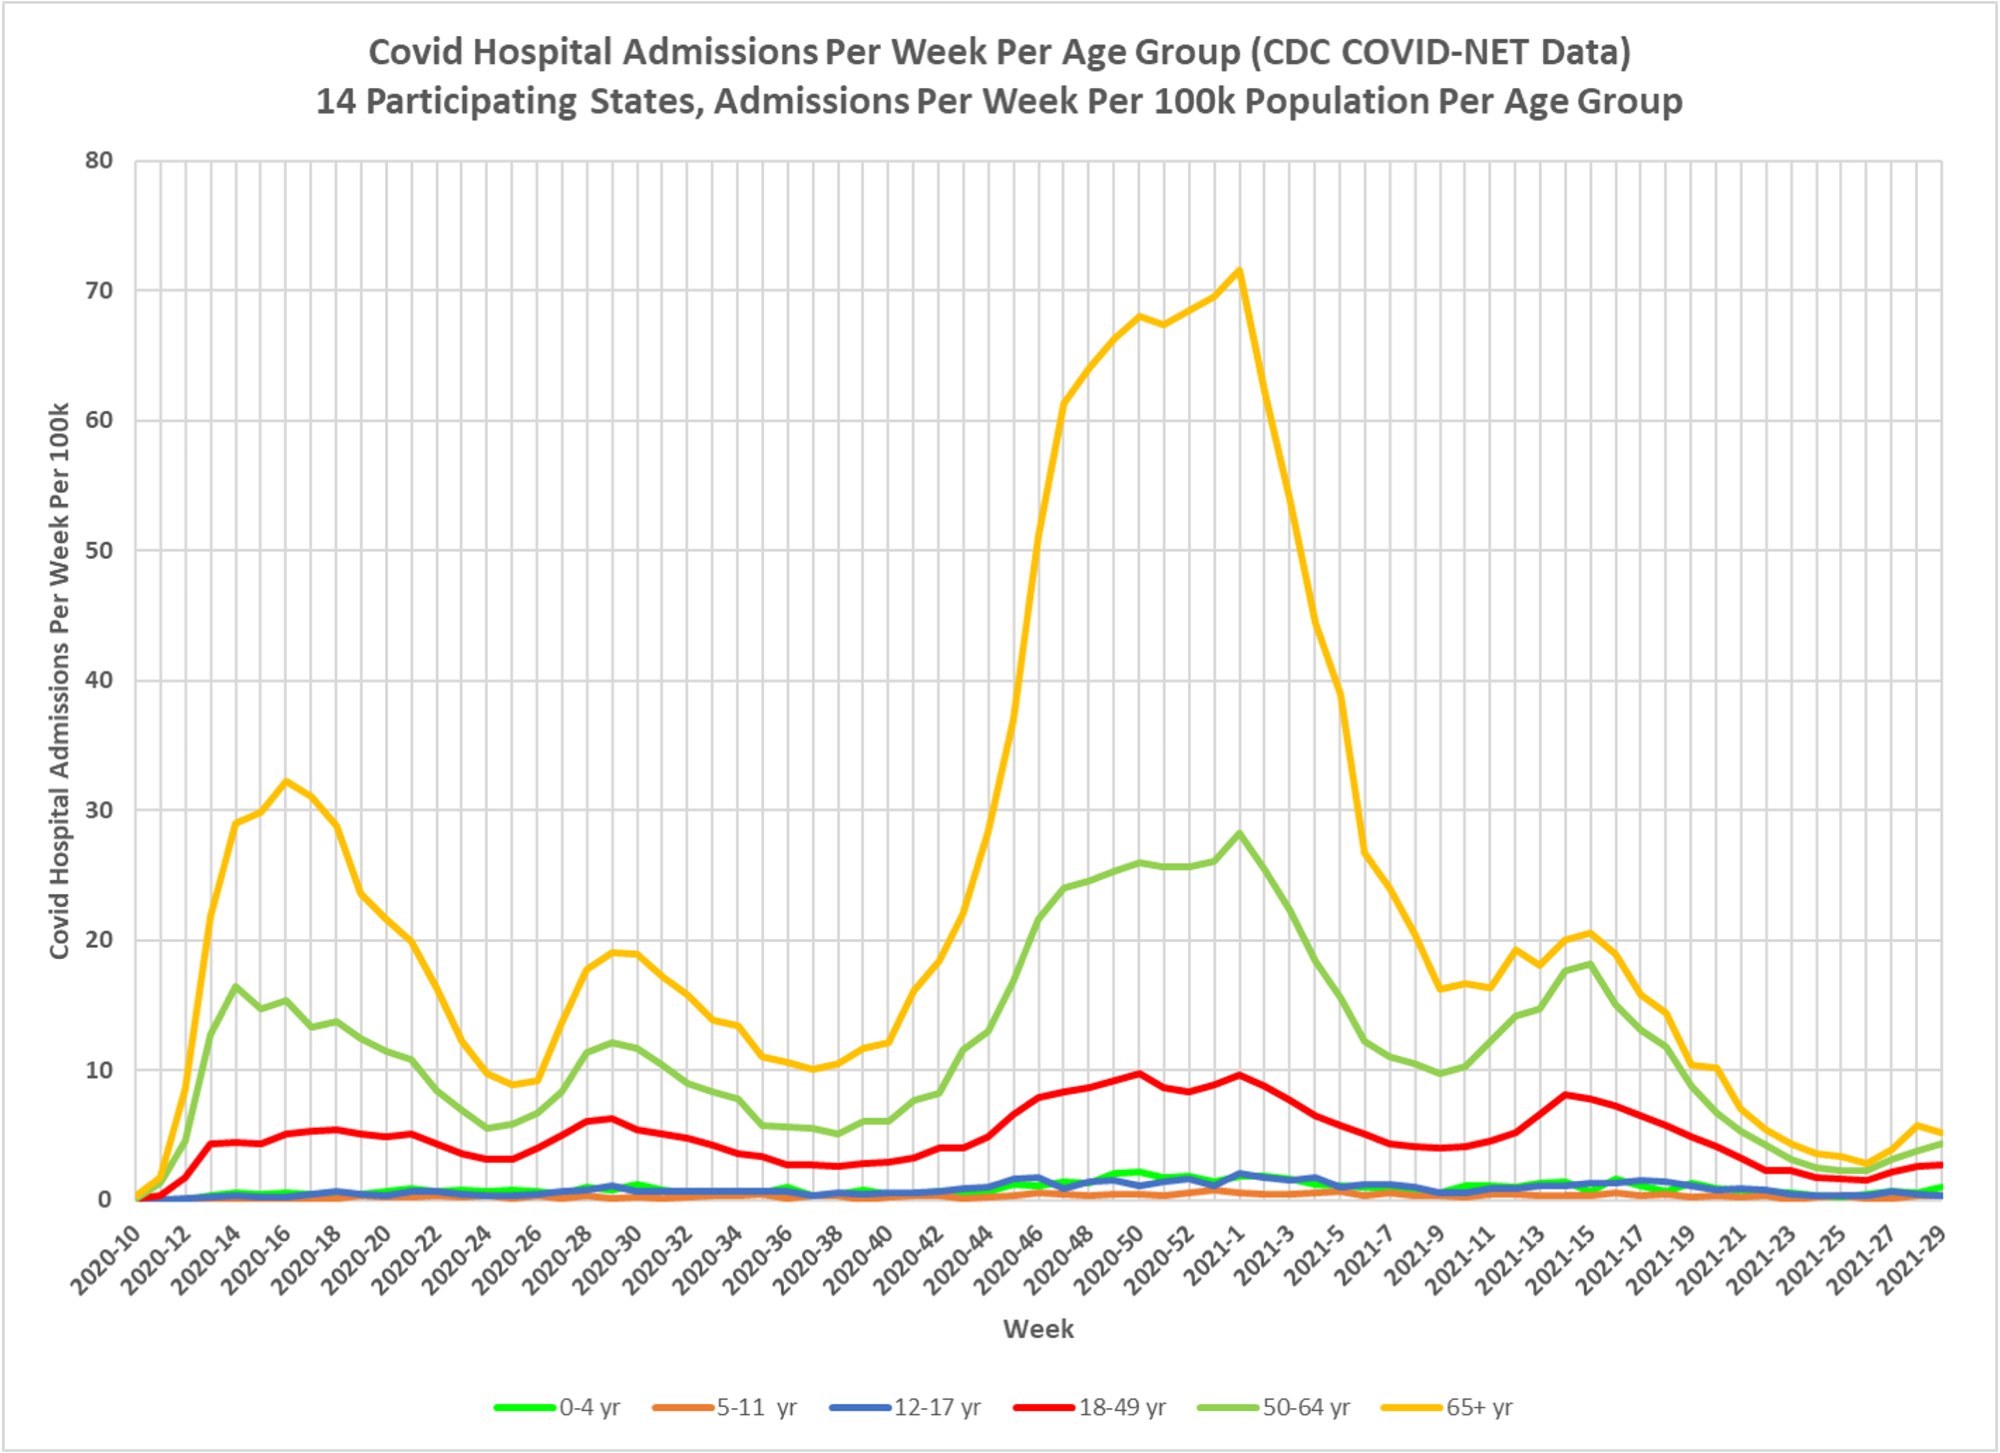
A cleaner look than the one I screenshot from Twitter and easy to see that nothing, absolutely nothing is going on with hospitalizations, especially among the young. So there may be a good-sized case bump but there is no such thing in hospitalizations, Delta or no Delta.

Mr. Roche,
Over time, given how sensitive the PCR test is, would you expect an increase in the proportion of hospitalizations “with” COVID versus “from” COVID? Given how widely the virus has spread, I’m wondering if those false positives and low positives would increase over time.
As always, thank you for your efforts.
I think that among vaccinated people, PCR tests will exacerbate the problems with low “positives” in which people are called a positive but have only fragments or extremely small amounts of virus
I note this is from only 14 states; which states are they?
It is on the CDC website, I know Minnesota is one of them. Let me see if I can get a link. it is the states where the CDC has surveillance
Here is a link to the CDC COVID-NET web site where this data came from: https://covid.cdc.gov/covid-data-tracker/#covidnet-hospitalization-network . There are actually only 10 states with COVID data in this data set (CA, CO, CT, GA, MD, MN, NM, NY, OR, TN) and 4 more that provide influenza data. There are some other national data sets on the CDC web site, so more can possibly be done on the topic of national hospitalizations.