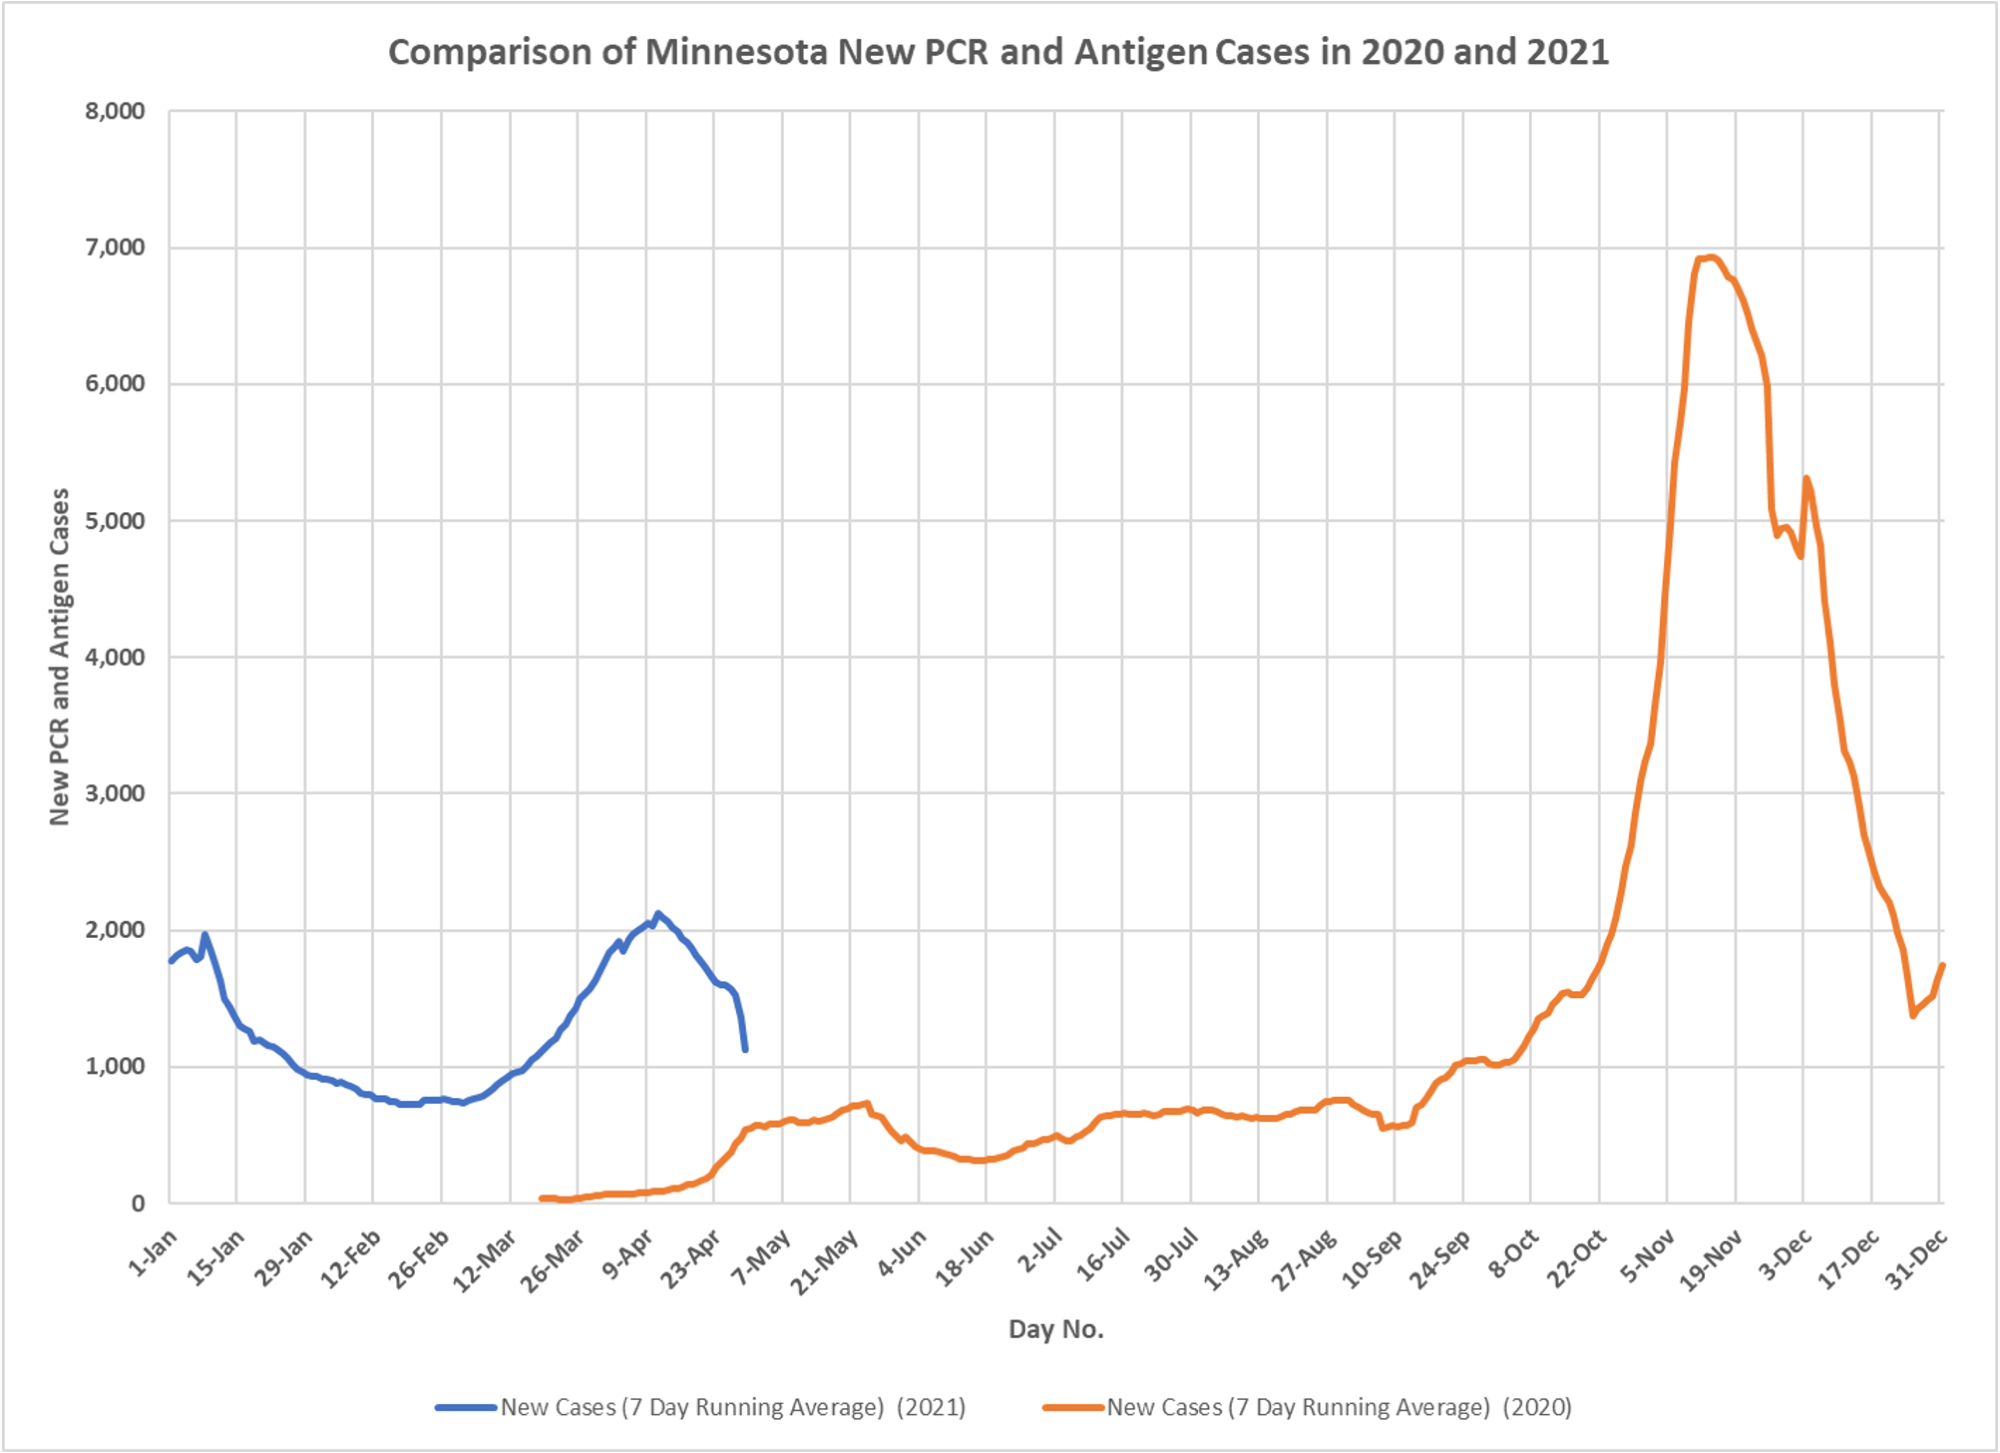
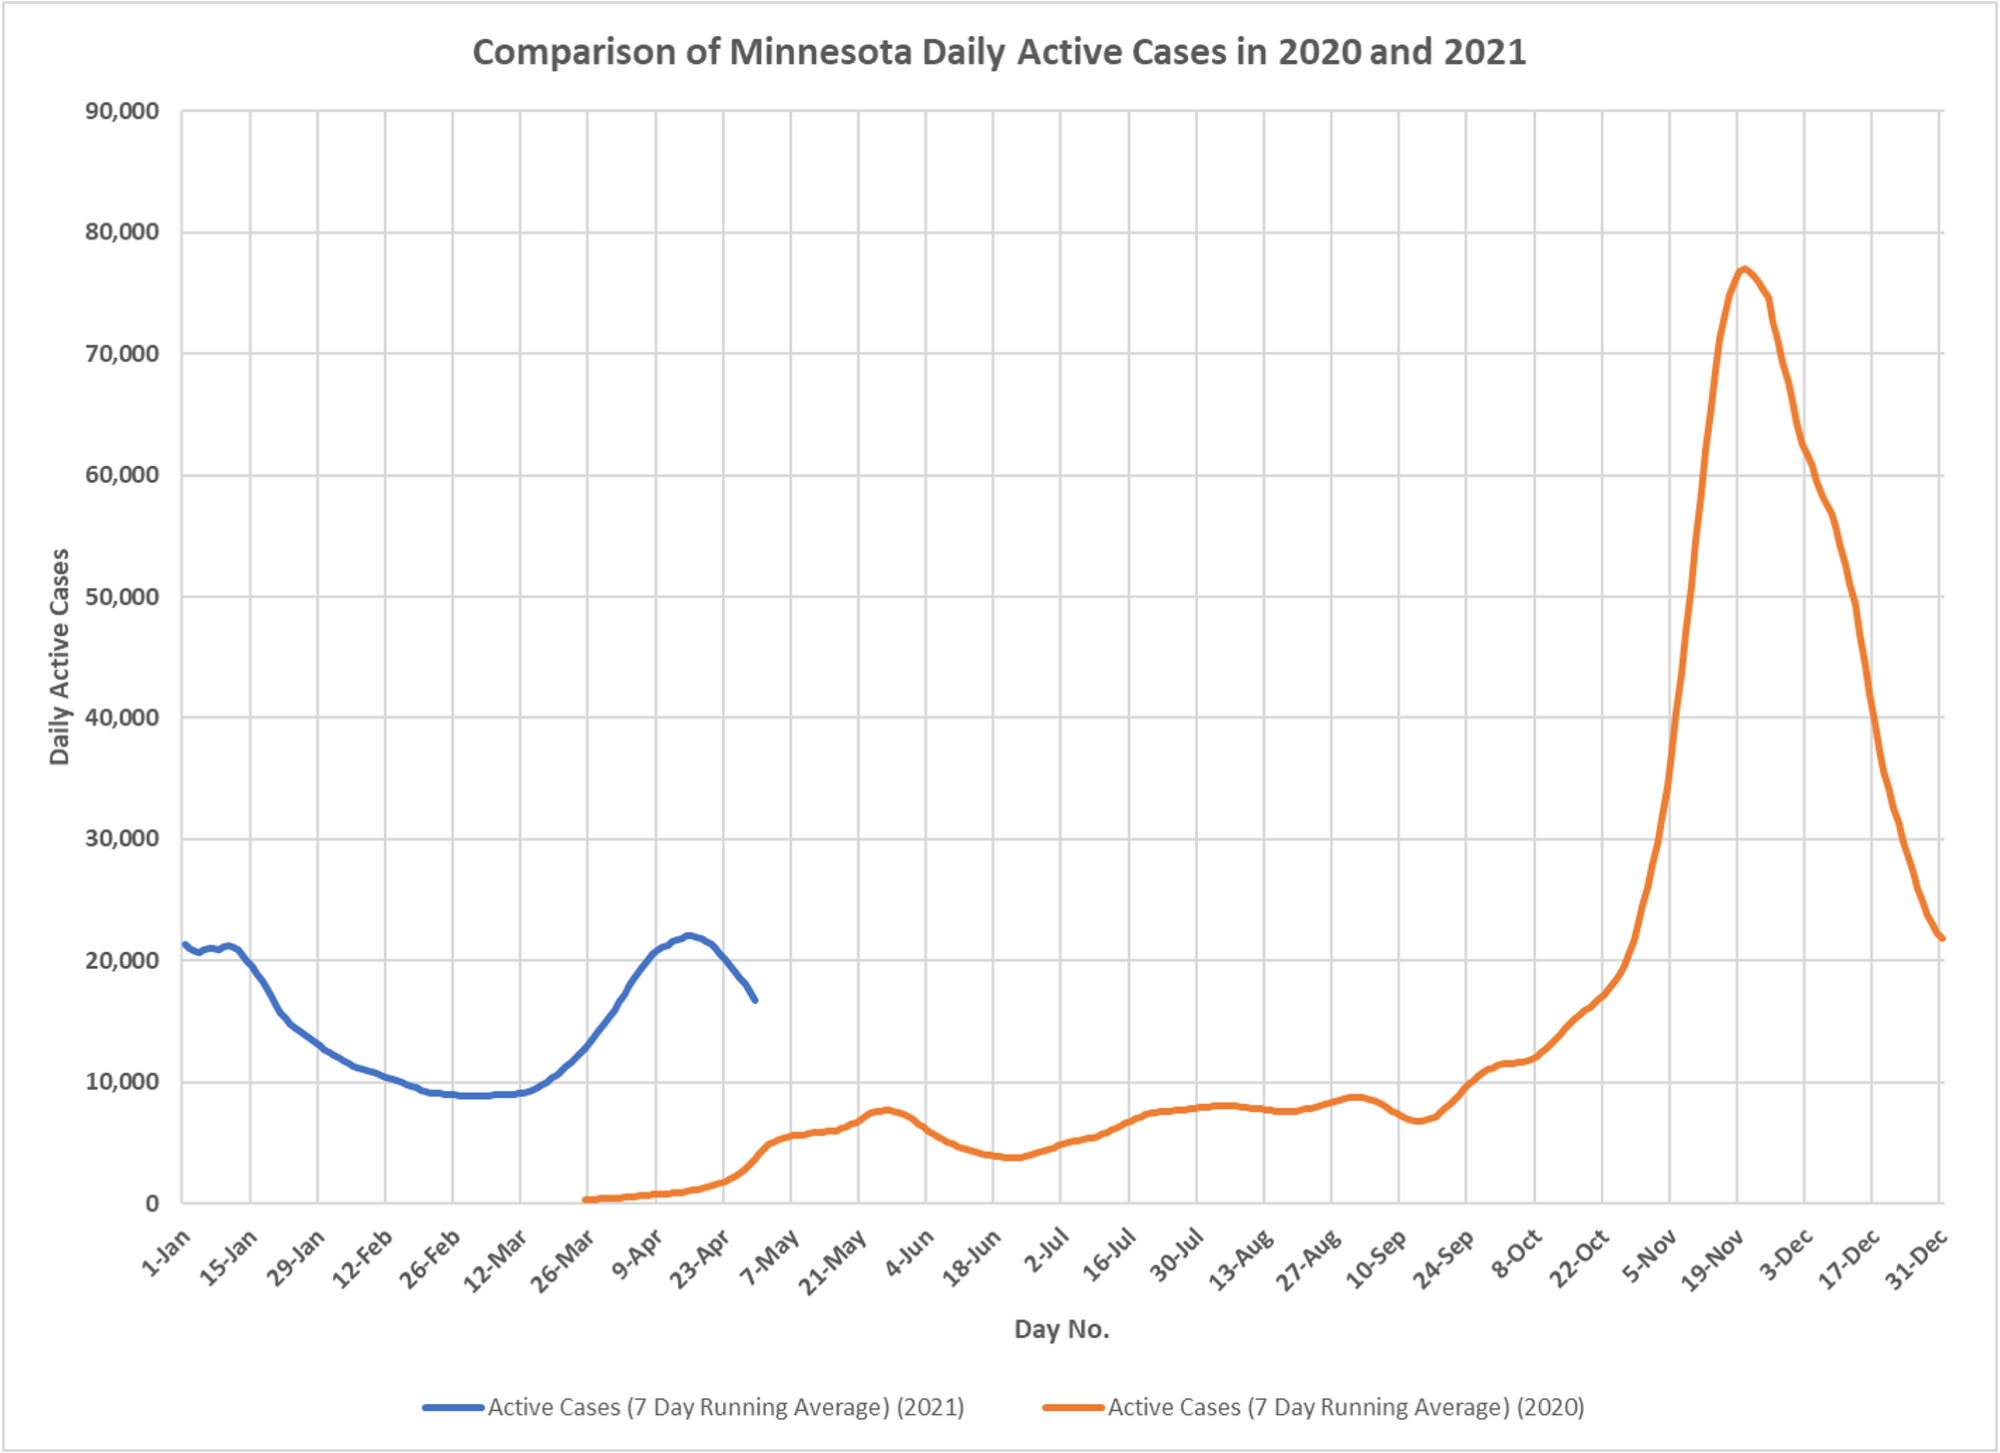
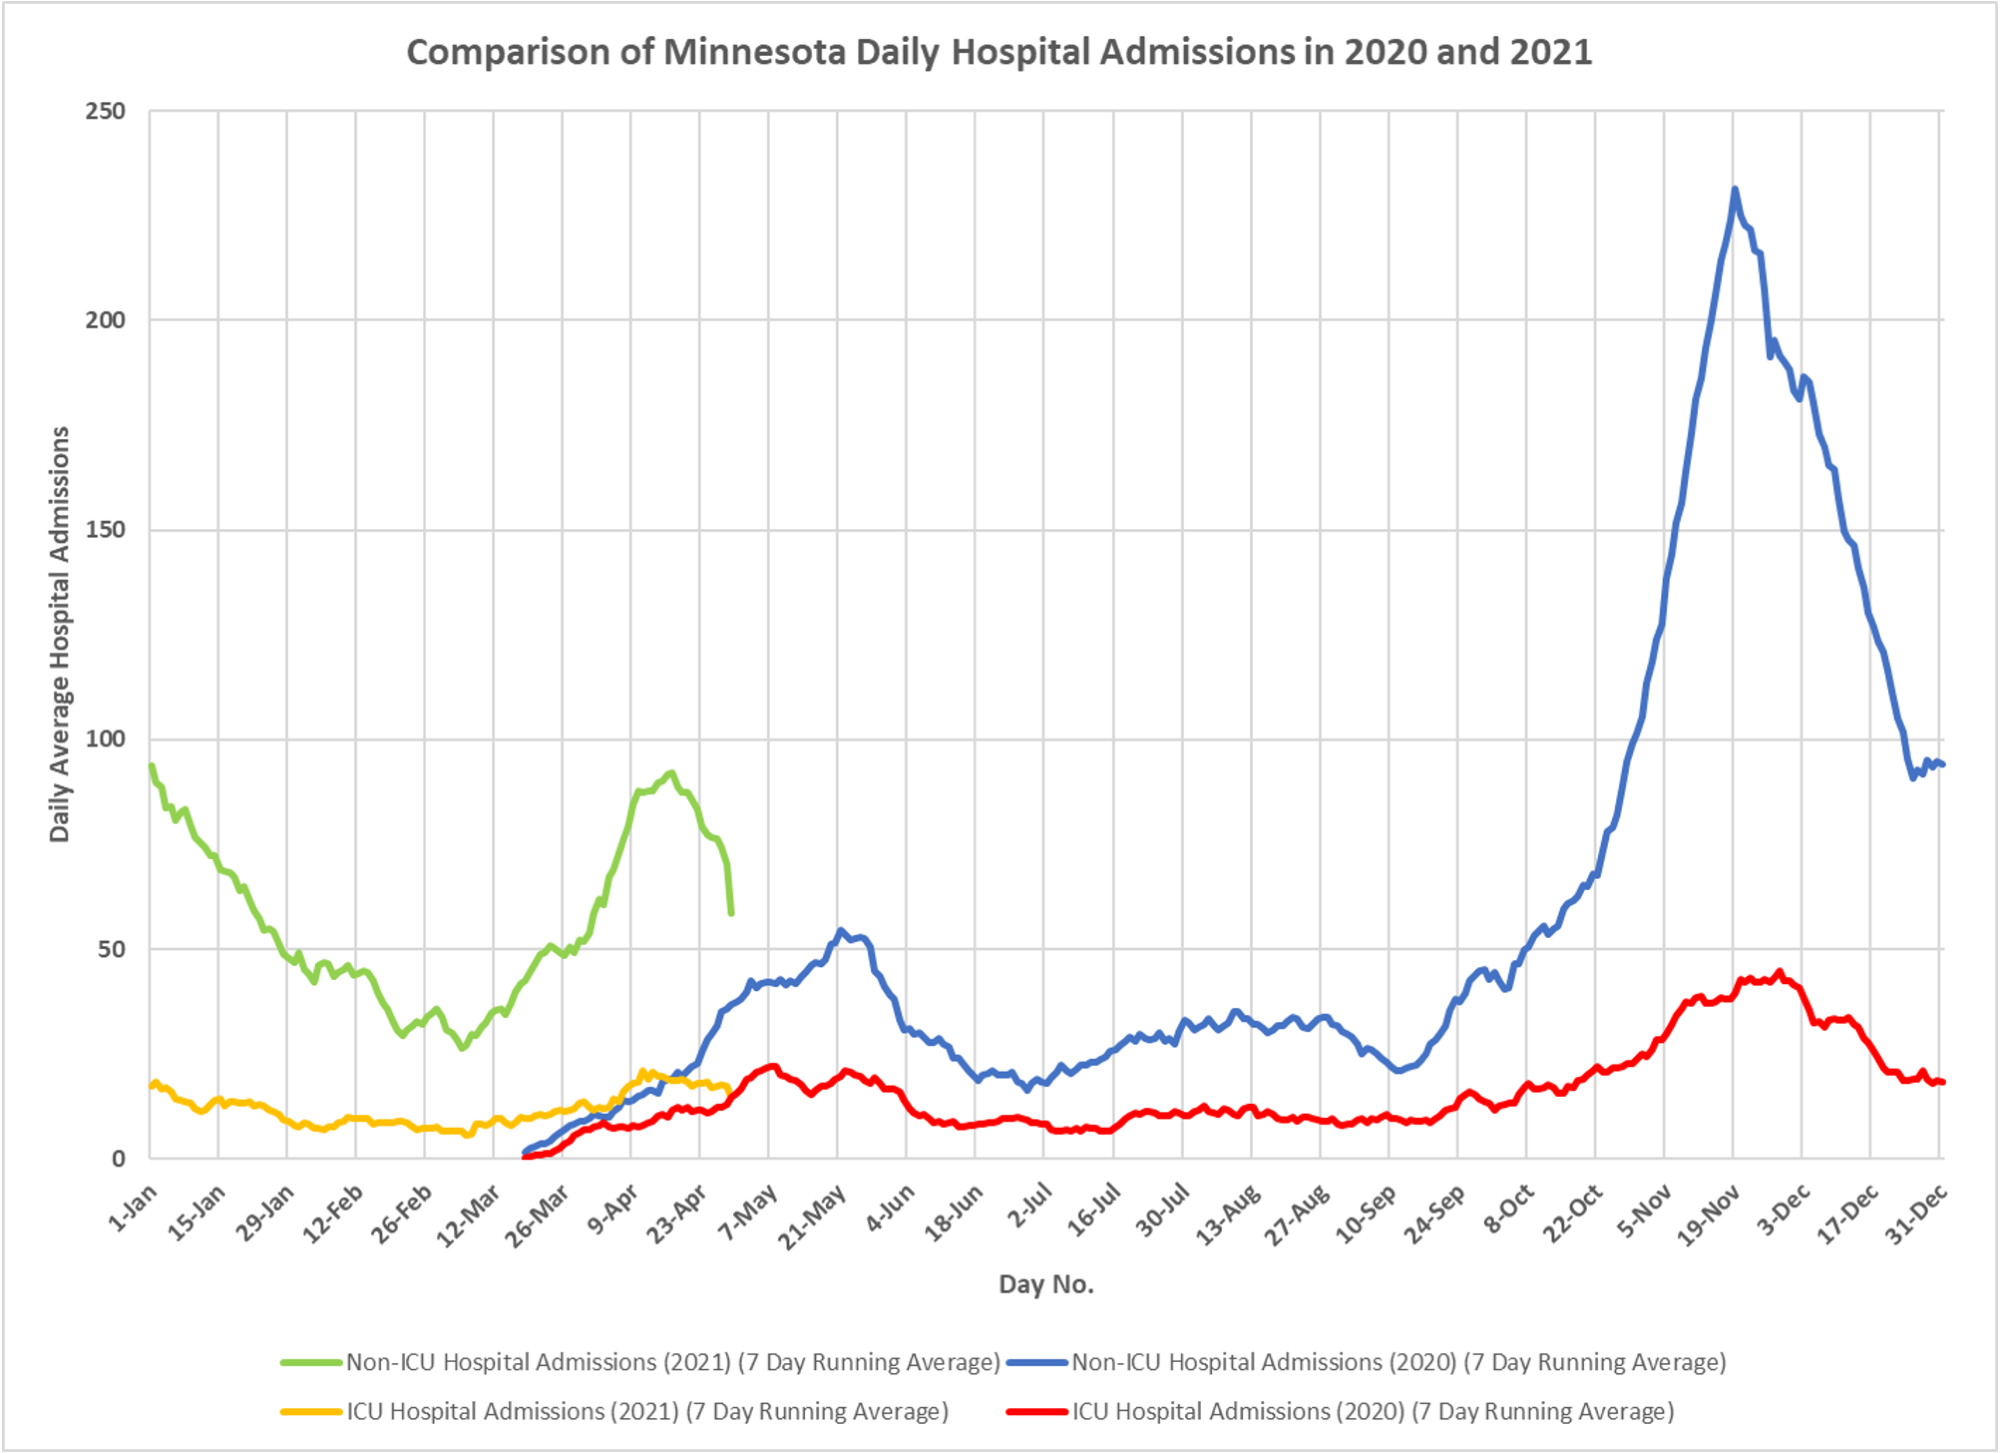
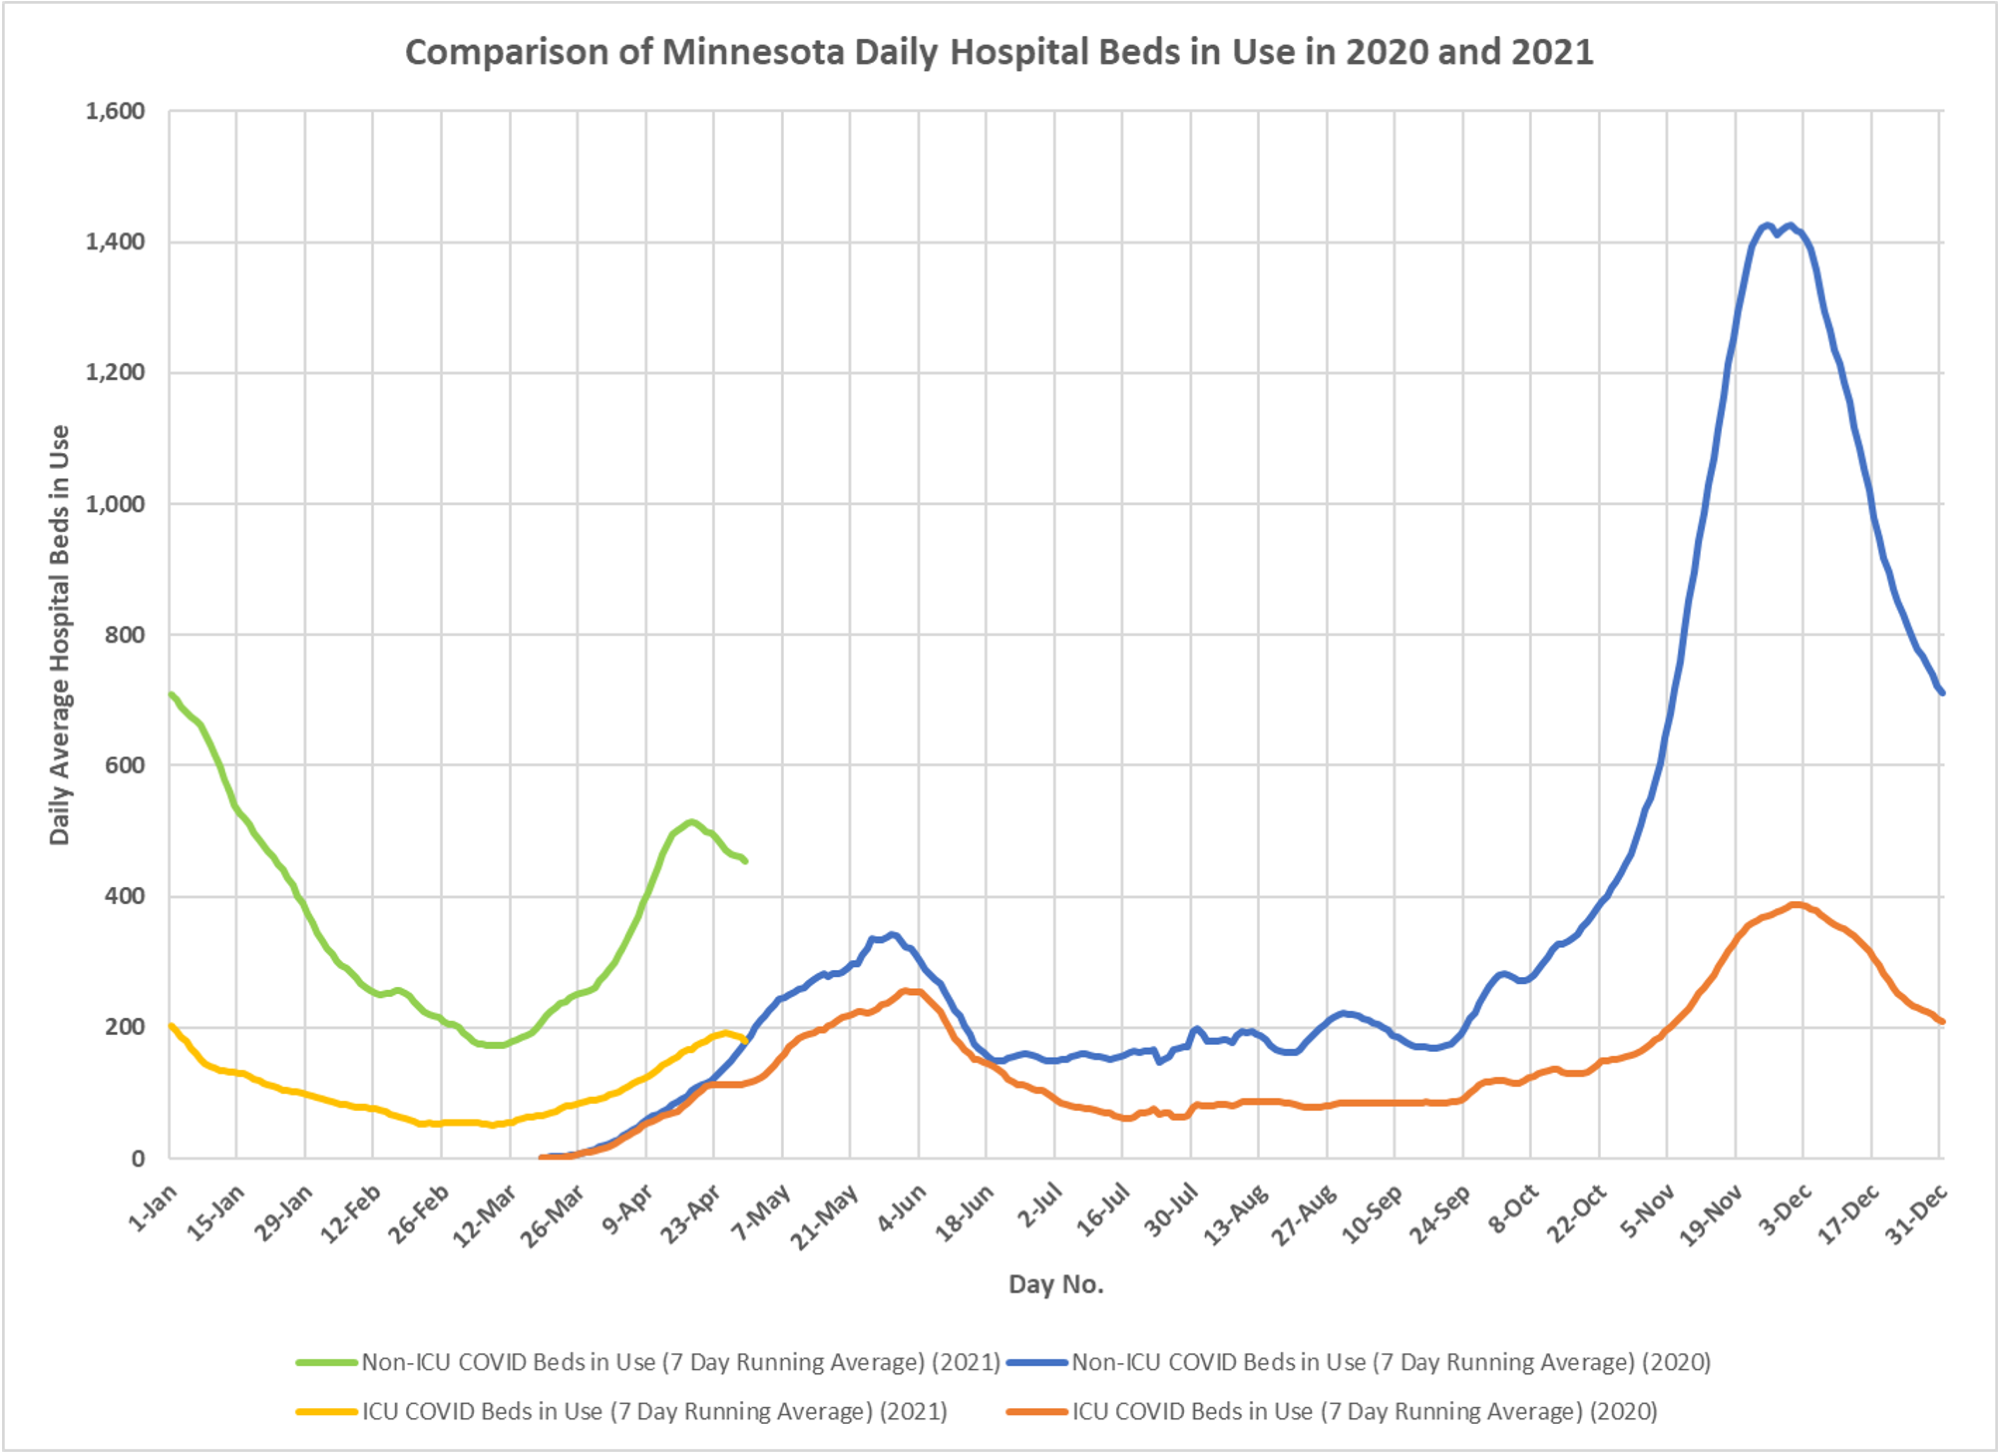
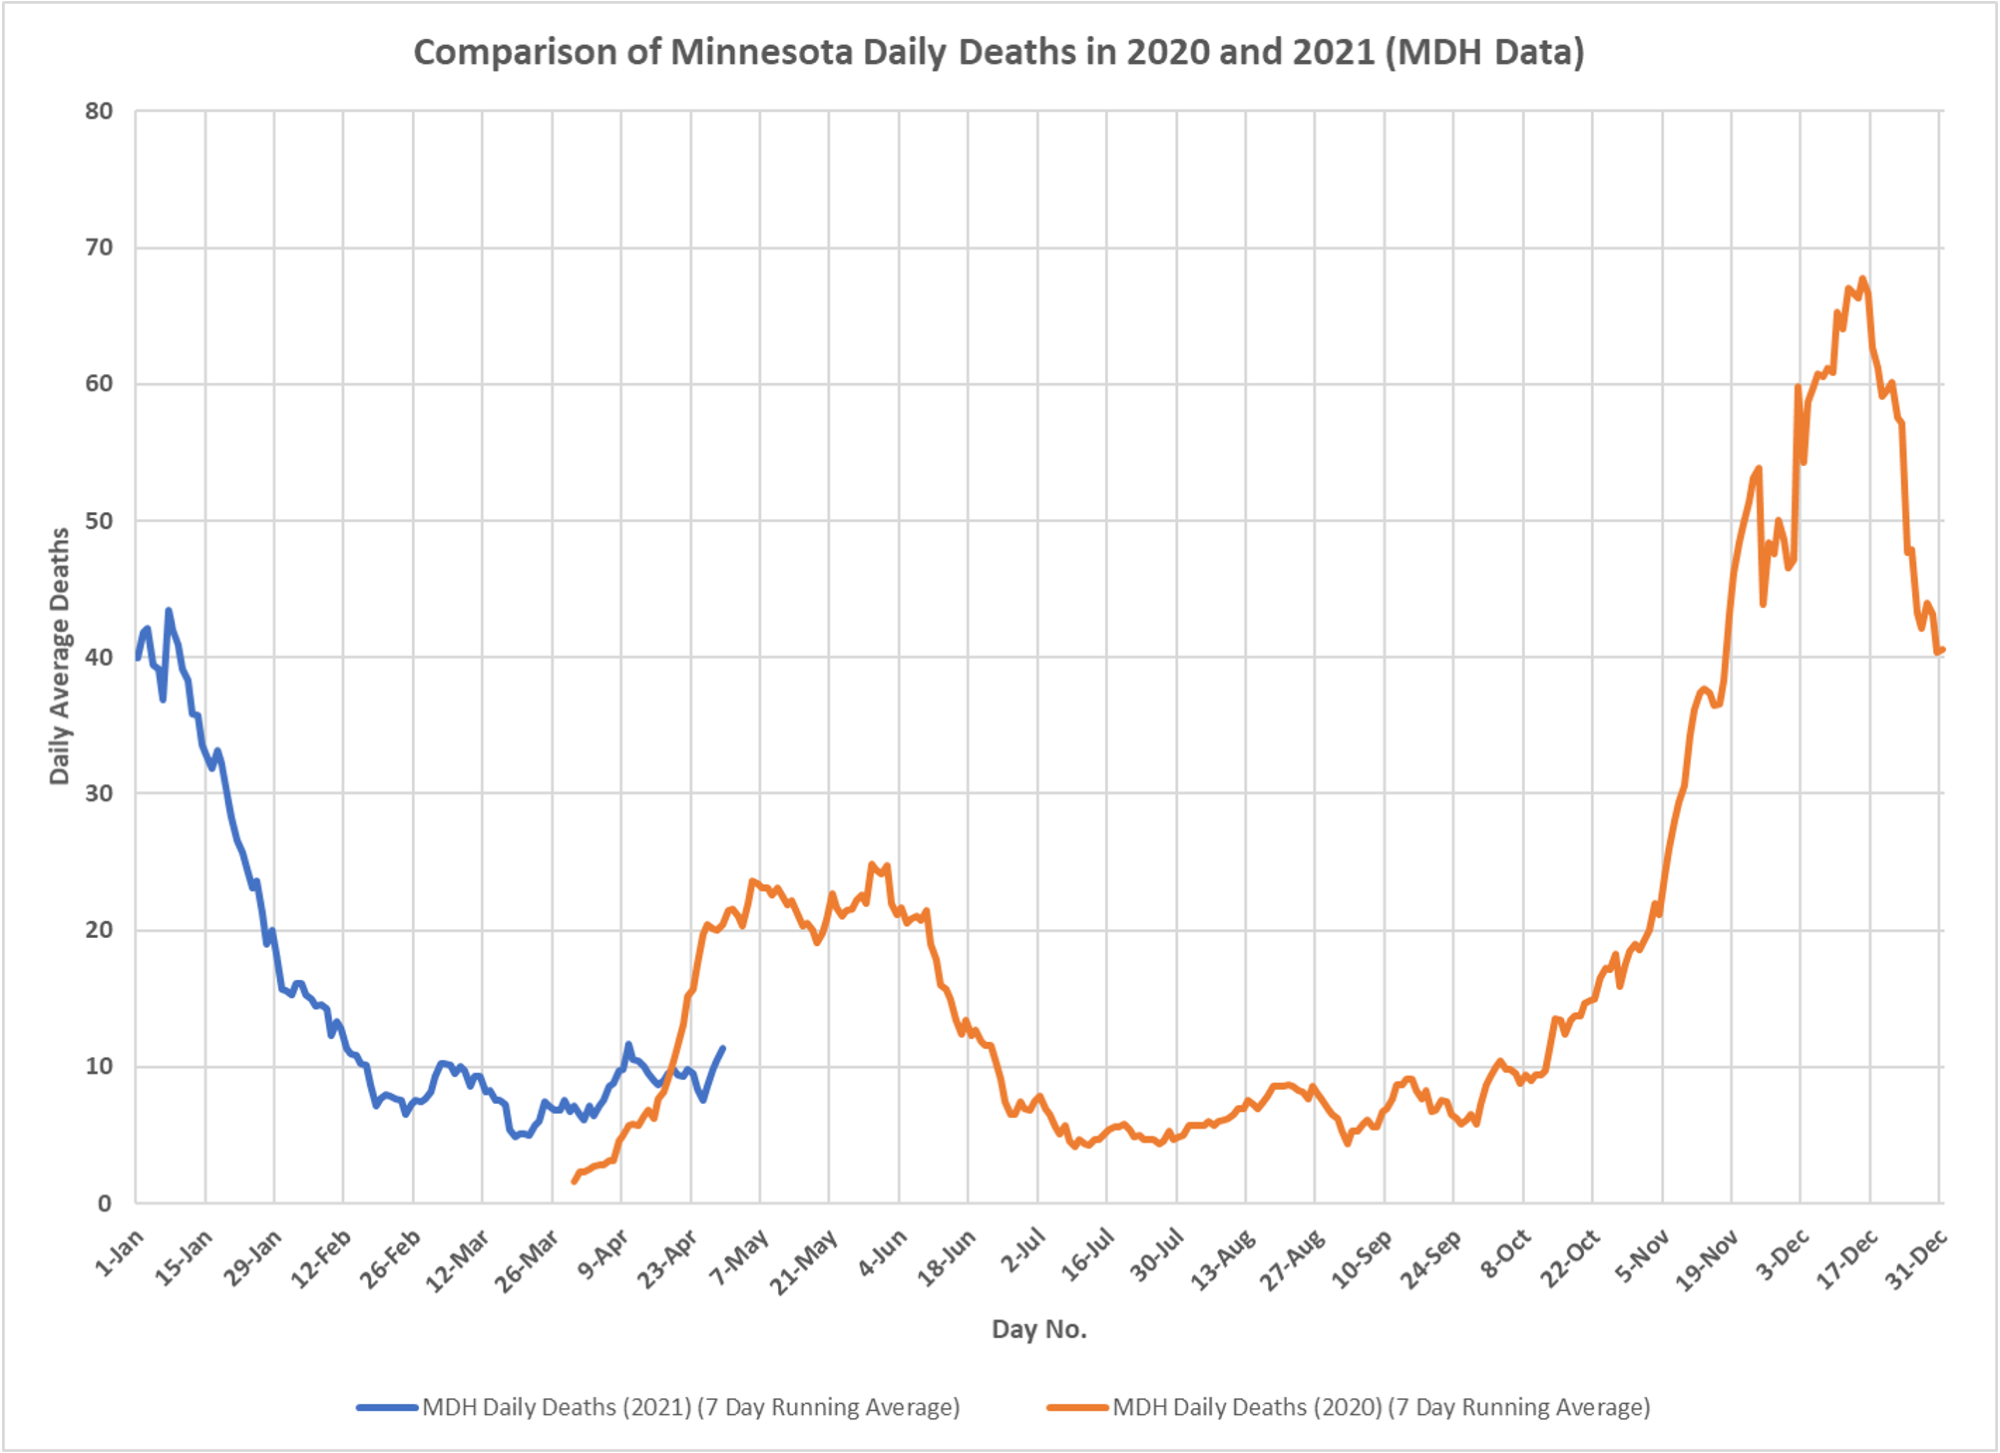
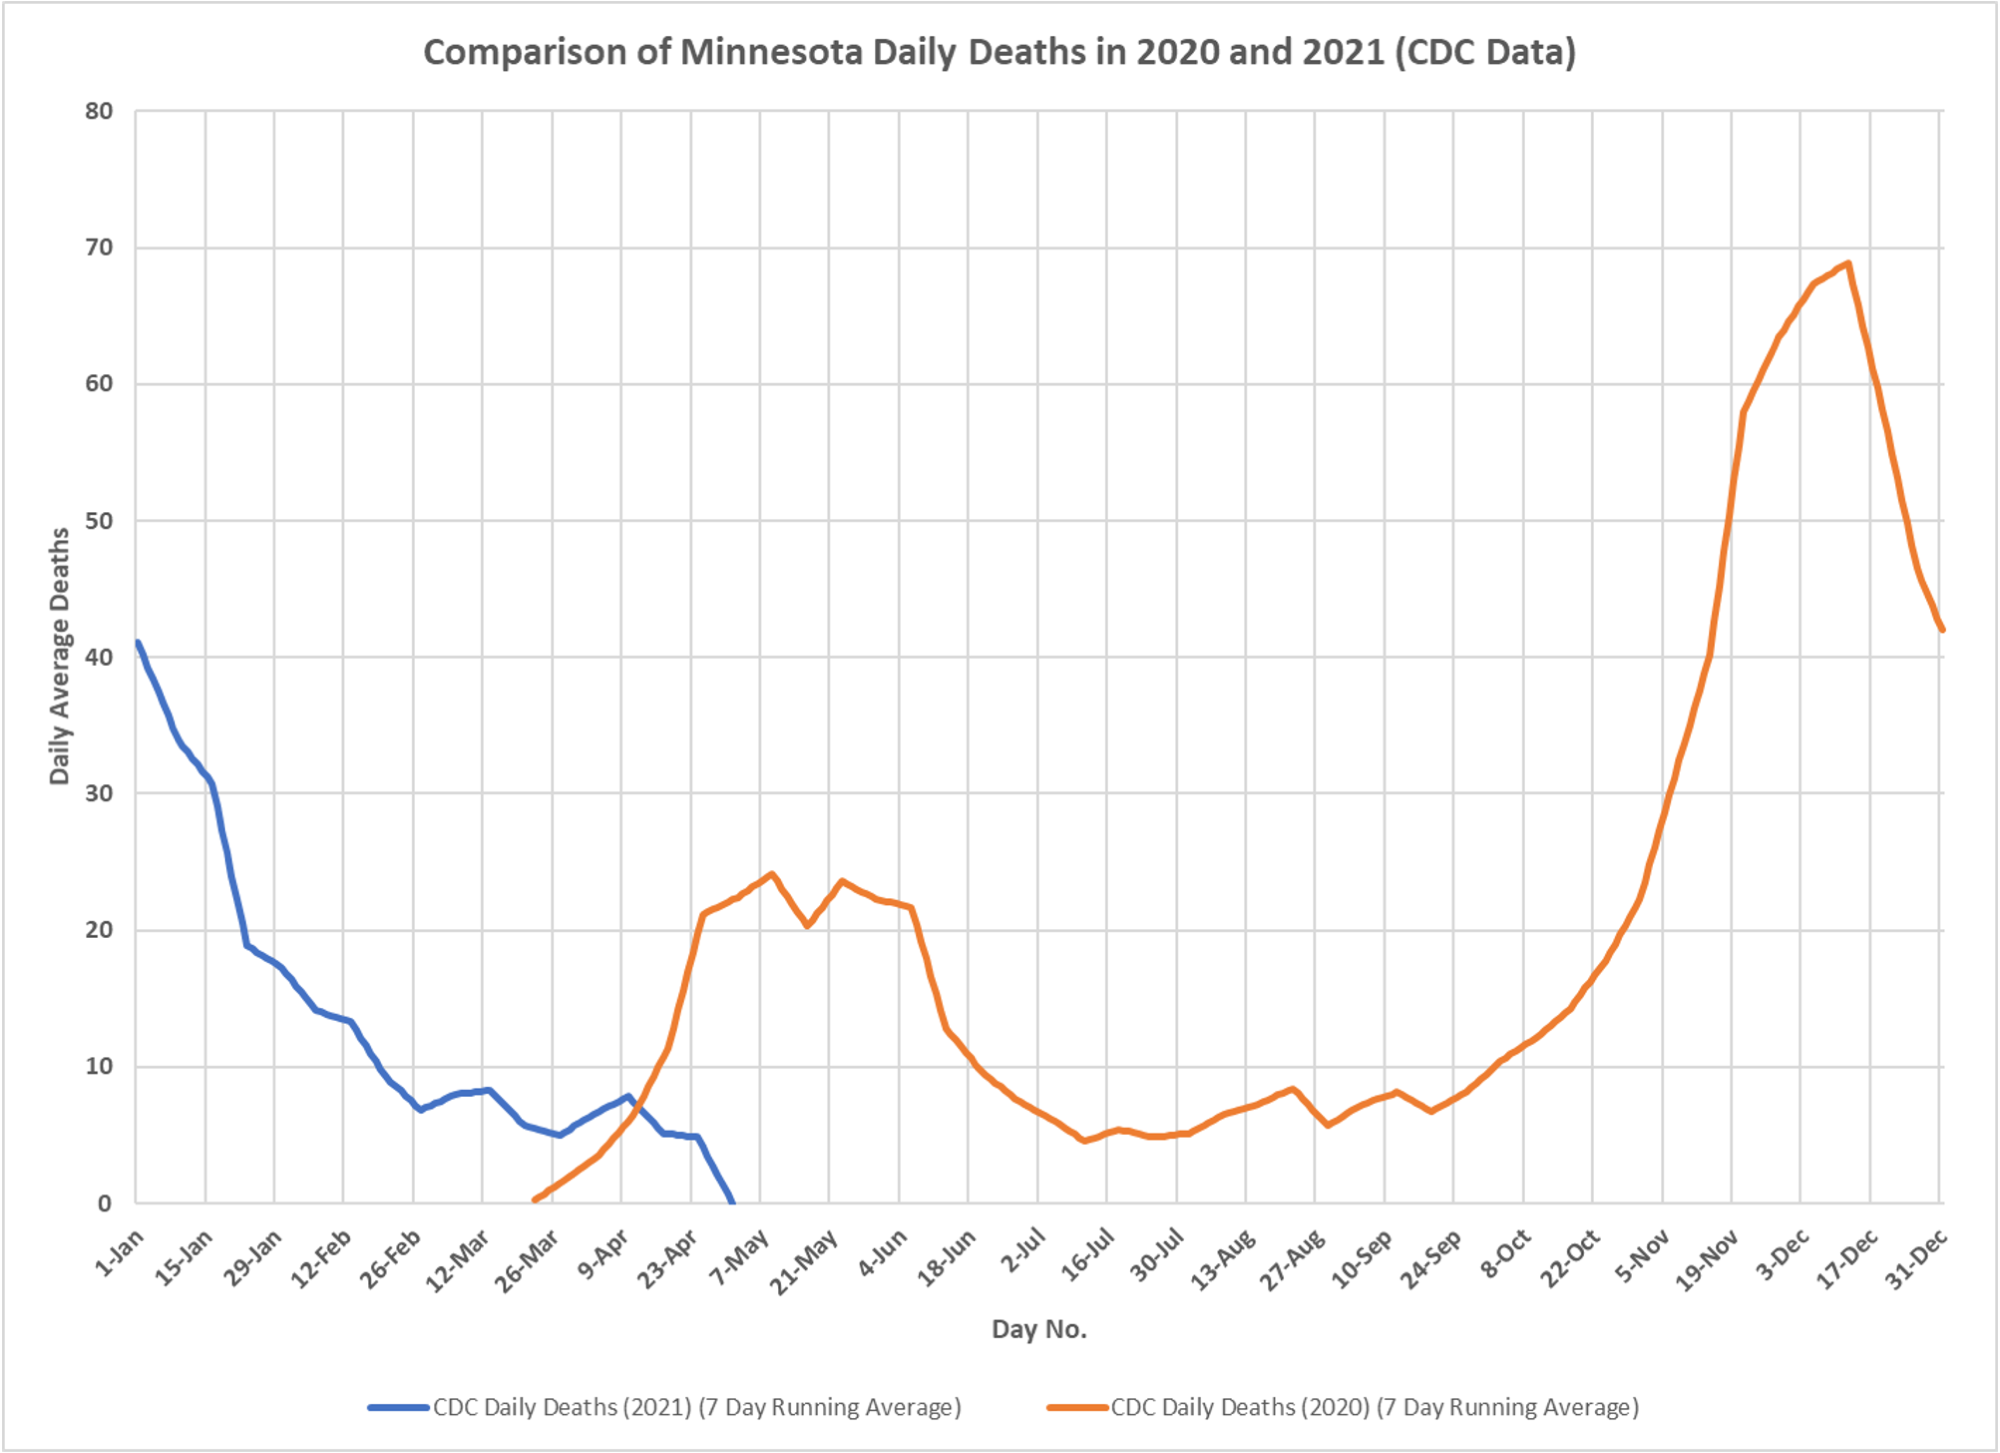
As the epidemic works into its second year, some charts showing the year-over-year look, courtesy as usual of DD. Interesting to see the offset of the spring wave in terms of cases and outcomes. Likely due to late introduction last year and different weather in the spring. Also interesting to see the number of non-ICU hospitalizations, the cohort analysis indicates no higher case rate this year, and since undetected infections were likely much higher last spring, given no testing, the rate is actually probably lower. And ICU hospitalizations are down, indicating lower severity, but that may due to excessive use of mechanical ventilation last spring. Deaths down significantly.

One view that might be interesting and worth analyzing is comparing some of these charts with the chart found on page 3 of the MDH Weekly Influenza Statistics Summary: 2010 – 2011. The chart in question is titled, “Hospitalized Influenza Cases Influenza Surveillance Network (FluSurv-Net) Minnesota, October 1, 2008 – May 21, 2011”. The pattern in that chart seems to have a remarkable resemblance.
https://www.health.state.mn.us/diseases/flu/stats/2010summary.pdf