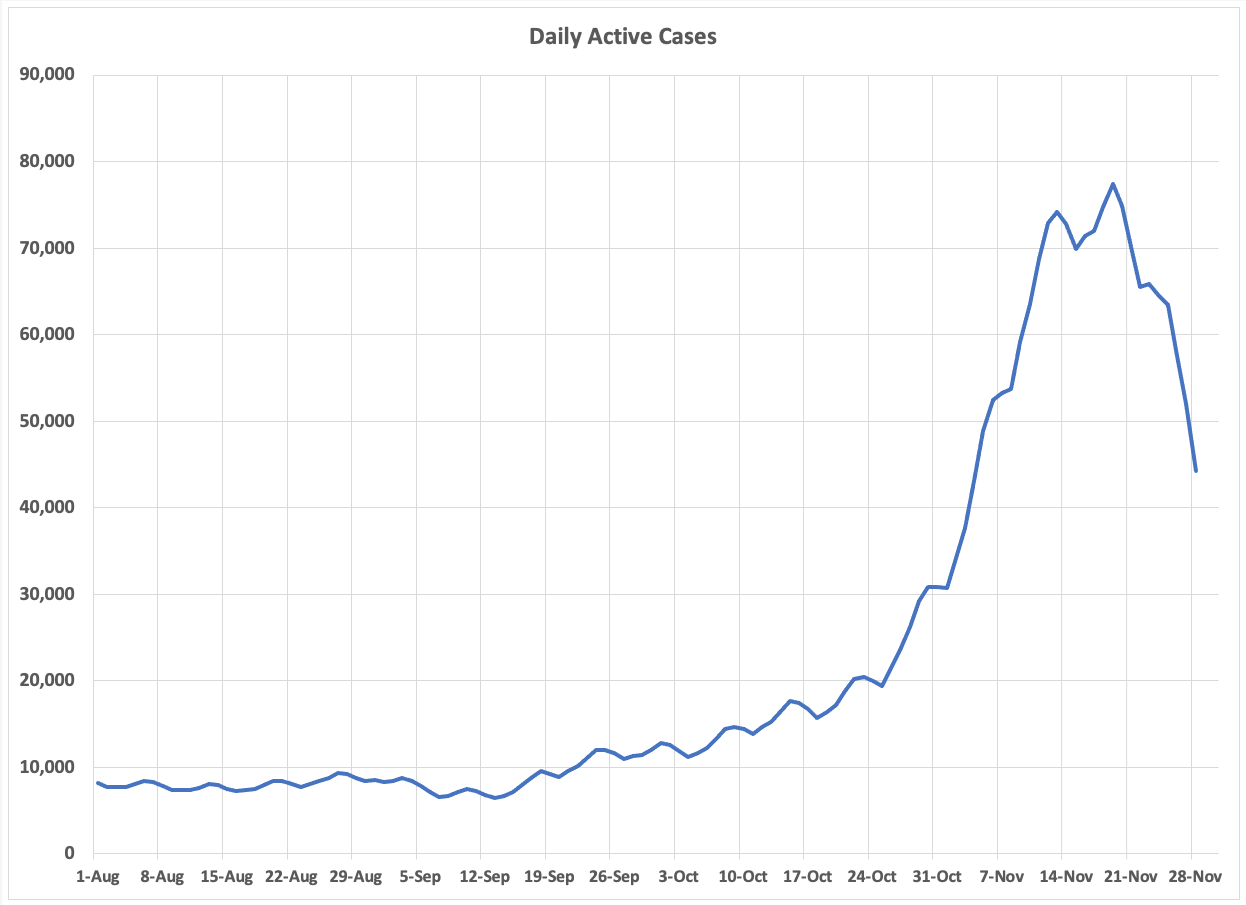
Below are the three charts from my active cases update. Had to do a little bridging formula for a day because the state skipped reporting on Thanksgiving, so we got no separate persons no longer isolating or total death numbers for those days. I also have realized that this analysis is overstating active cases, because the cases by date of specimen collection table gets updated every day, with major changes for a week to ten days, and dribs and drabs going back months. For example, August 1, the first day in this analysis, is still getting cases added. But the no longer isolating number, which is based on the rolloff of cases after around 10 days, does not have a table and does not get updated. If it did, the cases that are added to the case table 10 days or more ago would get added to the roll-off for the no-longer needing isolation number, reducing active cases.
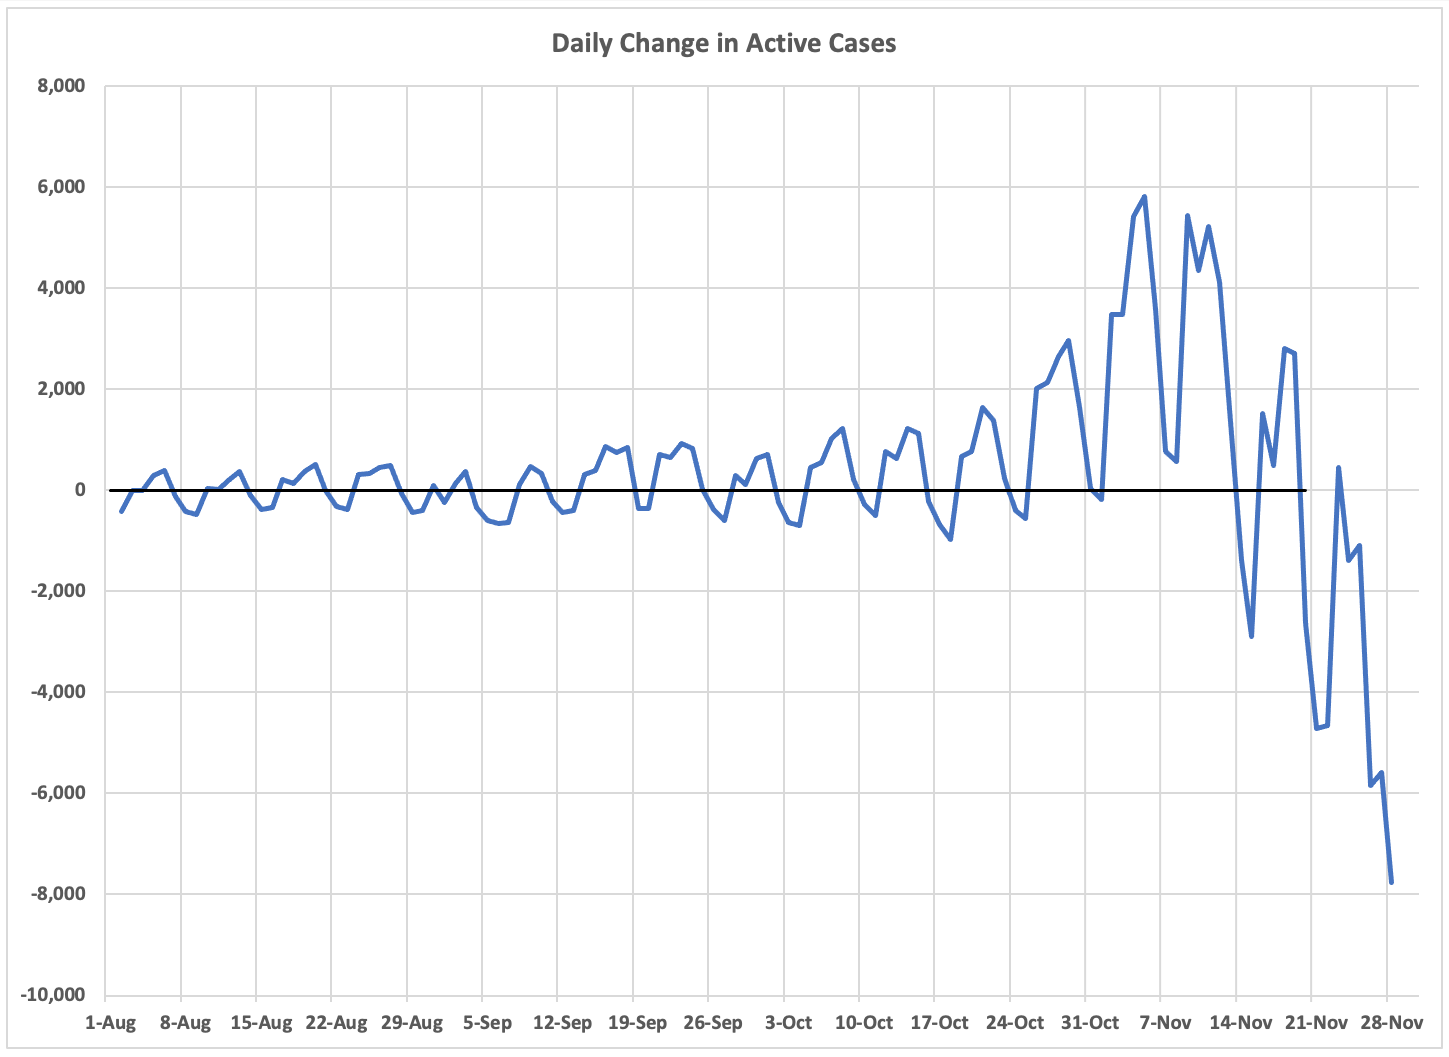
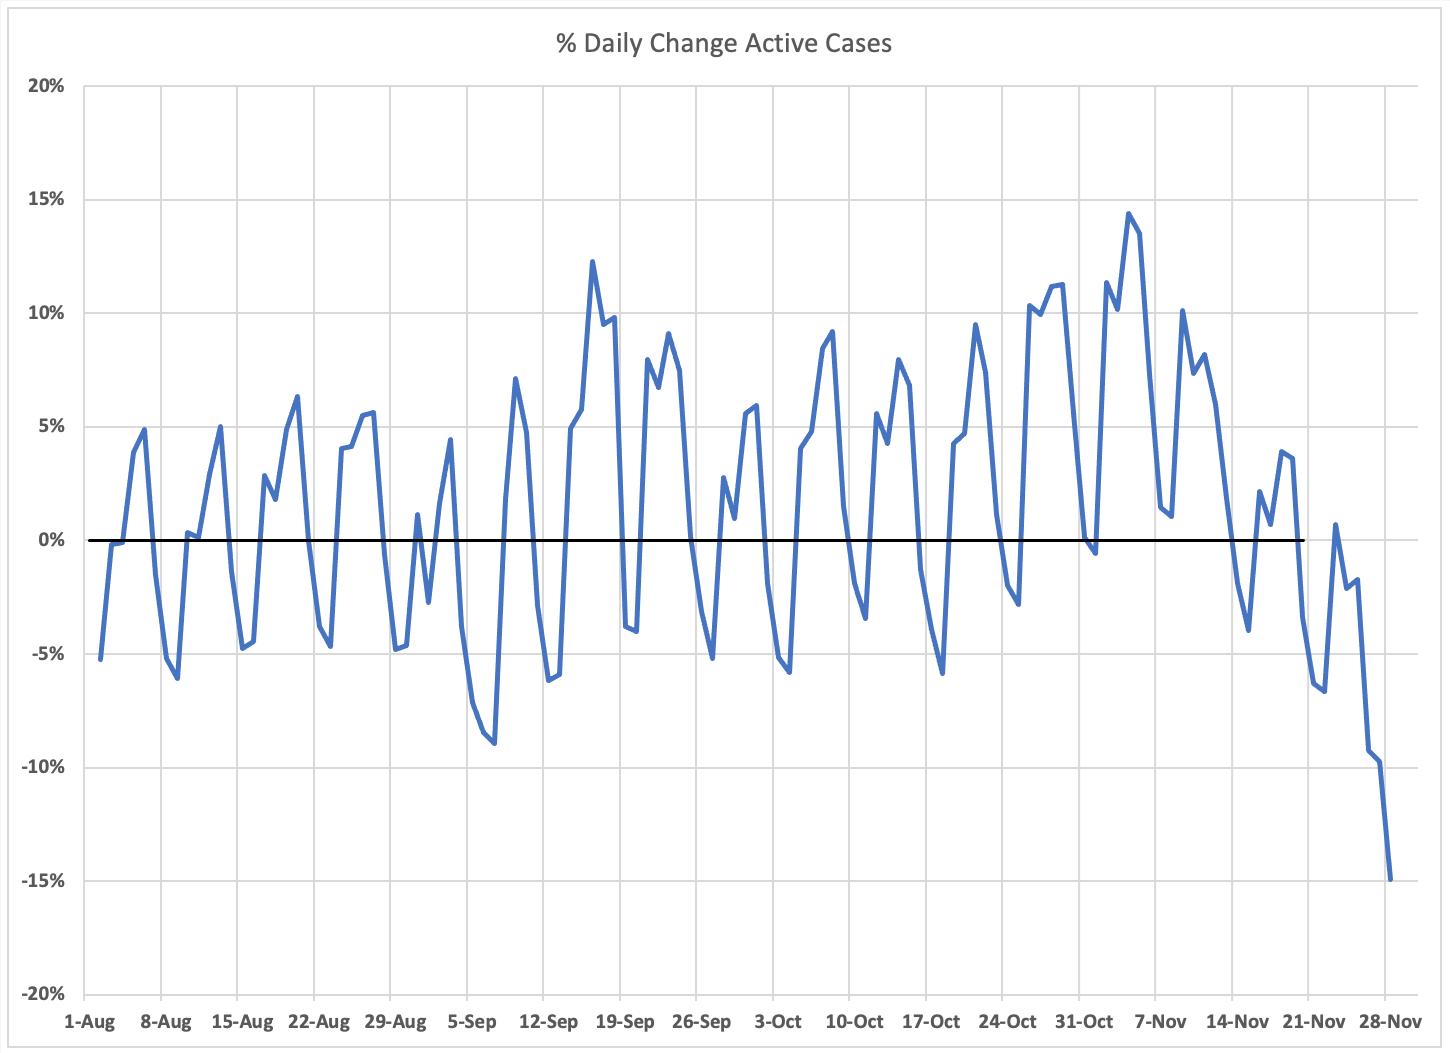
Ignore the last week to ten days, too many cases still being added from late reported test results based on specimens from those days. You can still see the pattern, especially on the daily percent change slide. Active case increases slowed in early November and are now declining and will go negative for a while. I don’t think this is a trough; this is the end of this wave, and we will settle down to a long tail again.

This is good. I hope there are no more spikes. And we can open our school. I am so surprised that none of our reporters are reporting this trend but only daily numbers and creating fear among the people. And I am astounded by the fact that people are so less curious and they are so easy to be scared.
Do you think the IB will try to claim the decline is because of his most recent offers?
yes
The IB will try to claim credit, but as many of us suspected, the peak had already been hit by the time he was making his orders. He likely knew that too, thus the hastened move to “do more” quickly so he could try to take credit for the correlation. His own data however, shows both the Positivity Rate and New Cases per 100k peaked back on 11/10, and had already fallen a good deal by 11/20 (the day before his latest most harsh lockdown began). https://mn.gov/covid19/data/response-prep/public-health-risk-measures.jsp
Again, what is a “case”? A + PCR? That is ridiculous. PCRs are as much as 90% worthless. A “case” is someone who is actually SICK! So these metrics simply repeat the hoax over and over.