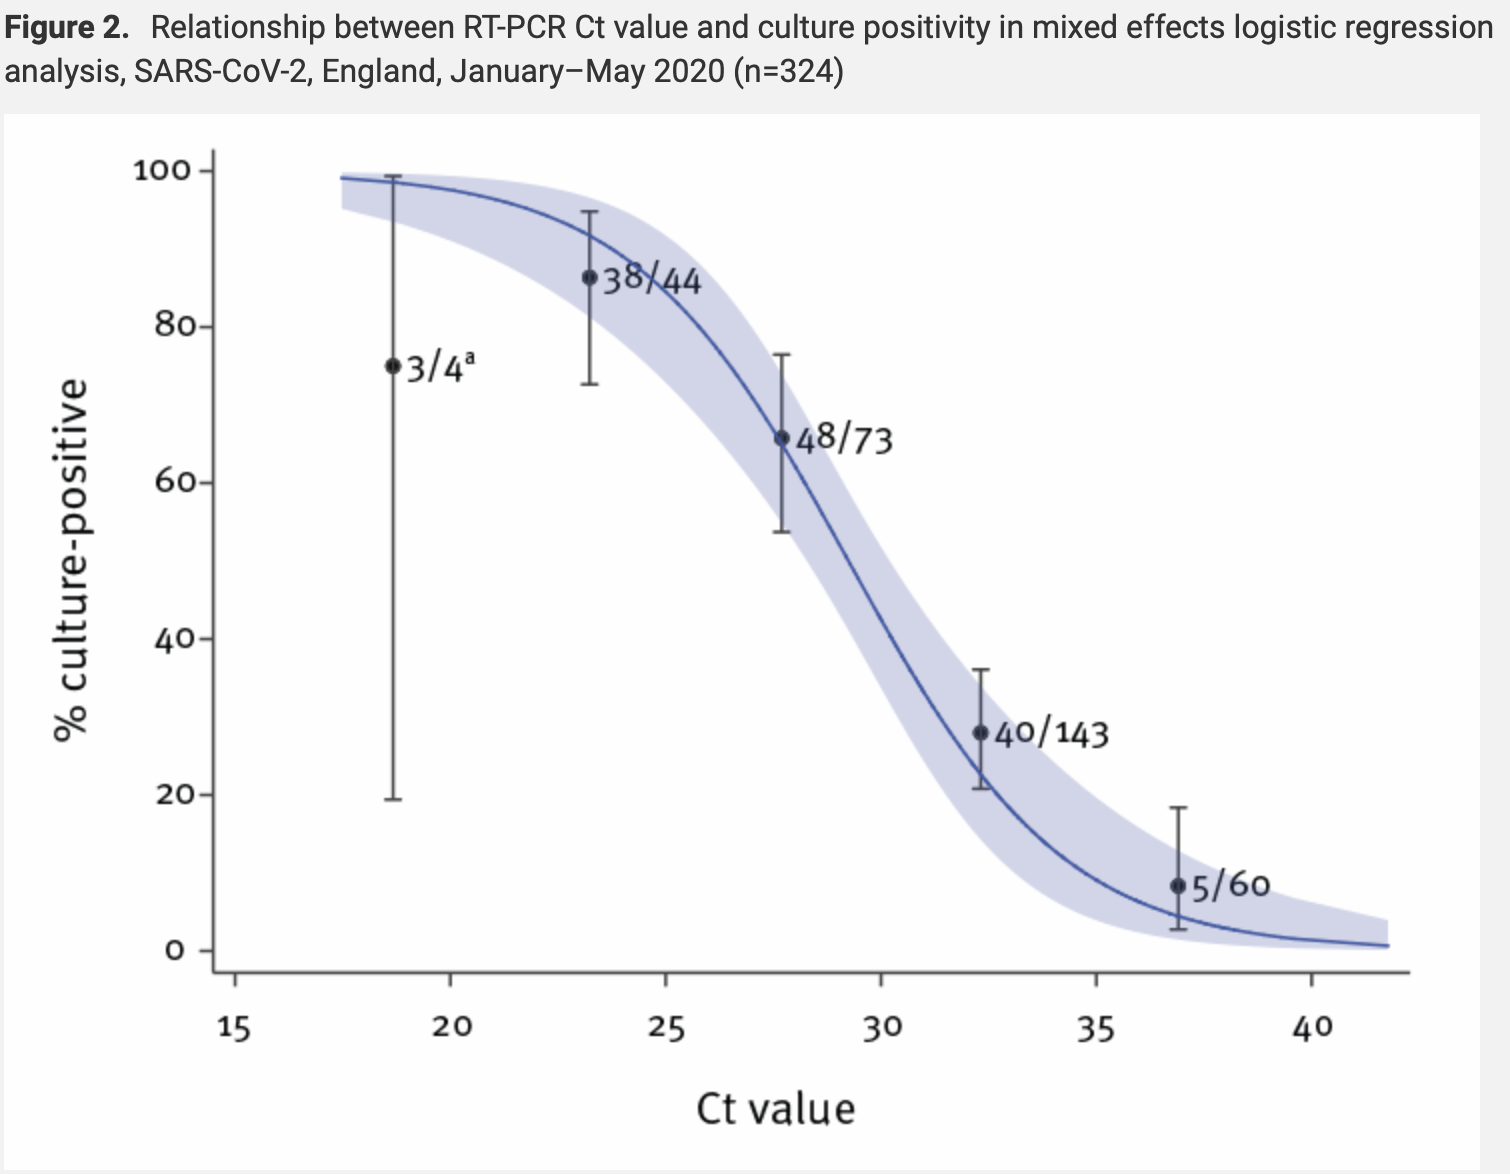
Since I have written so much about the issue of the utility of PCR testing recently, I thought I would include a particularly useful chart from one of the studies. This chart depicts the number of cycles versus the percent of culture positivity. Culture positivity is the gold standard for determining viability of virus being shed. You can see the rapid dropoff around 30 cycles. From what I have been told, Minnesota for example, may be using a cycle number as high as 38. People could reasonably disagree about trying to pick up every possible infectious case versus being more cautious, given the consequences, for example in regard to closing a school.

Maybe you already saw this. If not, I believe you will really appreciate it. By Ivor Cummins: Viral Issue Crucial Update Sept 8th: the Science, Logic and Data Explained! https://www.youtube.com/watch?v=8UvFhIFzaac&t=1254s
Can you please link the article this chart came from?
sorry Matthew I thought the chart you were referring to is the one I just published. The earlier one is from the article I posted on, the Eurosurveillance journal article, and there is a link in that post. Just reposted the link to the meta-review, which I believe has links to most of the relevant studies.