Many readers will recall that during the epidemic Dave Dixon did outstanding work in taking the state of Minnesota’s and other epidemic data and making sense of it so people could see the truth, instead of the misinformation the Incompetent Blowhard and others were spreading. Dave returns here with some data and charts on wildfires in Minnesota. As you will see, there is nothing alarming about recent years, quite the contrary, looks like no particular trend except down for decades with a slight uptick in recent years. Kind of would indicate that we are overdue for more fires of the natural sort, but as you will also see, most forest fires are the work of humans–either accidentally or intentionally. You should also know that according to the federal government, the number of acres of forest in Minnesota has actually crept up in recent decades, so the percent of forest burned in any given year also has likely declined, not increased.
Dave’s notes:
1. The State of Minnesota tracks and publishes data on wildfire in the state. Note that this data includes only fires for the Minnesota Department of Natural Resources is the primary responding agency. This data excludes fires that occur on native American lands, that occur on Federal lands, or fires that are responded to by local fire departments.
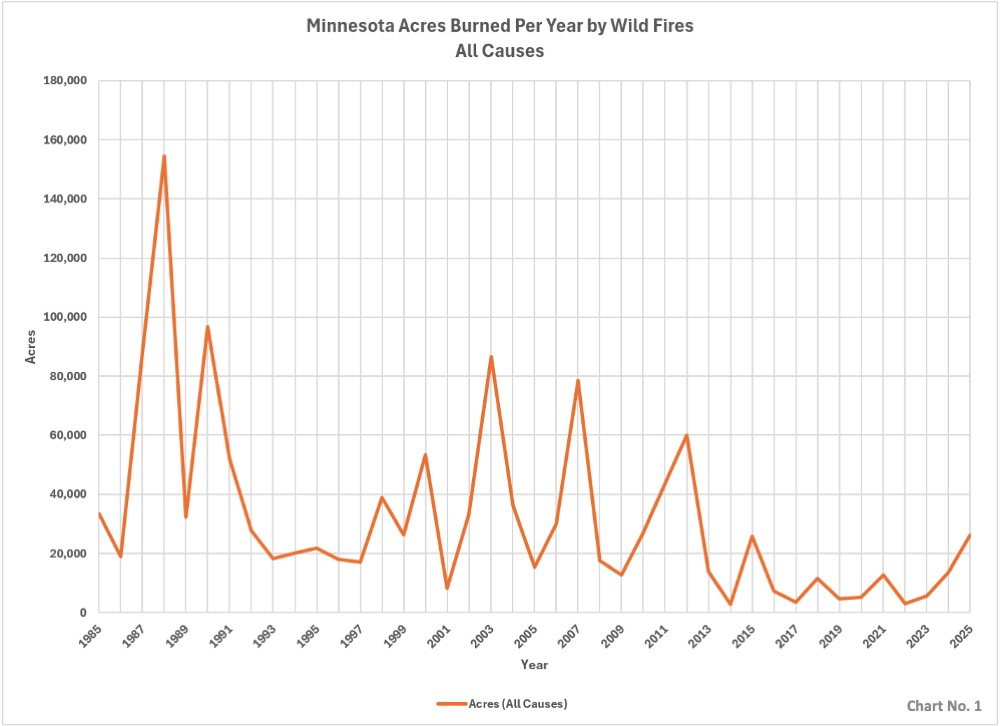
2. Chart 1, Minnesota Acres Burned Per Year by Wild Fires: This chart displays the acres burned in Minnesota. It is readily apparent that there is a negative trend over the time period from 1985 through 2025. Reductions in acres burned could be caused by better land management practices, better fire fighting effectiveness, land use changes, or by climate change. It does not appear likely that climate change is causing an increase in the number of acres burned annually or an increase in the severity of fires.
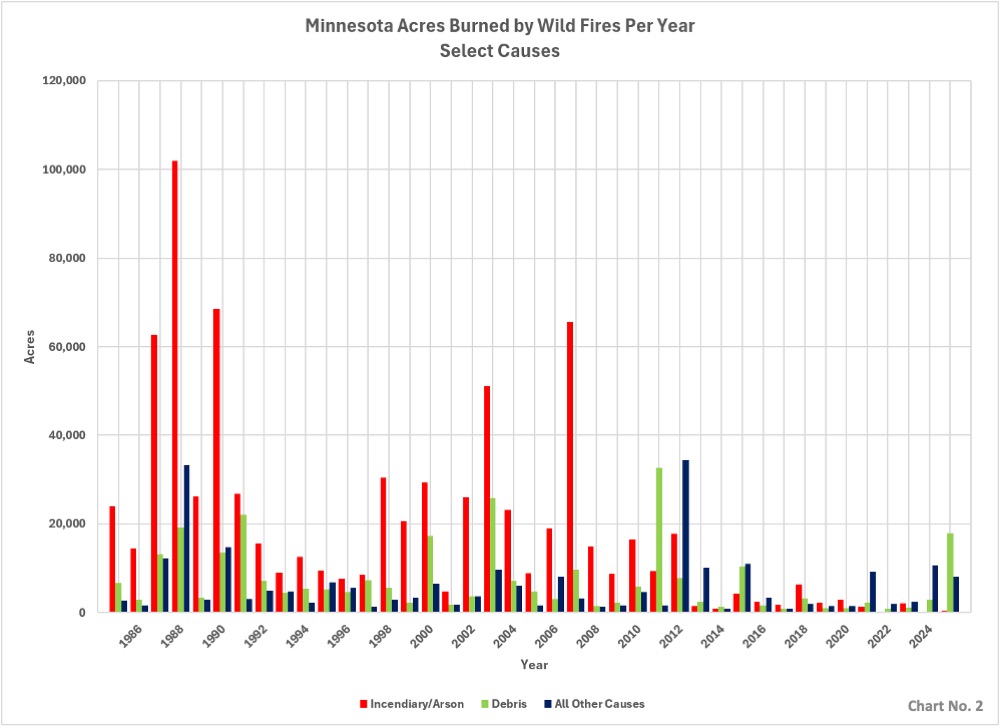
3. Chart 2, Minnesota Acres Burned Per Year, Select Causes: This chart displays the same annual data as Chart 1, but this time sorted by reported cause. By examination, it was seen that the category Incendiary/Arson was one of the most common listed causes of wild fire. No additional detail is given for this type of cause. The second common cause that is displayed is Debris. In the database, there are several sub-types of debris causes that we have summed for display: Debris-Ag., Debris – Burner, Debris – Piled, and Debris – Running. No additional data is provided explaining what these types of causes really are.
It is interesting that from 1985 through 2013 the category of Incendiary/Arson is frequently the largest source of acres burned each year. It is not clear why Incendiary/Arson decreases starting in 2013. The general Debris category is frequently a significant source of acres burned each year, again without any details on how the cause of the wild fire is determined or assigned.
4. Raw data can be downloaded here: https://gis.data.mn.gov/datasets/89297213073247bc84a58dfdd6fe5ca6_0/explore?location=46.378352%2C-93.291584%2C7
5. Metadata is found here: https://resources.gisdata.mn.gov/pub/gdrs/data/pub/us_mn_state_dnr/env_wildfires_tracked_by_mndnr/metadata/metadata.html
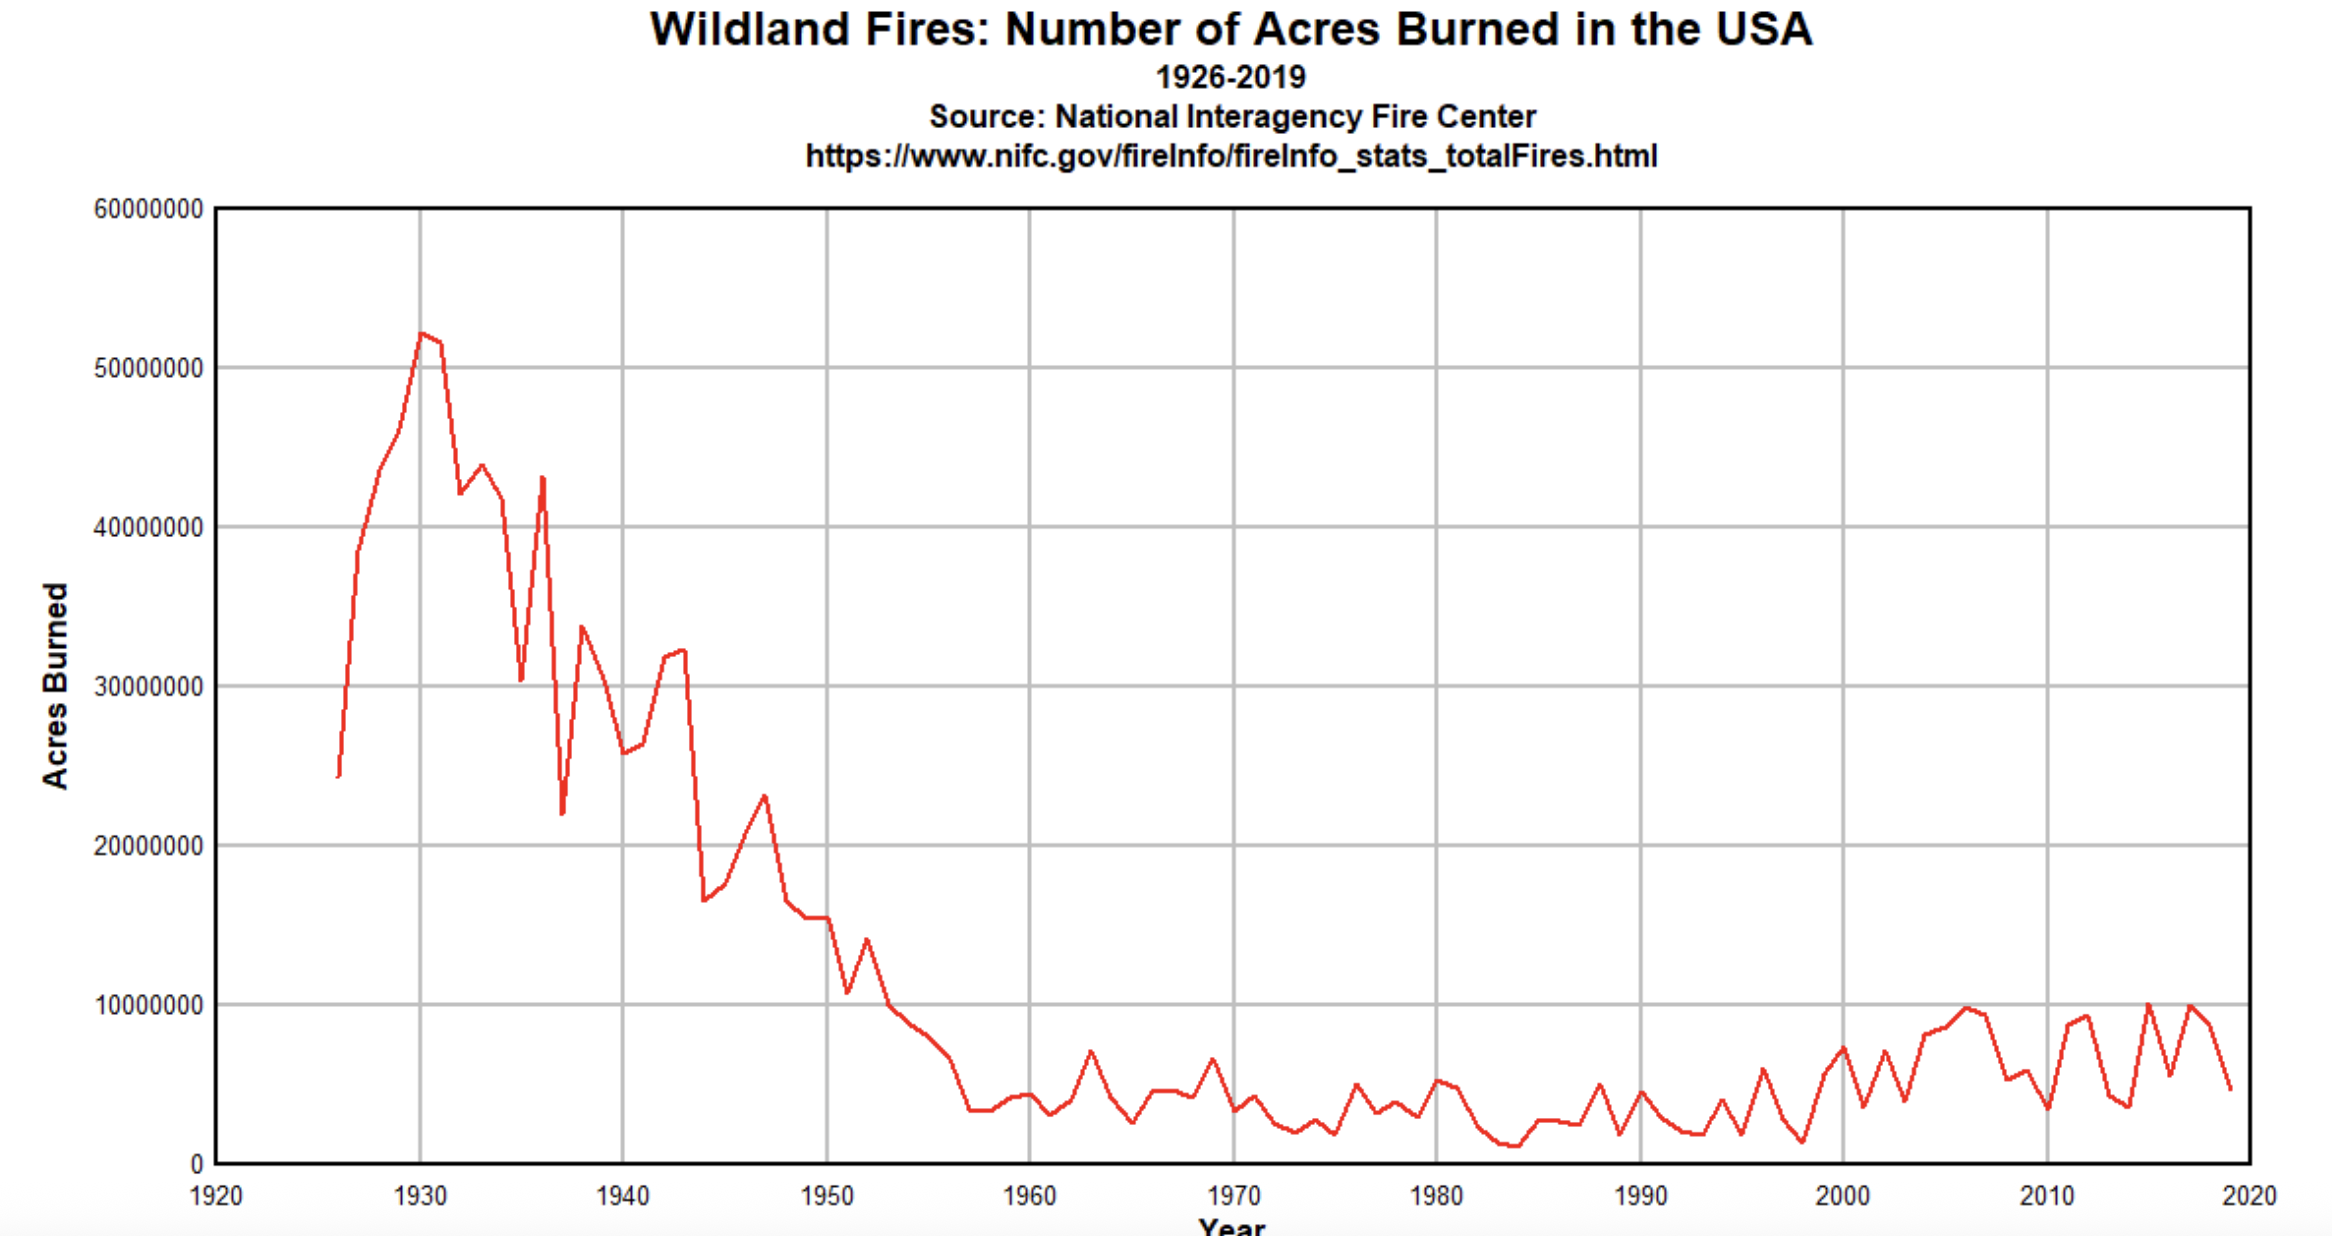
And here for further context is the national acres burned data, straight from the Federal Government.